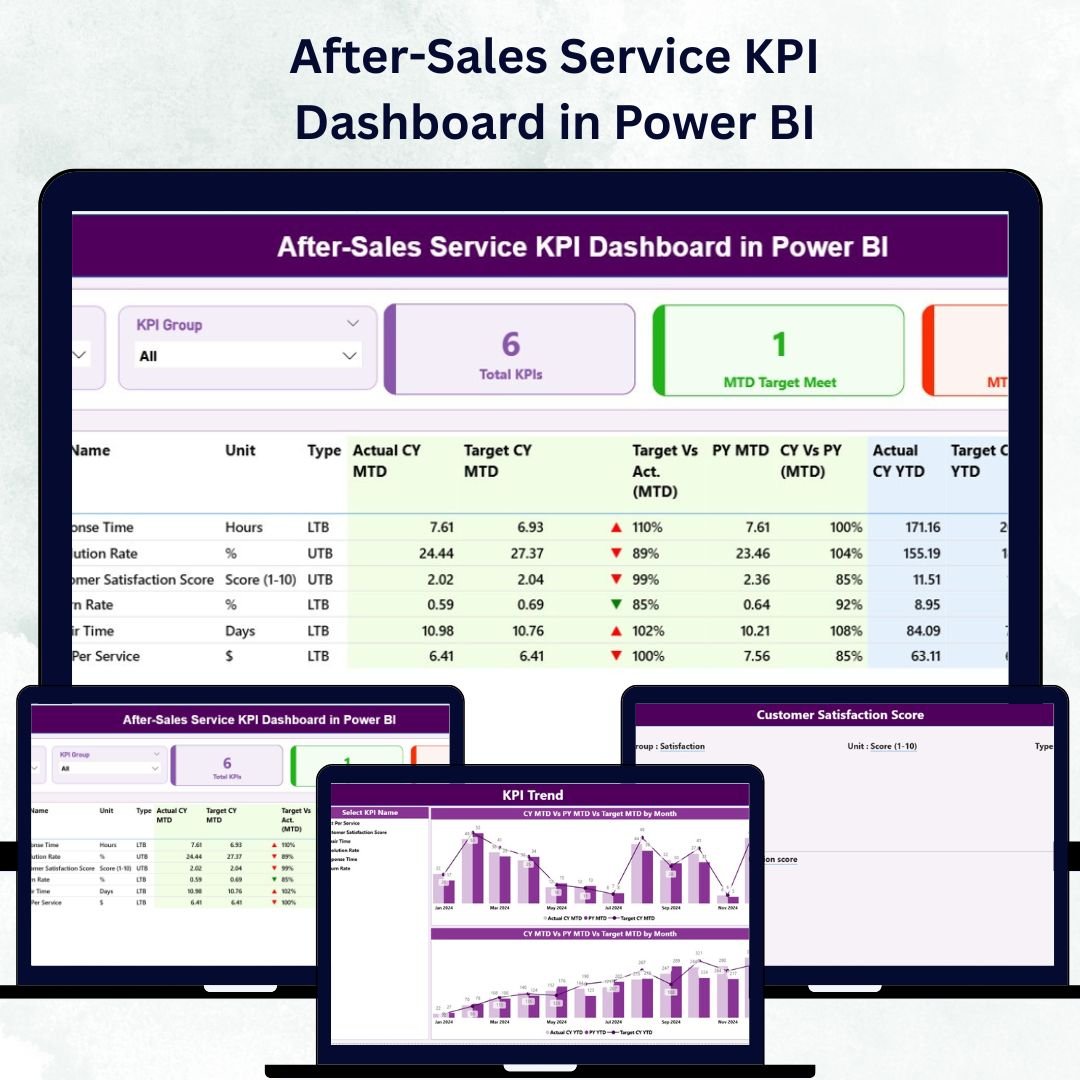
In today’s customer-centric world, service quality defines brand success. A great product may earn a customer once, but great service keeps them forever. That’s why the After-Sales Service KPI Dashboard in Power BI is a must-have for any business that values loyalty, reputation, and repeat business.
This ready-to-use, interactive Power BI dashboard gives you real-time visibility into your after-sales performance — helping you measure customer satisfaction, service quality, response times, and efficiency in one place.
Whether you manage a service center, handle warranty requests, or track complaint resolutions, this dashboard helps you make data-driven decisions that improve customer experience and operational excellence.
⚙️ Key Features of After-Sales Service KPI Dashboard in Power BI
✅ 📄 Three Powerful Analytical Pages – Summary, KPI Trend, and KPI Definition — each purpose-built for in-depth insight and easy navigation.
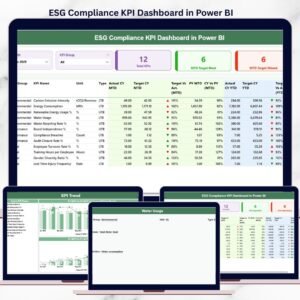
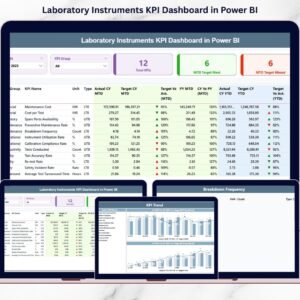
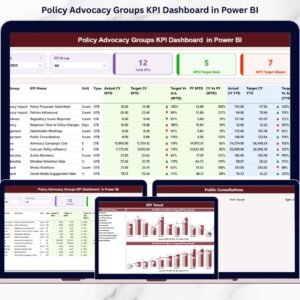
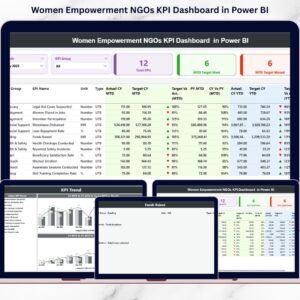
✅ 📊 Summary Page (Central Control Panel) – View Total KPI Count, MTD Target Met Count, and MTD Target Missed Count instantly. The data table displays each KPI’s Group, Unit, Type (UTB/LTB), Actual vs Target, and Previous Year comparison.
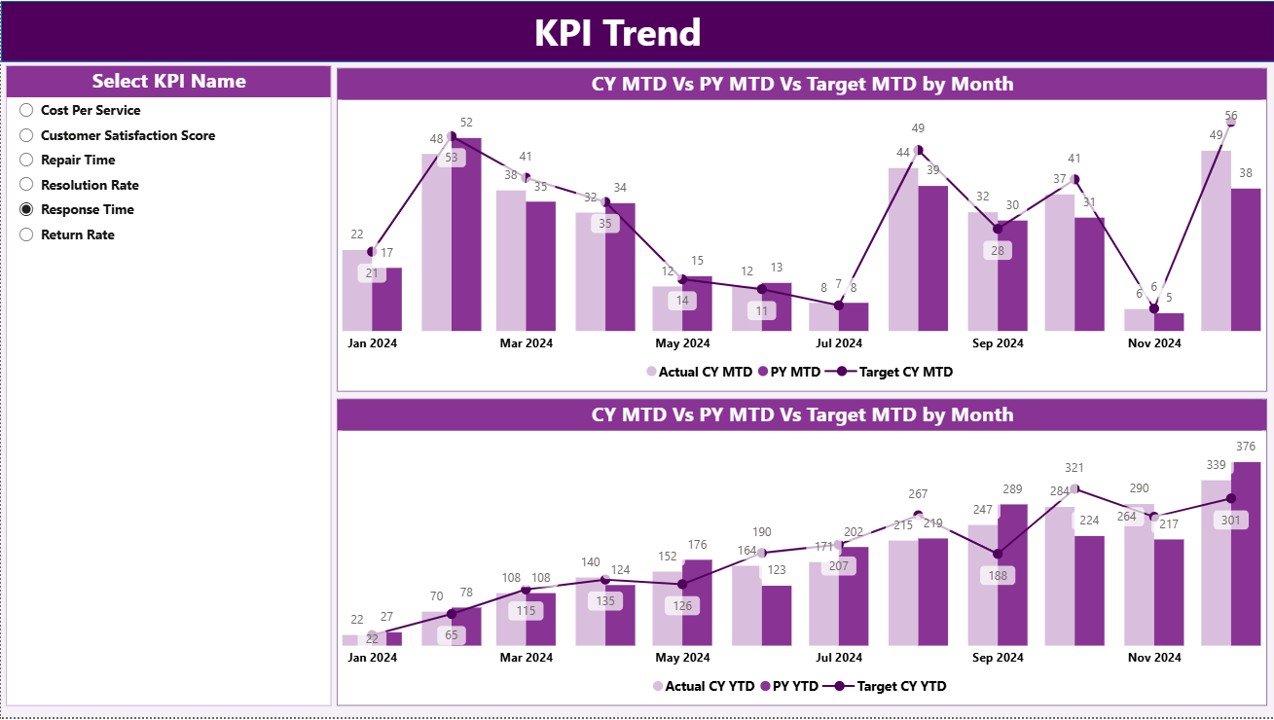
✅ 📈 KPI Trend Page – Two combo charts (for MTD and YTD) show Actual, Target, and Previous Year values. Use the KPI slicer to track trends and performance progress visually.
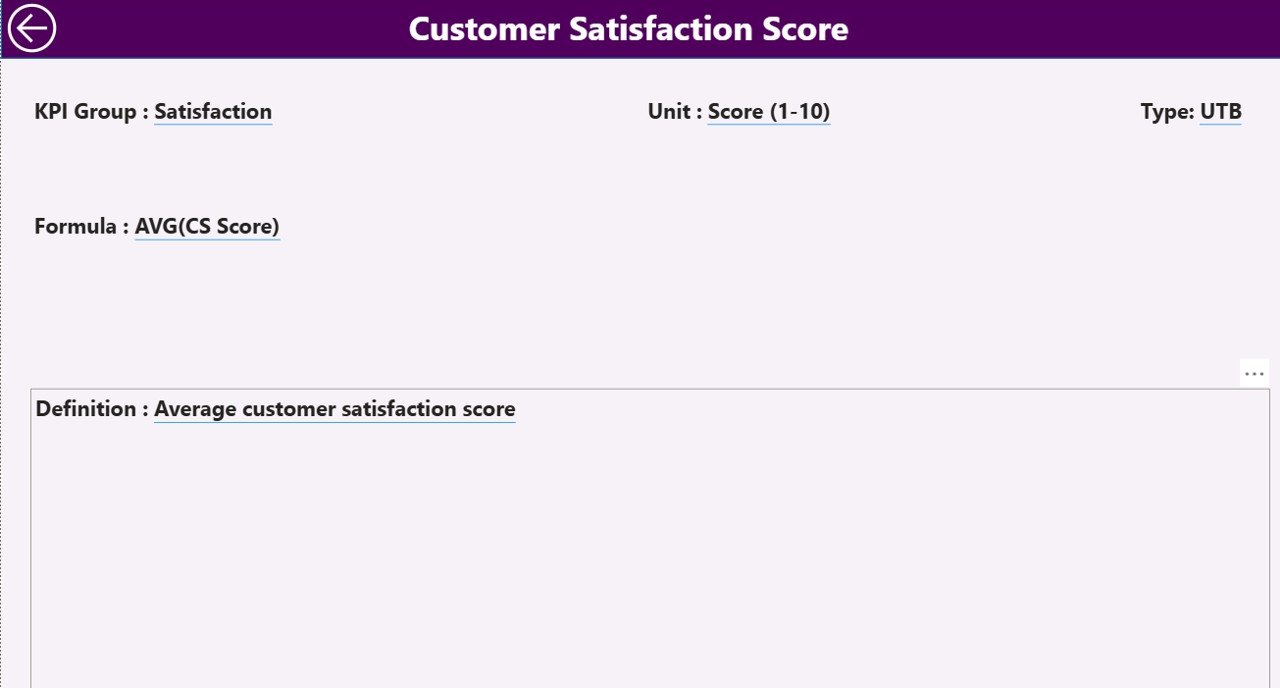
✅ 📘 KPI Definition Page – A hidden drill-through page where you can see each KPI’s Formula, Definition, Unit, and Type — ensuring clarity and standardization across the organization.
✅ 💾 Excel-Based Data Source – Connected to structured Excel sheets (Input_Actual, Input_Target, KPI Definition) for seamless updates and Power BI refresh.
✅ ⚡ Automatic Updates – Once linked, Power BI refreshes data automatically, ensuring real-time reporting without manual work.
✅ 🧠 Performance Icons – Built-in ▲ and ▼ indicators highlight which KPIs meet or miss targets — no extra calculations needed.
✅ 🔍 Easy Filtering – Filter data by Month and KPI Group for quick, focused analysis.
✅ 📂 Transparent Structure – All formulas and metrics are clearly documented for total visibility and consistency.
🧩 What’s Inside the After-Sales Service KPI Dashboard
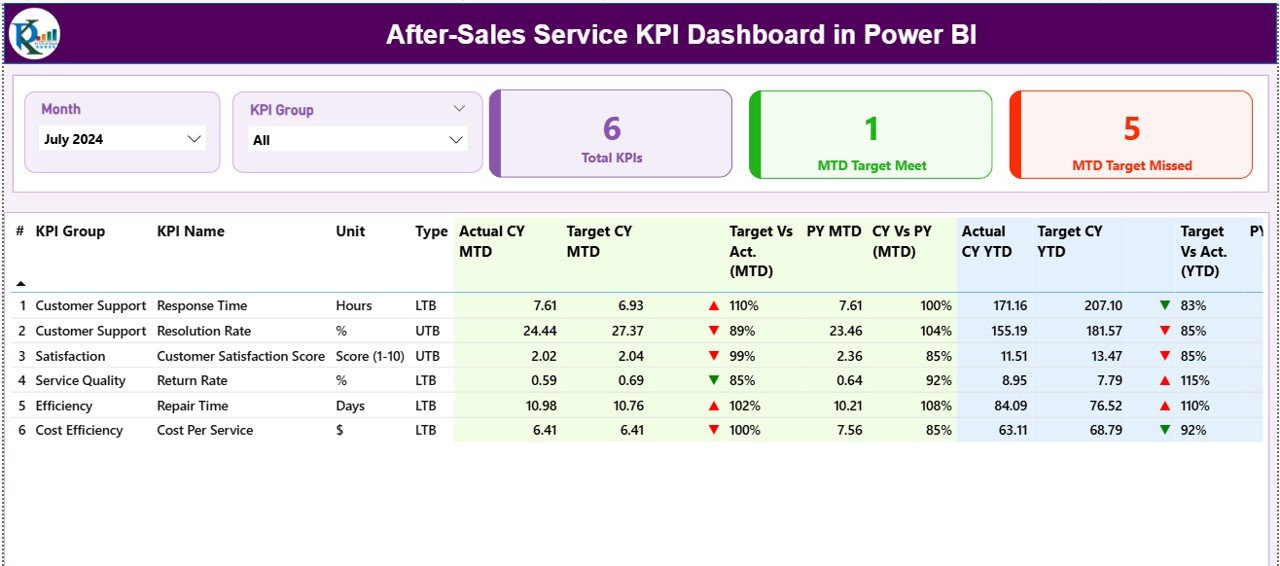
📁 Summary Page: The heart of the dashboard — your one-stop view for KPI performance across departments and service areas.
📁 KPI Trend Page: Analyze performance evolution over time using MTD and YTD comparisons.
📁 KPI Definition Page: Understand exactly how each KPI is calculated and what it represents.
📁 Excel File (Data Source): Structured with three sheets — Input_Actual, Input_Target, and KPI Definition — all Power BI-ready.
Every chart, card, and metric is dynamically linked, so updating your Excel file automatically updates your Power BI visuals — saving you hours of manual effort every month.
💡 How to Use the After-Sales Service KPI Dashboard
1️⃣ Enter your data in the Excel sheets (Actual, Target, Definition).
2️⃣ Connect Power BI to the Excel source file using Power Query.
3️⃣ Use slicers to filter by Month or KPI Group.
4️⃣ Drill through to the KPI Definition Page for detailed metric info.
5️⃣ Publish & share securely via Power BI Service for web or mobile viewing.
6️⃣ Schedule refreshes weekly or monthly to keep data up-to-date automatically.
You don’t need any coding or advanced BI skills — the dashboard is completely plug-and-play!
👩💼 Who Can Benefit from This Dashboard
🏭 Manufacturers – Track warranty repairs, parts turnaround, and service quality.
🚗 Automotive Dealers – Monitor customer satisfaction, resolution rates, and feedback.
📱 Consumer Electronics Companies – Manage complaints, returns, and installations.
🏬 Retail Chains – Track returns and post-purchase assistance across locations.
🧰 Service & Support Teams – Identify performance gaps and training needs.
💡 Business Analysts & Executives – Access high-level KPI summaries instantly.
If your goal is happy customers and efficient service, this dashboard turns your after-sales department into a growth engine.
🔗 Click here to read the Detailed blog post
📺 Visit our YouTube channel to learn step-by-step video tutorials
👉 YouTube.com/@PKAnExcelExpert


Reviews
There are no reviews yet.