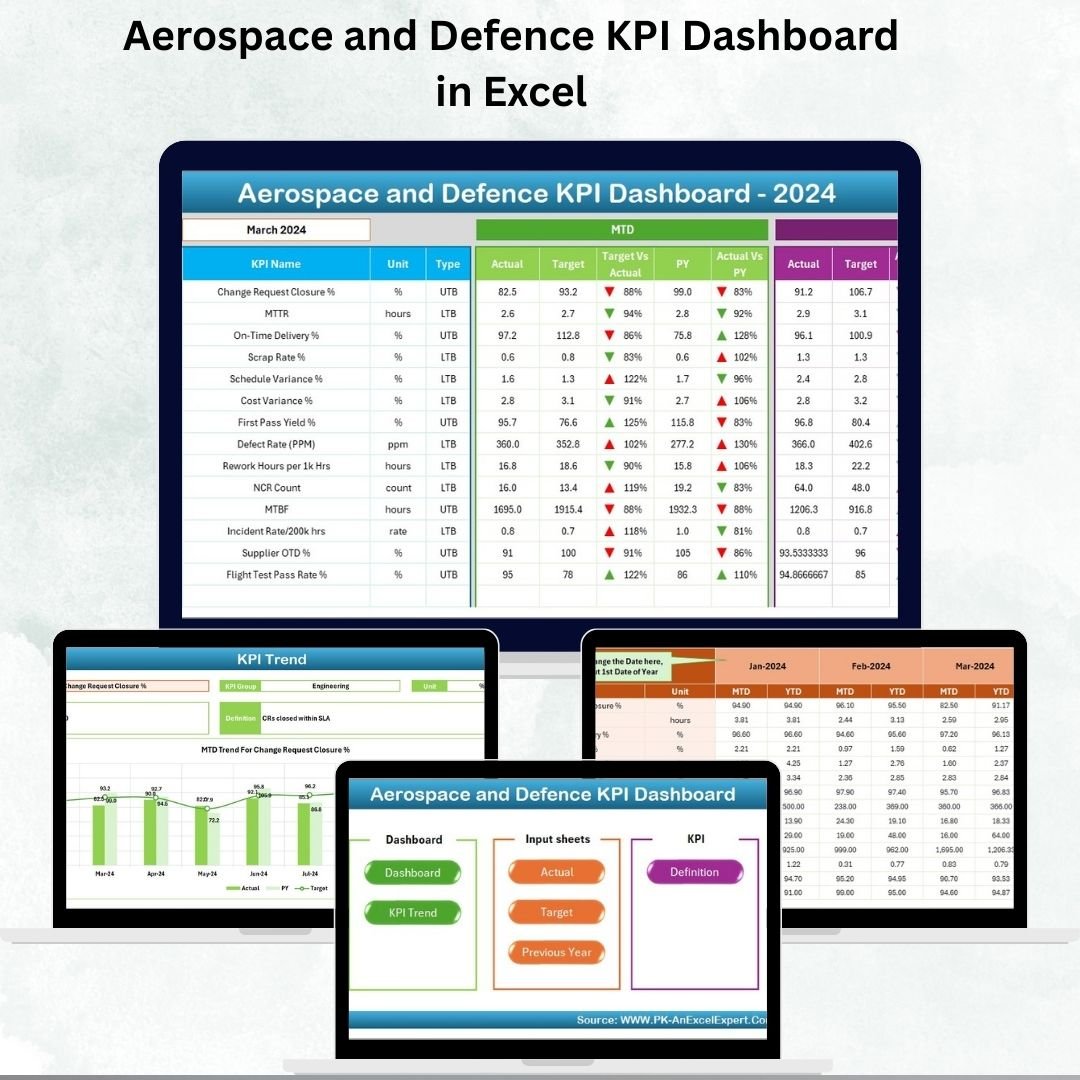
The aerospace and defence industry operates in one of the most complex and highly regulated environments in the world. From balancing innovation with compliance to tracking cost efficiency, safety, and performance, organizations need robust tools to measure, analyze, and act on critical data. That’s where the Aerospace and Defence KPI Dashboard in Excel comes in.
This ready-to-use Excel-based dashboard empowers companies to consolidate data, visualize performance, and make informed decisions—all within a single, structured template. Built with predesigned worksheets, dynamic charts, and conditional formatting, it helps aerospace and defence leaders monitor progress, identify risks, and maintain operational efficiency.
Unlike expensive BI tools, Excel offers accessibility, affordability, and customization without steep learning curves. This dashboard combines those advantages with a professional structure designed specifically for the unique challenges of aerospace and defence organizations.
✨ Key Features of the Aerospace and Defence KPI Dashboard
✅ Home Sheet
-
Acts as the index page of the dashboard.
-
Includes navigation buttons for quick access to all sheets.
-
Provides a clean, professional entry point.
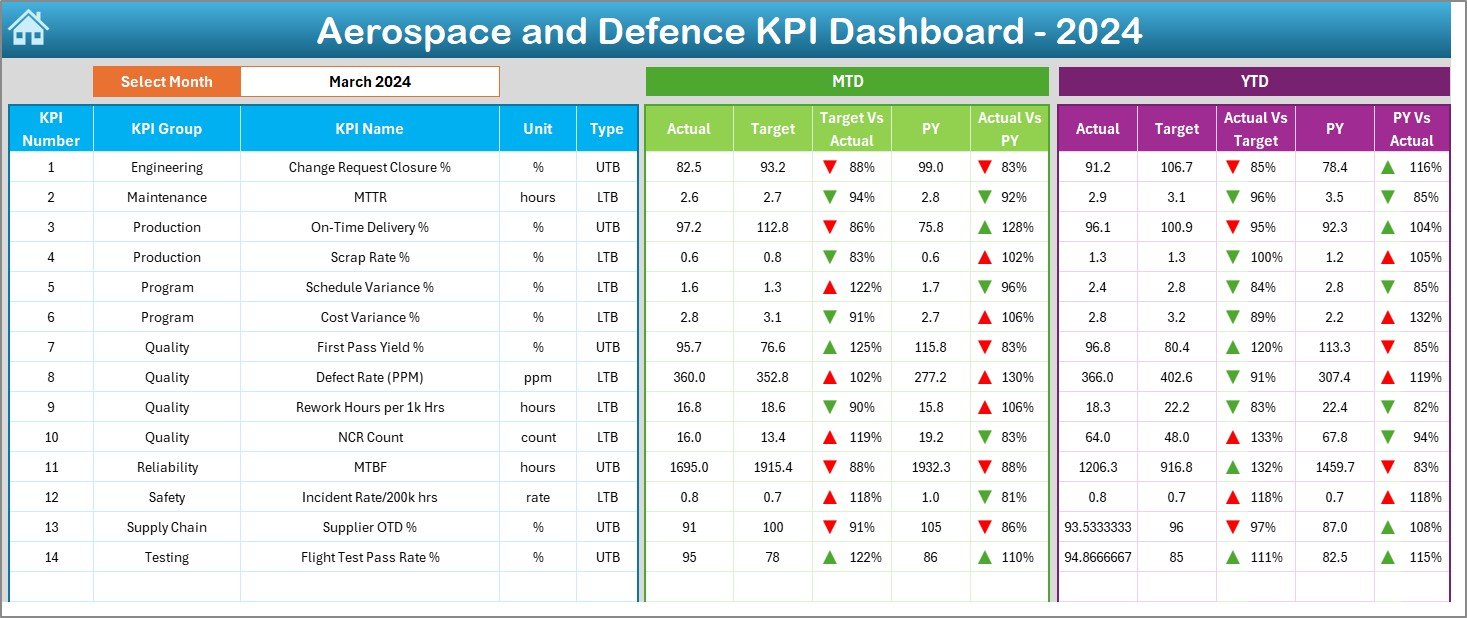
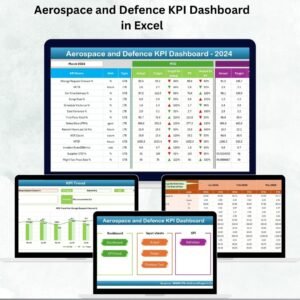
✅ Dashboard Sheet Tab
-
The main page where all critical KPIs are displayed.
-
Drop-down month selector (Cell D3) dynamically updates the dashboard.
-
Displays Month-to-Date (MTD) and Year-to-Date (YTD) performance.
-
Conditional formatting with arrows highlights whether KPIs are improving or declining.
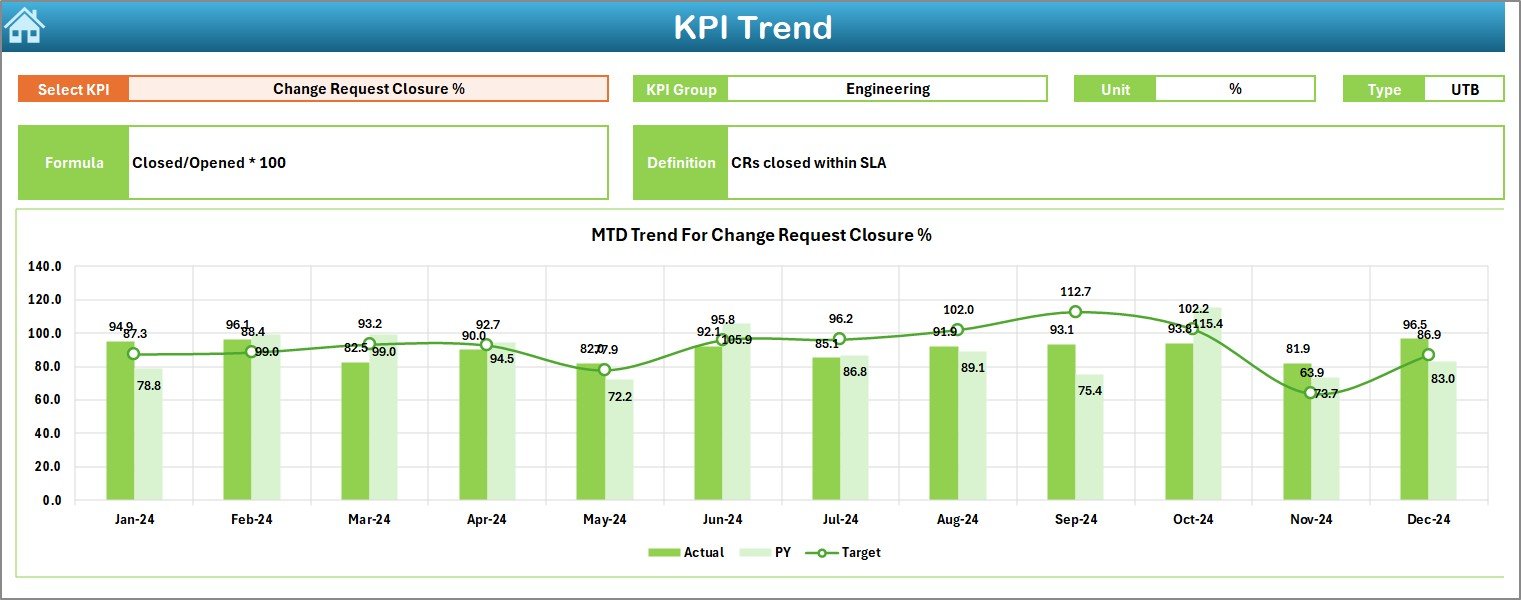
✅ KPI Trend Sheet Tab
-
Allows focused analysis of a single KPI (Cell C3).
-
Displays KPI metadata such as group, unit, type (Upper the Better/Lower the Better), formula, and definition.
-
Includes detailed MTD and YTD trend charts to track changes over time.
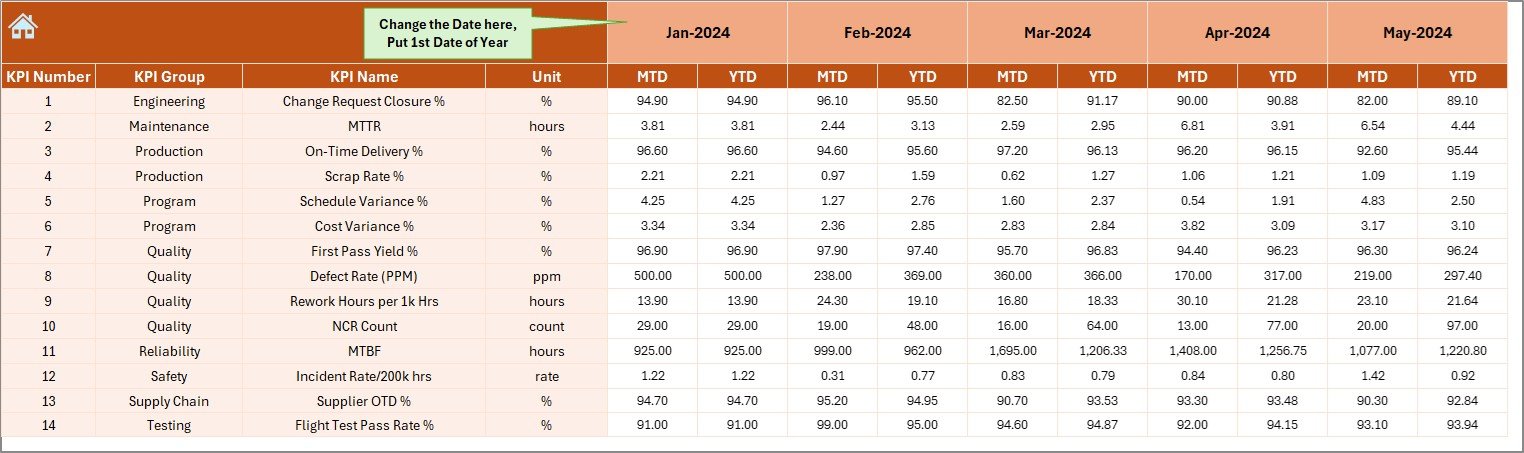
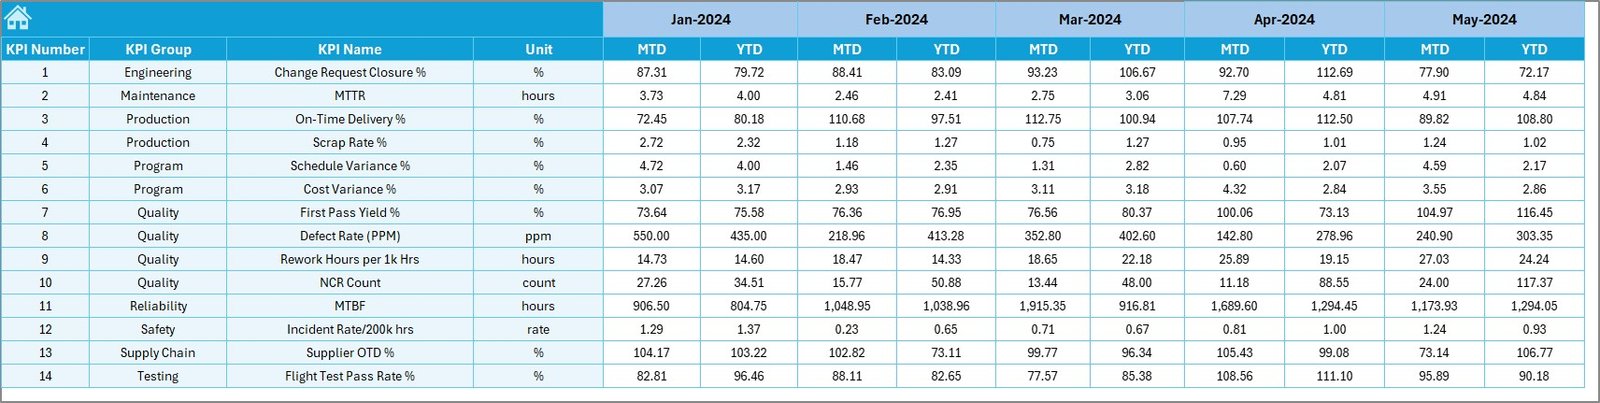
✅ Actual Numbers Input Sheet
-
Enter actual performance values for KPIs.
-
Supports both MTD and YTD inputs.
-
Month setup is managed from Cell E1 for easy alignment.
✅ Target Sheet Tab
-
Stores monthly and yearly target values.
-
Enables comparison between planned vs. actual outcomes.
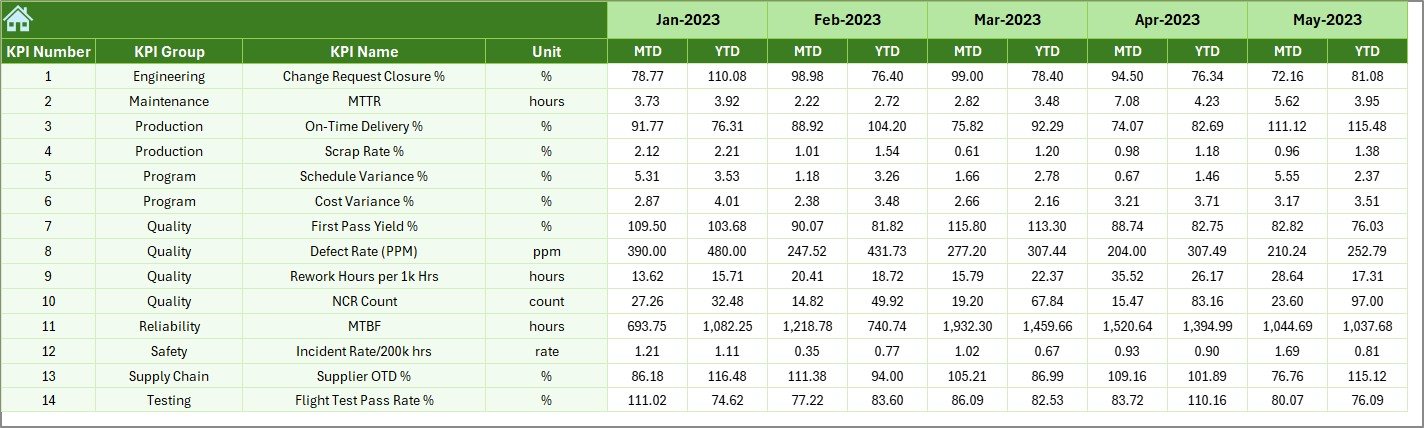
✅ Previous Year Numbers Sheet
-
Stores historical KPI data.
-
Provides baseline data for year-on-year comparisons.
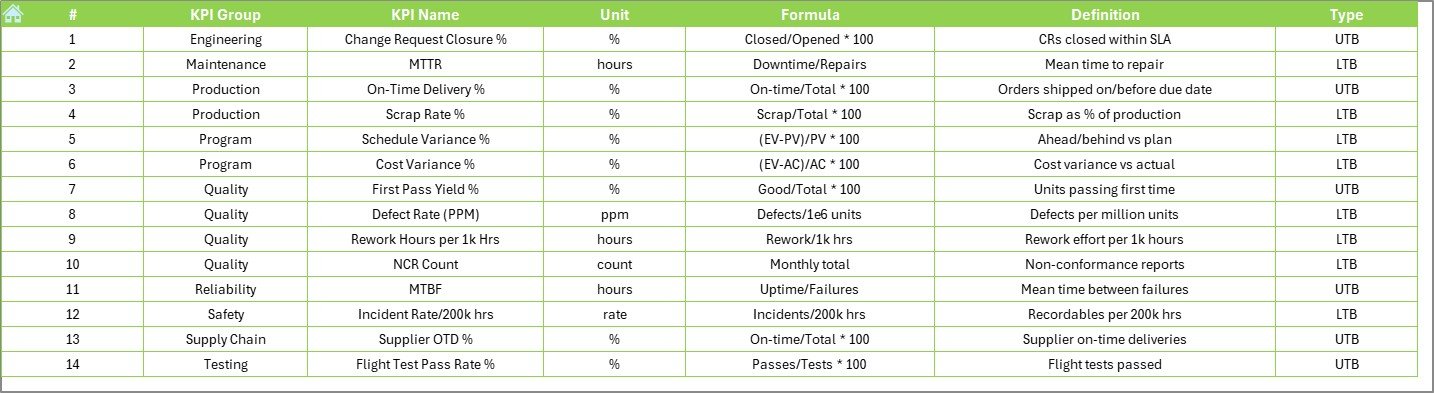
✅ KPI Definition Sheet Tab
-
Serves as a reference library of KPIs.
-
Includes KPI Group, KPI Name, Unit, Formula, and Definition.
-
Ensures clarity and consistency across reporting.
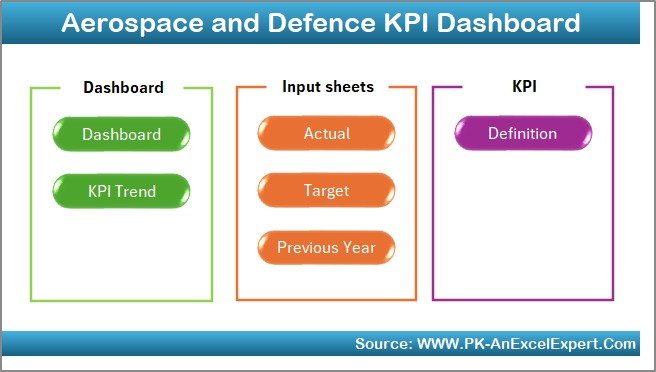
📦 What’s Inside the Dashboard
-
Home Sheet – Navigation hub with quick-access buttons.
-
Dashboard Tab – Executive view of KPIs with MTD & YTD insights.
-
KPI Trend Tab – Drill-down analysis of individual KPIs.
-
Actual Numbers Input Sheet – Record monthly and yearly results.
-
Target Sheet – Define and store targets.
-
Previous Year Sheet – Historical benchmark for performance tracking.
-
KPI Definition Sheet – Transparent explanation of all metrics.
🛠️ How to Use the Aerospace and Defence KPI Dashboard
-
Start at the Home Sheet – Use navigation buttons to move around.
-
Enter Data – Input actual numbers in the Actual Numbers sheet.
-
Set Targets – Define monthly and yearly goals in the Target sheet.
-
Compare Against History – Refer to the Previous Year sheet for benchmarks.
-
View Performance – Open the Dashboard tab for real-time insights.
-
Analyze Trends – Use the KPI Trend tab to see long-term patterns.
-
Customize KPIs – Add or edit KPIs in the KPI Definition sheet as needed.
👩💼 Who Can Benefit from This Dashboard?
-
Project Managers – Track budgets, manpower, and delivery timelines.
-
Defence Contractors – Measure supplier performance and compliance.
-
Compliance Officers – Monitor safety regulations and standards adherence.
-
Operations Teams – Improve resource allocation and efficiency.
-
Executives & Decision-Makers – Gain visibility into organizational performance.
🚀 Advantages of Aerospace and Defence KPI Dashboard
-
Centralized Tracking – Consolidates all KPIs into one structured tool.
-
Accuracy – Reduces manual errors with predefined input sheets.
-
Actionable Insights – Clear visuals with up/down arrows for trends.
-
Time-Saving – Automates calculations and reports with dropdown-driven analysis.
-
Strategic Alignment – Keeps departments focused on organizational goals.
-
Cost-Effective – Offers BI-like functionality at a fraction of the cost.
📈 Opportunities for Improvement
-
Automate data entry with Power Query or VBA.
-
Add real-time updates by connecting to ERP systems.
-
Expand KPIs to cover risk management and security metrics.
-
Enhance visuals with gauges, heatmaps, or drill-down charts.
-
Enable multi-user access with SharePoint or Teams integration.
✅ Best Practices
-
Define KPIs that align with strategic goals.
-
Update data monthly for accuracy.
-
Use conditional formatting to highlight critical variances.
-
Review KPI trends frequently to predict risks.
-
Train staff on navigation for better adoption.


Reviews
There are no reviews yet.