Tracking advertising performance doesn’t have to be complicated or expensive 💡. The Advertising KPI Scorecard in Excel is your all-in-one, ready-to-use template designed to help marketers, agencies, and business owners monitor campaign results with clarity and confidence.
This professional Excel scorecard transforms raw data into visual, actionable insights — so you can focus on optimizing performance and boosting ROI 📊. Whether you’re running digital ads, social media promotions, or traditional marketing campaigns, this dashboard gives you the control you need to make smarter decisions.
✨ Key Features of the Advertising KPI Scorecard in Excel
✅ Centralized Dashboard View: Analyze your entire advertising performance in one place — no more switching between tools or reports.
✅ Actual vs Target Comparison: Quickly compare what’s achieved against your set targets to measure progress at a glance.
✅ Color-Coded Indicators: Instantly spot good or poor performance using red, yellow, and green signals with Excel’s conditional formatting.
✅ Month Selector and Trend Analysis: Select any month from a dropdown and instantly view MTD or YTD progress trends.
✅ Dynamic KPI Charts: Track key metrics such as CTR, CPA, ROAS, and Conversion Rate through interactive line and column charts.
✅ Fully Customizable: Add, remove, or modify KPIs according to your organization’s advertising strategy.
✅ Automatic Data Flow: Data entered once is reflected across all sheets automatically — saving hours of manual updates.
✅ Cost-Effective Solution: No subscriptions, no external tools — just Excel’s powerful capabilities at your fingertips.
📦 What’s Inside the Advertising KPI Scorecard in Excel
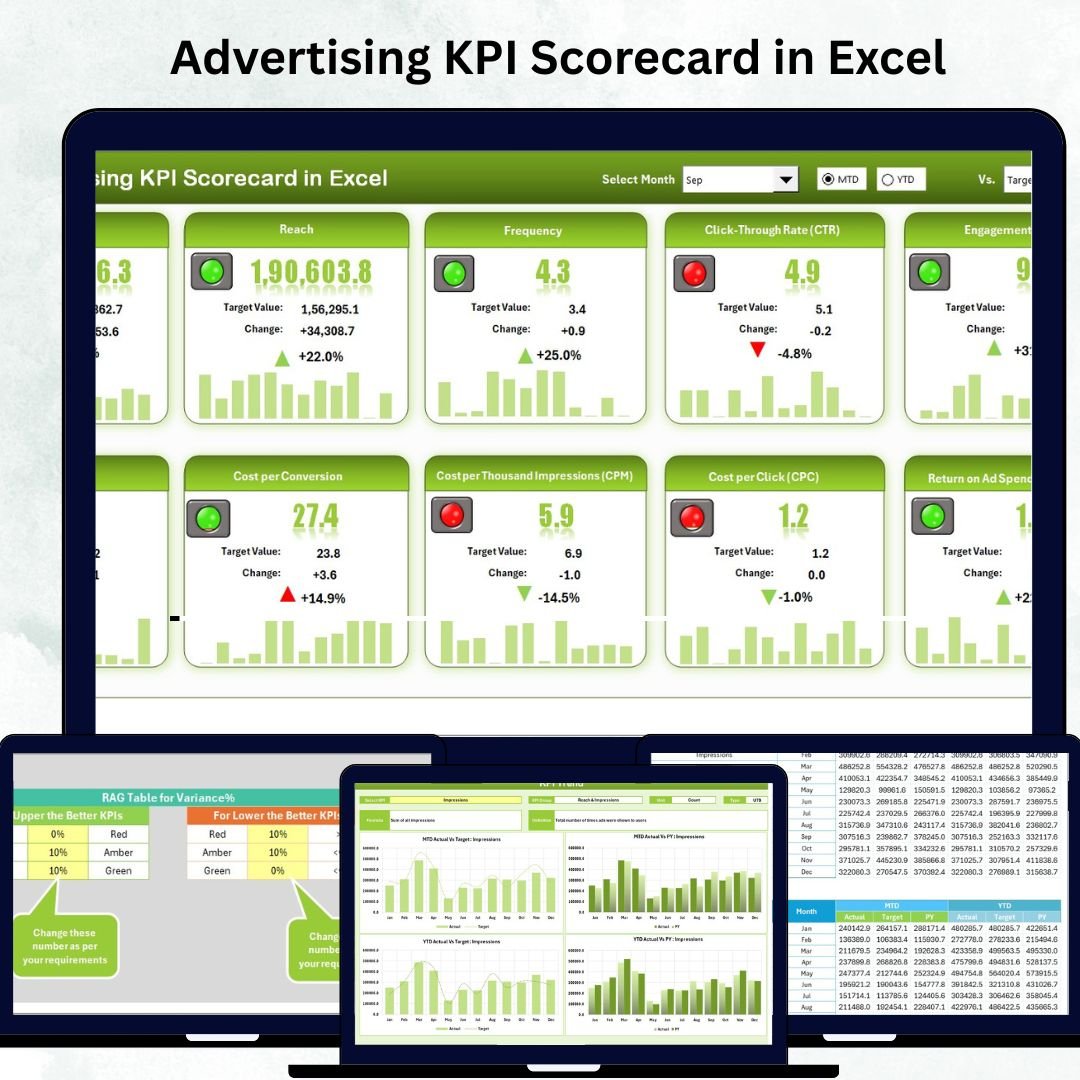
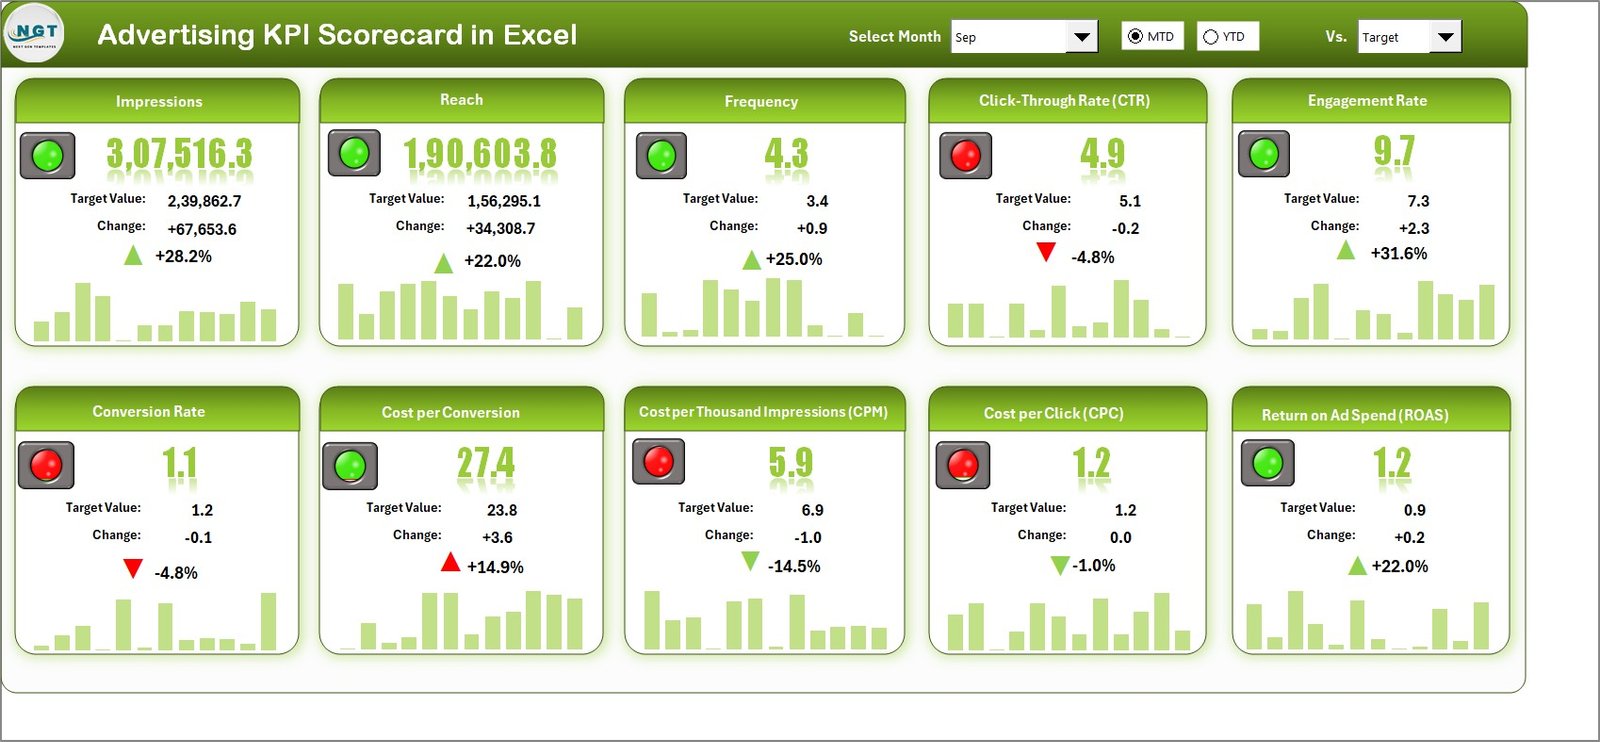
🧩 1. Scorecard Sheet:
This is your main dashboard — a clean and interactive interface showing all KPIs in a compact, color-coded view. You can review 10 KPIs at once, compare Actual vs Target, and instantly identify whether performance is improving or declining.
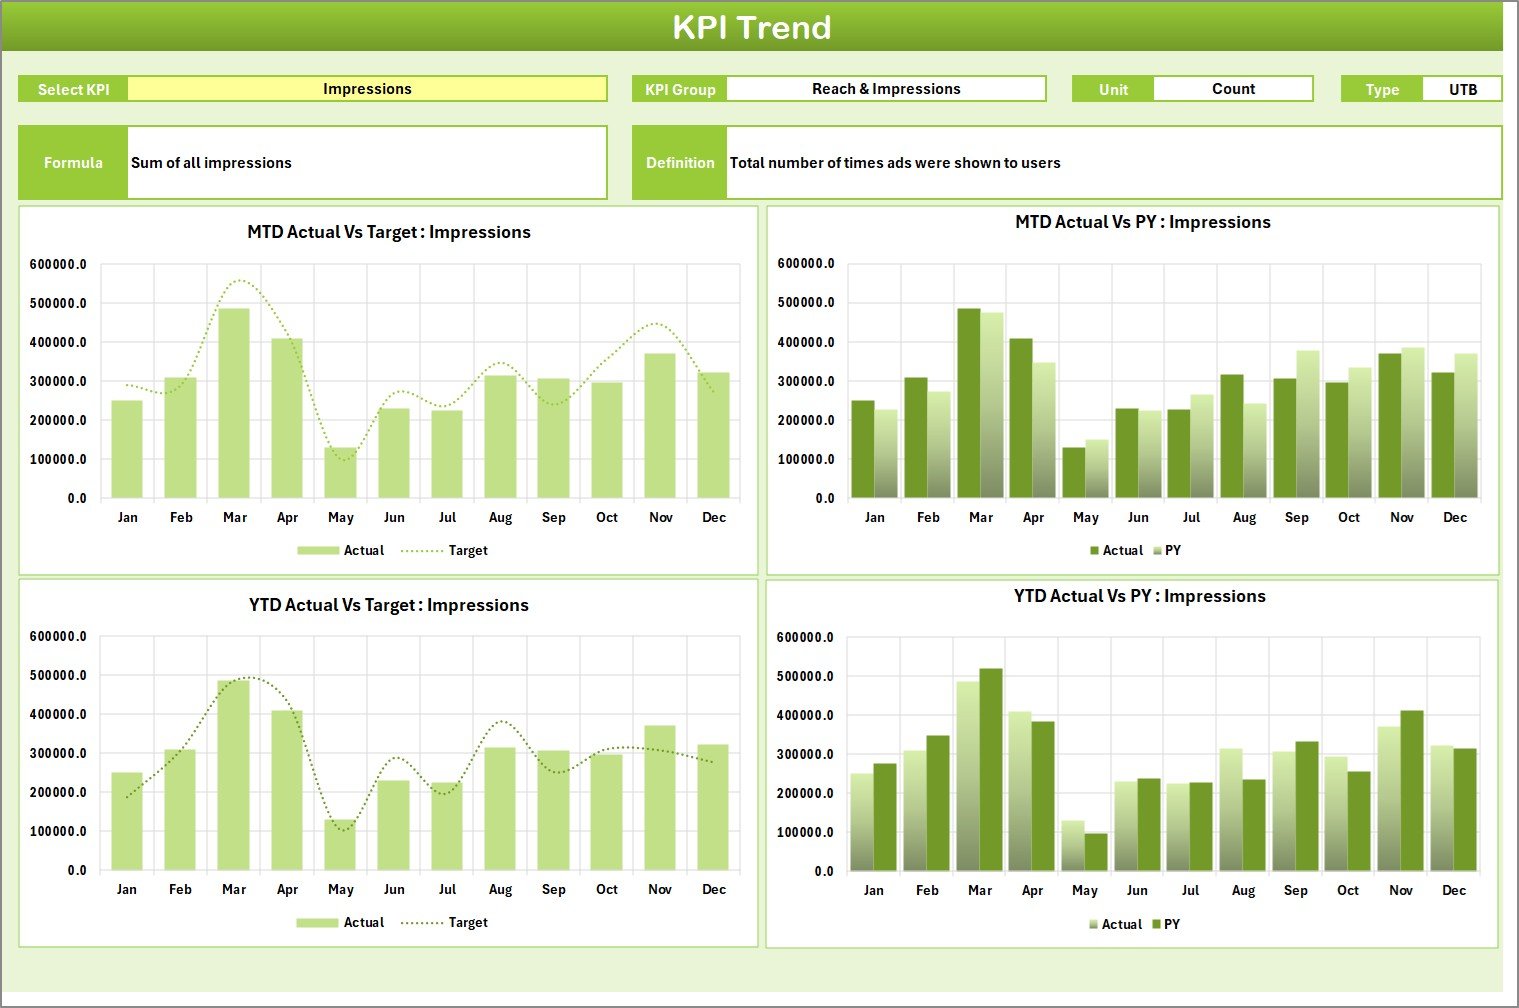
📈 2. KPI Trend Sheet:
Visualize how each KPI performs month-to-month using the built-in trend charts. With the KPI selector in cell C3, choose any metric and view MTD, YTD, and previous year data in one visual snapshot.
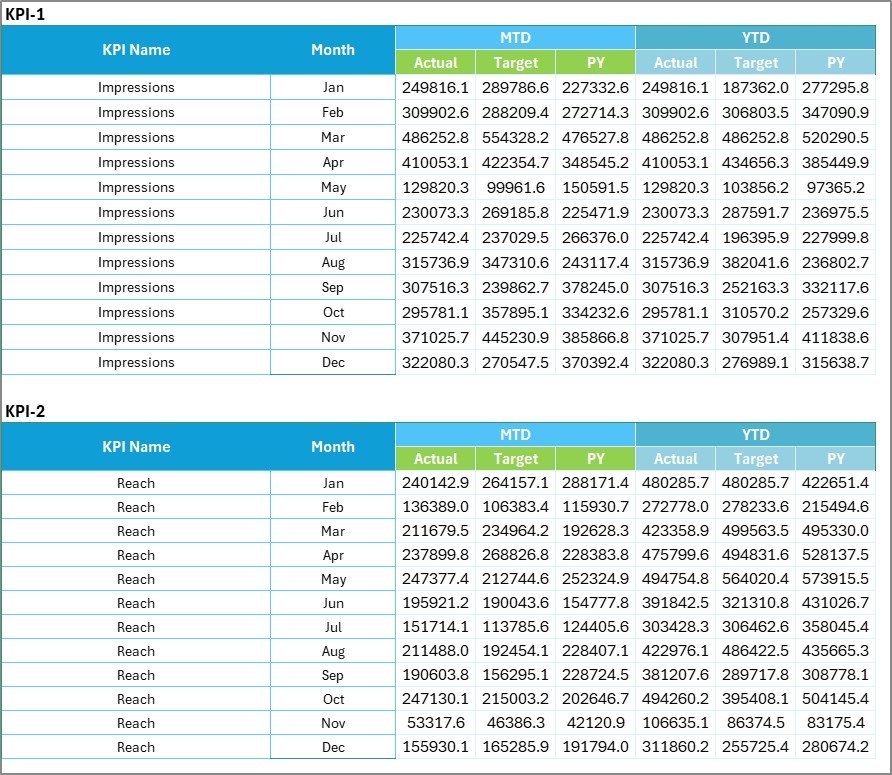
🗂️ 3. Input Data Sheet:
The backbone of the entire scorecard. Enter or paste your campaign data — impressions, clicks, conversions, cost, and targets — and the rest of the sheets update automatically.
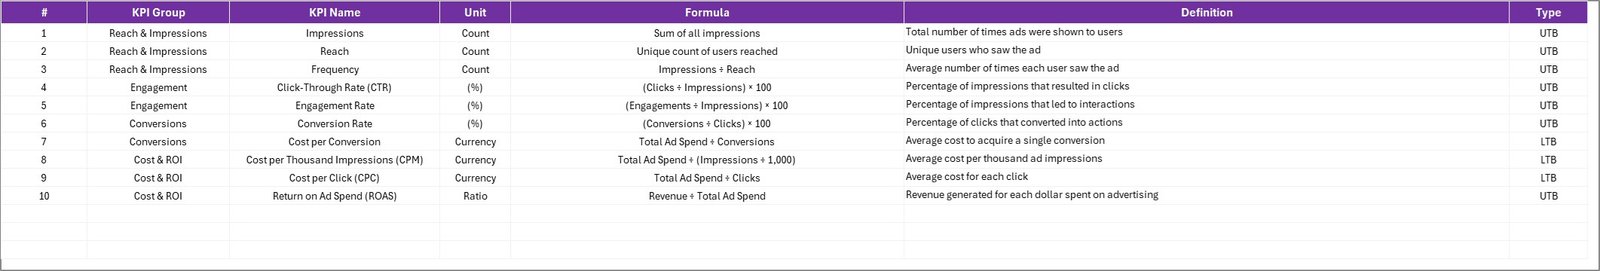
📘 4. KPI Definition Sheet:
Maintain clarity and transparency by defining every KPI’s meaning, unit, type (UTB/LTB), and formula. It ensures consistency and alignment across your marketing team.
Each tab is designed for ease of use and seamless data flow — giving you the precision of an analytics tool with the simplicity of Excel.
🧭 How to Use the Advertising KPI Scorecard in Excel
1️⃣ Set Up KPIs: Start by defining all your metrics in the KPI Definition Sheet.
2️⃣ Enter Data: Fill in actual and target values for each KPI in the Input Data Sheet.
3️⃣ Analyze Performance: Open the Scorecard Sheet to see instant comparisons between Actual, Target, and Previous Year.
4️⃣ Track Trends: Use the KPI Trend Sheet to spot growth patterns or underperformance.
5️⃣ Refine Strategies: Identify which channels or campaigns deliver the best ROI and redirect your ad spend wisely.
It’s as simple as updating your monthly data — and the visuals, summaries, and comparisons update automatically ⚡.
👥 Who Can Benefit from This Advertising KPI Scorecard in Excel
💼 Marketing Agencies: Simplify client reporting with clean visuals and real-time performance updates.
📊 Advertisers & Brand Managers: Stay on top of campaign ROI, CTR, and conversion rates without relying on expensive software.
📈 CMOs & Executives: Get a quick snapshot of overall ad efficiency and ROI through visual summaries.
📣 Freelancers & Consultants: Impress clients with a professional, data-driven reporting tool that requires no coding.
🏢 Small Business Owners: Save money and time by tracking ad spend and results in a single, user-friendly Excel file.
This template bridges the gap between raw data and strategic insights — ensuring every dollar spent on ads delivers measurable impact.


Reviews
There are no reviews yet.