Additive manufacturing moves at incredible speed. One moment you are testing a new material batch, and the next moment you are racing to deliver a critical prototype. However, without proper performance tracking, small inefficiencies quickly turn into expensive problems like failed builds, excessive scrap, missed deadlines, and rising production costs.
That is why we created the Additive Manufacturing KPI Dashboard in Excel — a powerful, ready-to-use performance management solution designed specifically for modern 3D printing operations.
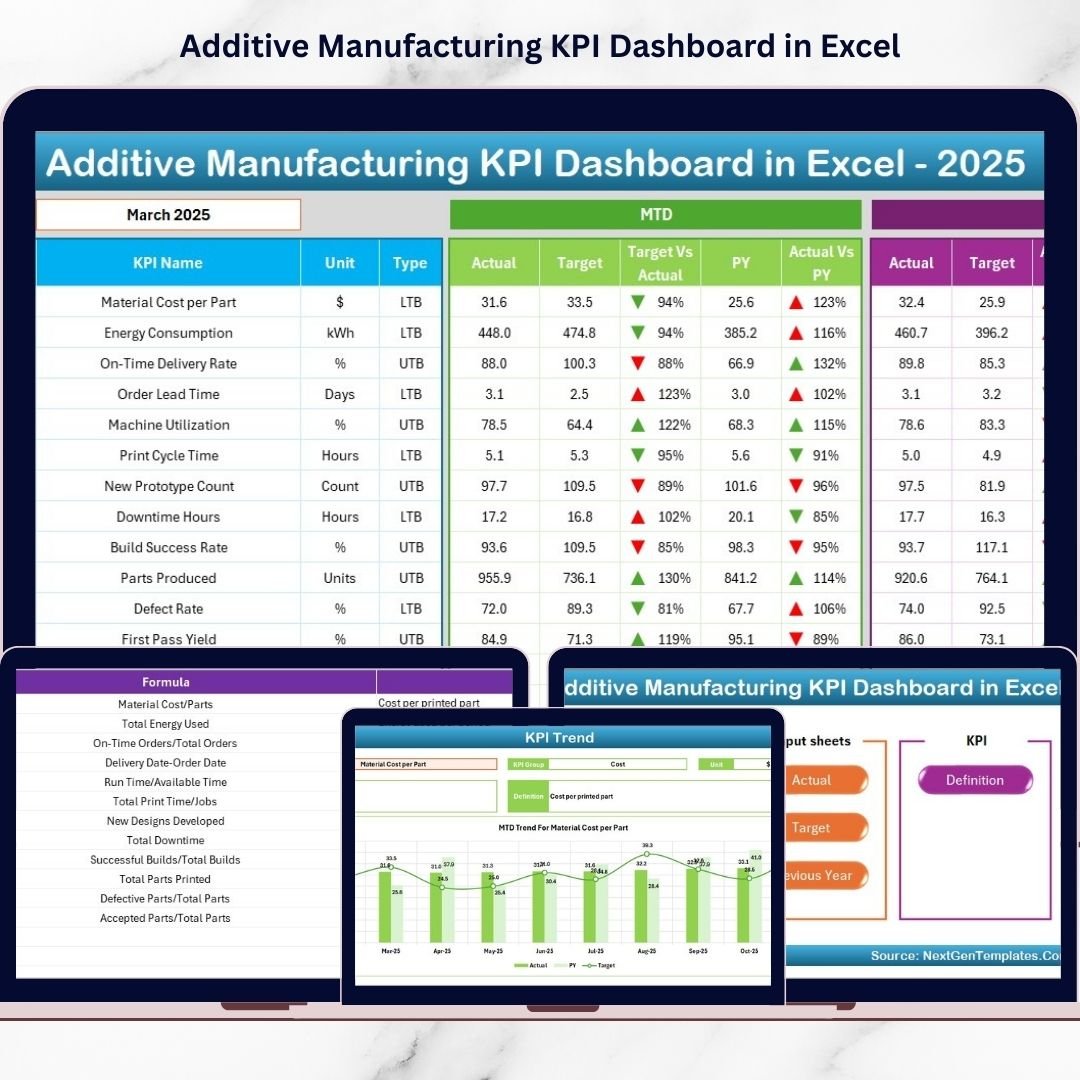
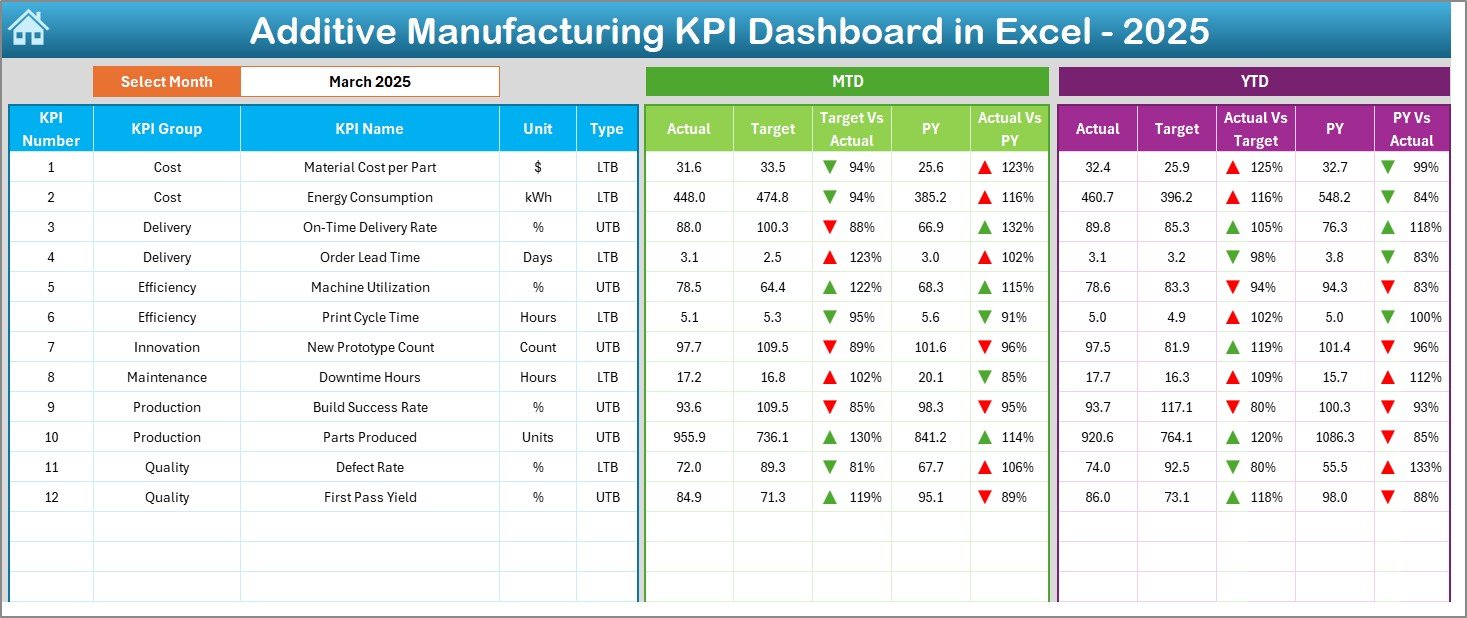
This Excel-based dashboard allows you to monitor all essential additive manufacturing KPIs in one centralized system. Instead of juggling multiple reports from printer software, MES systems, quality logs, and spreadsheets, you gain a single source of truth that helps you track performance clearly and confidently.
With automated comparisons such as Actual vs Target, Month-to-Date (MTD), Year-to-Date (YTD), and Previous Year (PY) analysis, the dashboard instantly highlights whether your operations are improving or falling behind. Visual indicators and trend tracking make decision-making faster and more accurate.
Whether you manage metal AM, polymer printing, prototyping labs, or production-scale additive manufacturing, this dashboard helps you control quality, cost, utilization, and delivery performance — all inside Excel.
🚀 Key Feature of Additive Manufacturing KPI Dashboard in Excel
✅ Interactive KPI dashboard with month selection dropdown
✅ Automatic MTD, YTD, and Previous Year comparisons
✅ Up/Down performance indicators for instant insights
✅ KPI trend analysis with dynamic charts
✅ Centralized tracking of production, quality, machine, and cost KPIs
✅ Fully editable KPI definitions and formulas
✅ No coding or advanced software required — works directly in Excel
✅ Clean navigation using a Home/Index page with quick buttons
This structure allows managers to identify performance gaps immediately and take corrective action without delays.
📦 What’s Inside the Additive Manufacturing KPI Dashboard in Excel
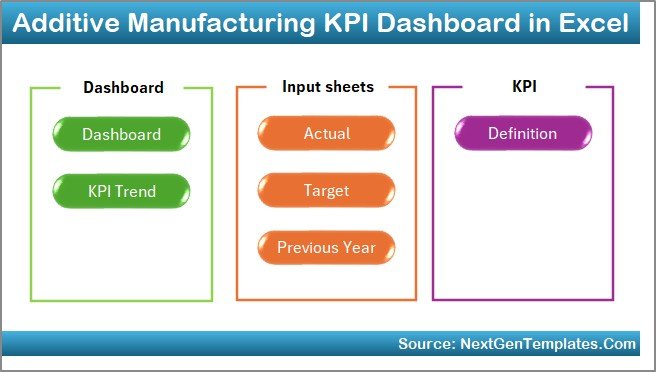
The template includes 7 professionally designed worksheets, each serving a specific purpose:
📊 Home Sheet – Navigation hub with quick-access buttons for faster workflow.
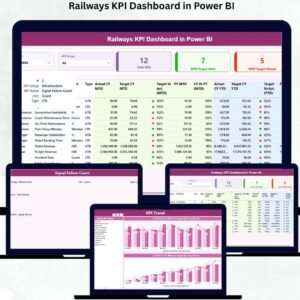
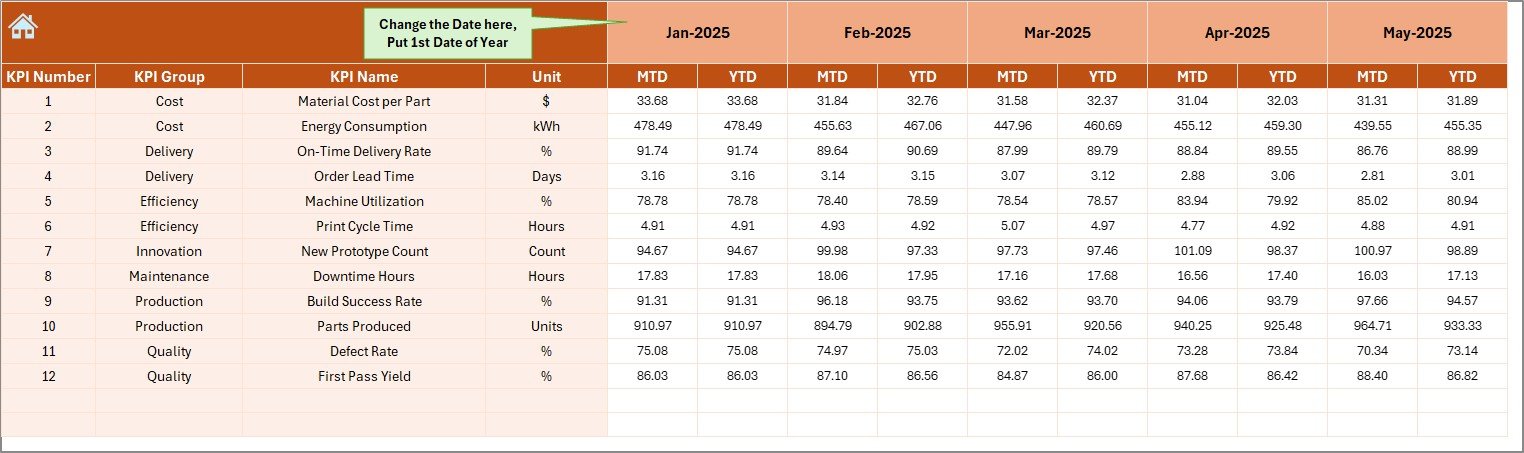
📈 Dashboard Sheet – Main KPI performance view showing MTD and YTD comparisons with visual indicators.
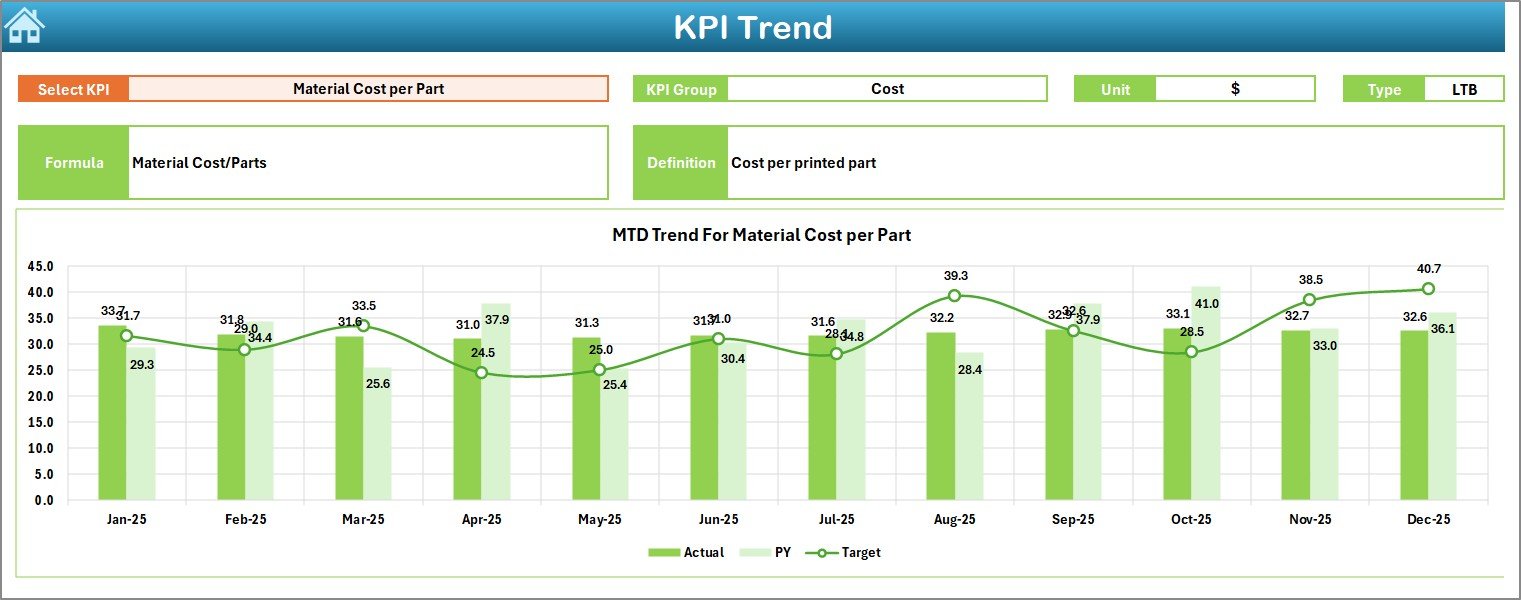
📉 KPI Trend Sheet – Detailed KPI analysis with trend charts and KPI definitions.
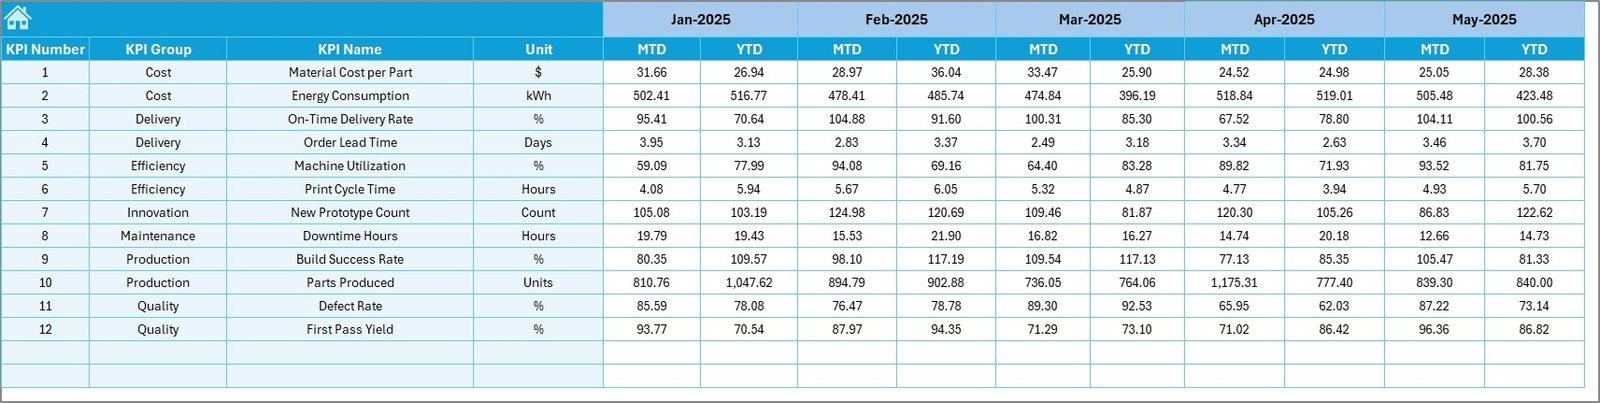
🧾 Actual Numbers Input Sheet – Simple data entry structure for monthly performance updates.
🎯 Target Sheet – Store and manage KPI targets for accurate comparisons.
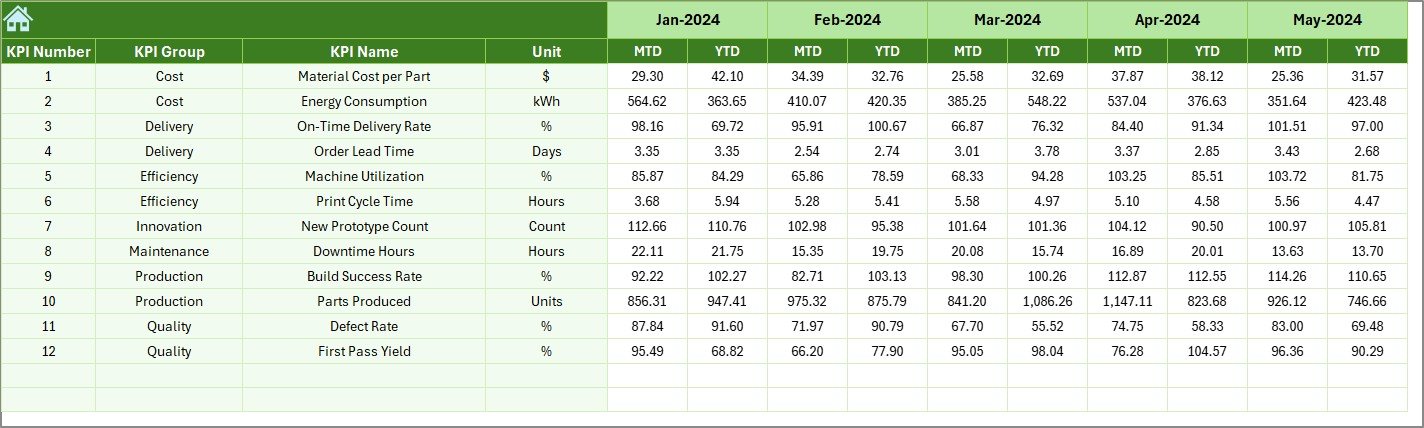
📅 Previous Year Sheet – Benchmark current performance against historical data.
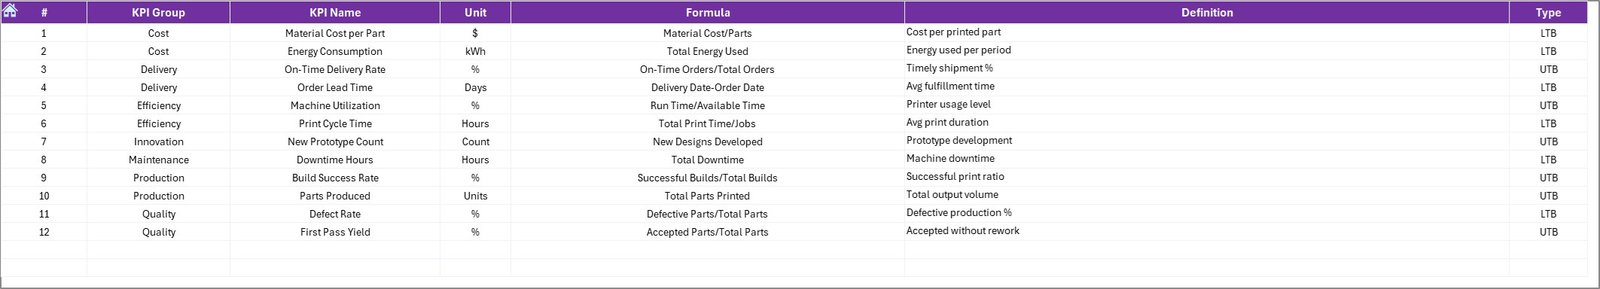
📘 KPI Definition Sheet – Central location for KPI names, formulas, units, and descriptions.
Together, these sheets create a complete KPI tracking ecosystem for additive manufacturing operations.
⚙️ How to Use the Additive Manufacturing KPI Dashboard in Excel
Using this dashboard is simple and requires no technical expertise:
1️⃣ Define your KPIs in the KPI Definition sheet.
2️⃣ Enter monthly targets in the Target sheet.
3️⃣ Input actual performance values each month.
4️⃣ Add previous year data for benchmarking.
5️⃣ Select the month from the dashboard dropdown.
6️⃣ Review performance indicators and analyze trends instantly.
Within minutes, you transform raw production data into meaningful operational insights.
👨🏭 Who Can Benefit from This Additive Manufacturing KPI Dashboard in Excel
This dashboard is ideal for:
✅ Additive manufacturing service bureaus
✅ 3D printing production teams
✅ Manufacturing managers and plant heads
✅ Quality assurance and inspection teams
✅ Process and continuous improvement engineers
✅ Operations and supply chain planners
✅ R&D and prototyping teams
Because it runs in Excel, organizations can implement it immediately without investing in expensive software systems.
By using this dashboard consistently, you gain better visibility into machine utilization, defect trends, delivery performance, and production efficiency. Over time, this leads to reduced waste, improved quality, and smarter operational decisions.
Click here to read the Detailed blog post
Watch the step-by-step video tutorial: