

Additive Manufacturing Dashboard are evolving rapidly, and Additive Manufacturing (3D Printing) has become one of the most transformative technologies in modern production. Companies now manufacture complex parts faster, reduce material waste, and create highly customized products with improved efficiency.
However, managing additive manufacturing operations requires continuous monitoring of production efficiency, machine performance, maintenance expenses, and product quality. Without a structured reporting system, managers often struggle to track operational performance and identify improvement opportunities.
This is where the Additive Manufacturing Dashboard in Excel becomes extremely valuable.
This ready-to-use Excel dashboard helps manufacturing teams monitor production metrics, analyze costs, track machine performance, and evaluate product quality in one centralized platform. Instead of reviewing scattered reports, managers can analyze manufacturing data through interactive charts, KPI indicators, and dynamic filters.
Because Excel provides powerful pivot tables, charts, and data analysis capabilities, organizations can easily convert complex production data into clear visual insights.
If your manufacturing facility wants to improve operational visibility, optimize costs, and enhance production efficiency, this dashboard provides an effective solution.
⚙️ Key Feature of Additive Manufacturing Dashboard in Excel
This Excel dashboard includes powerful features designed to analyze manufacturing operations from multiple perspectives.
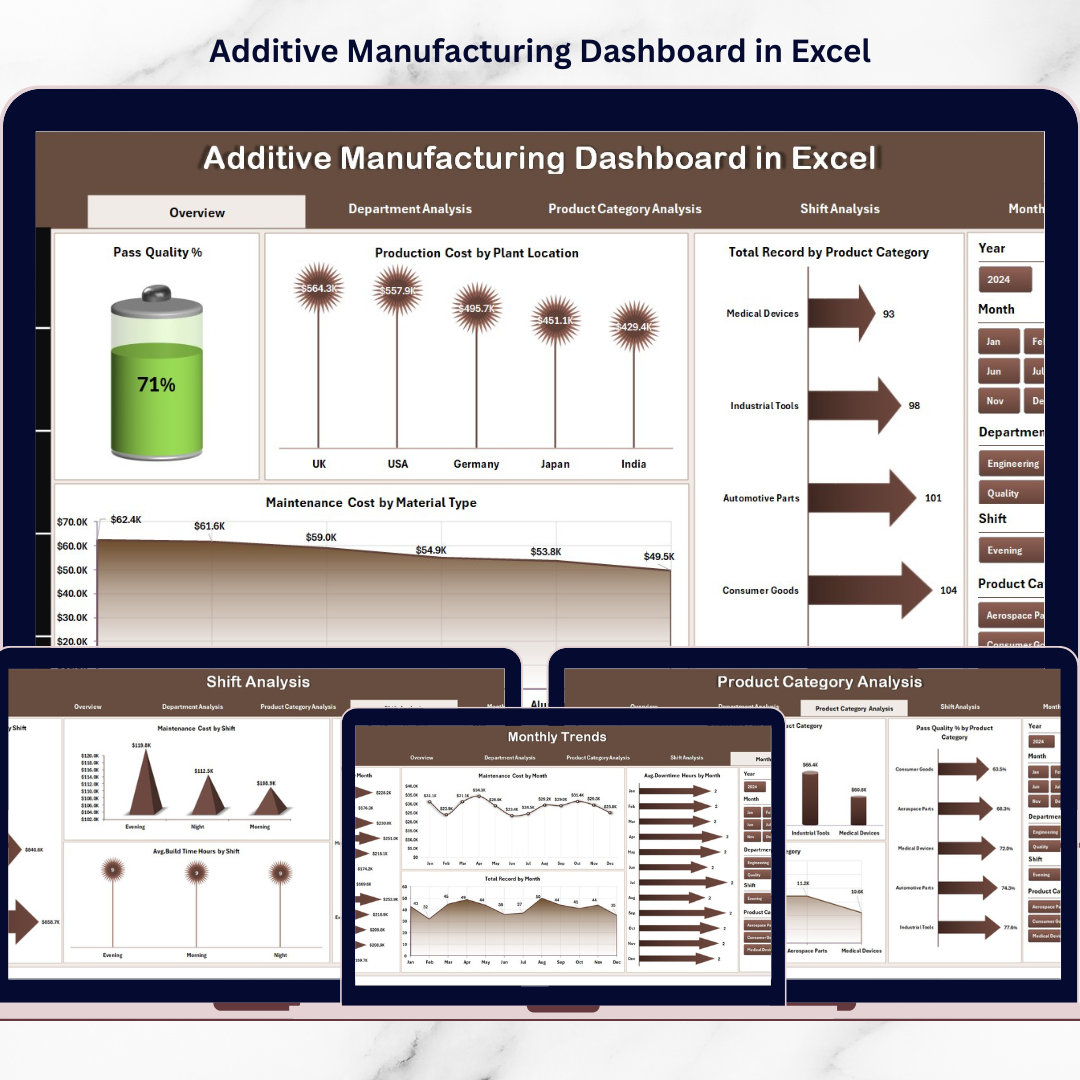
📊 Centralized Manufacturing Dashboard – Monitor key production metrics in one interactive view.
📈 Production Quality Monitoring – Track Pass Quality % to evaluate product quality levels.
🏭 Production Cost Analysis by Plant – Identify plant locations with higher manufacturing costs.
📦 Product Category Performance Analysis – Evaluate production efficiency across product categories.
⚙️ Maintenance Cost Monitoring – Track maintenance expenses based on material type.
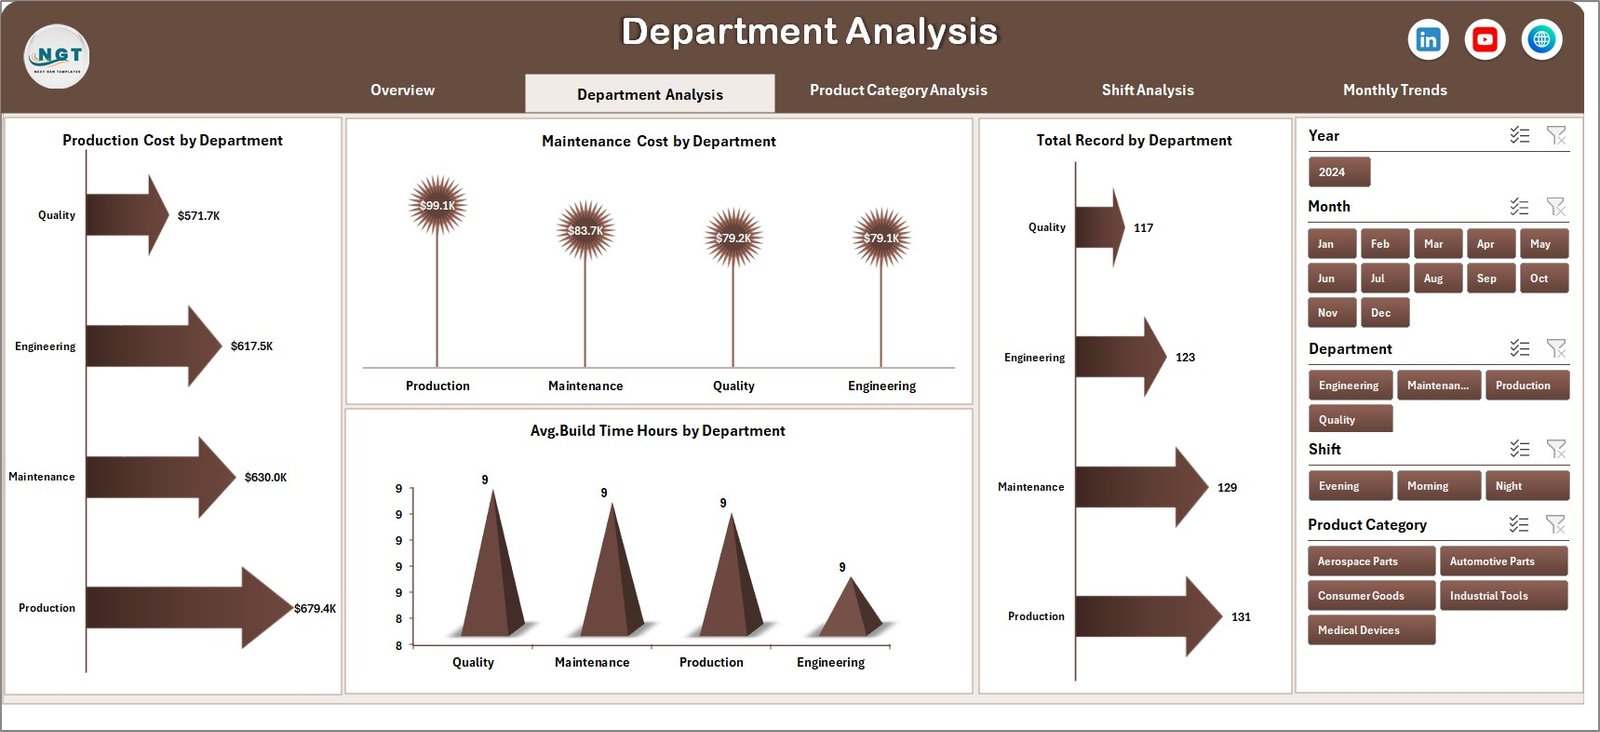
🏢 Department-Level Performance Analysis – Compare production efficiency across departments.
⏱ Build Time Performance Tracking – Monitor average build time across departments and shifts.
📅 Shift-Based Production Analysis – Compare productivity across different manufacturing shifts.
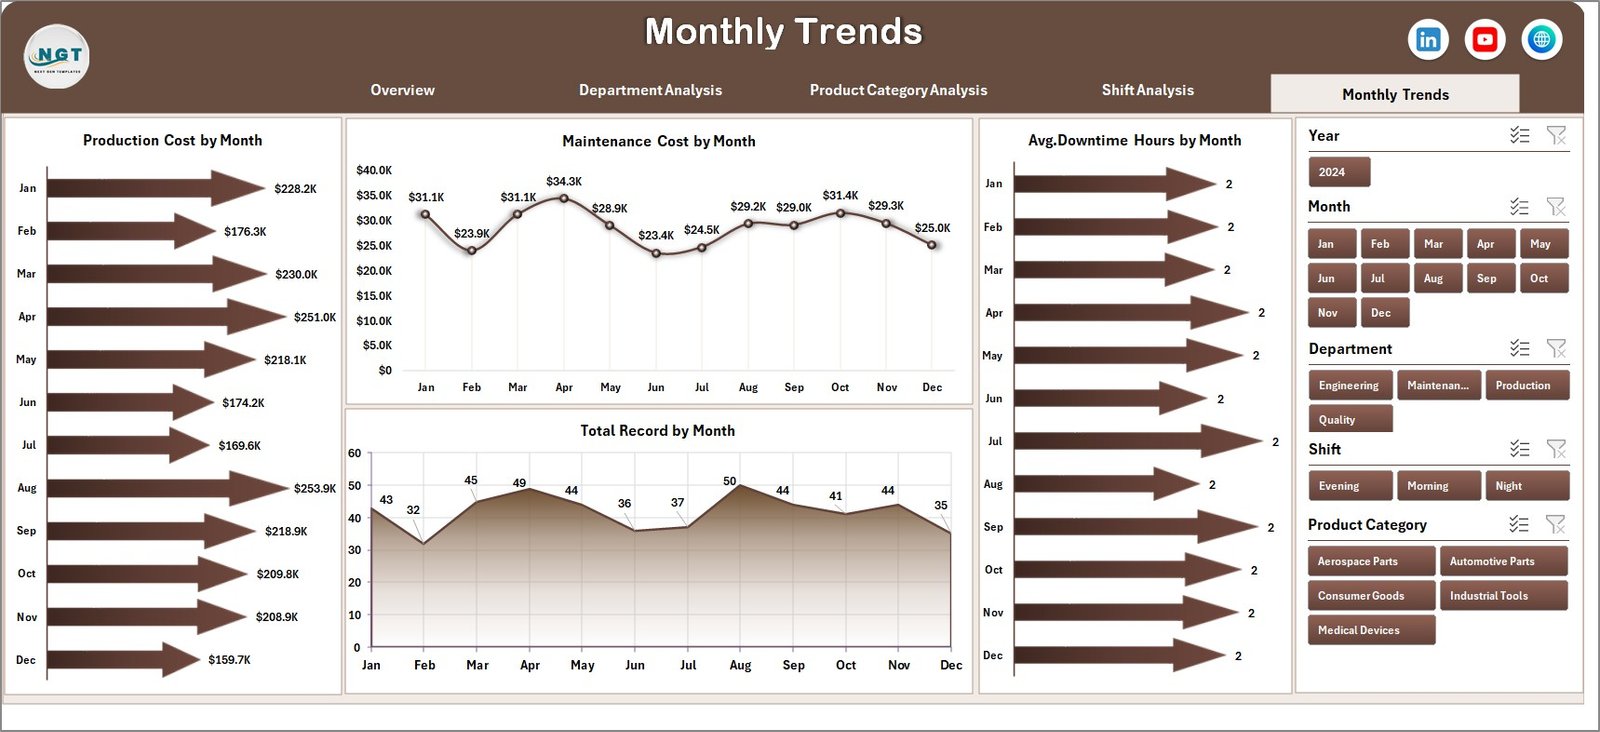
📊 Monthly Trend Analysis – Analyze production cost, maintenance cost, and output trends over time.
🔎 Interactive Filters & Slicers – Easily filter dashboard insights by department, product category, shift, or month.
Because of these features, manufacturing managers gain complete visibility into production performance.
📦 What’s Inside the Additive Manufacturing Dashboard in Excel
This ready-to-use Excel template includes five analytical dashboard pages along with supporting worksheets.
Inside the dashboard you will find:
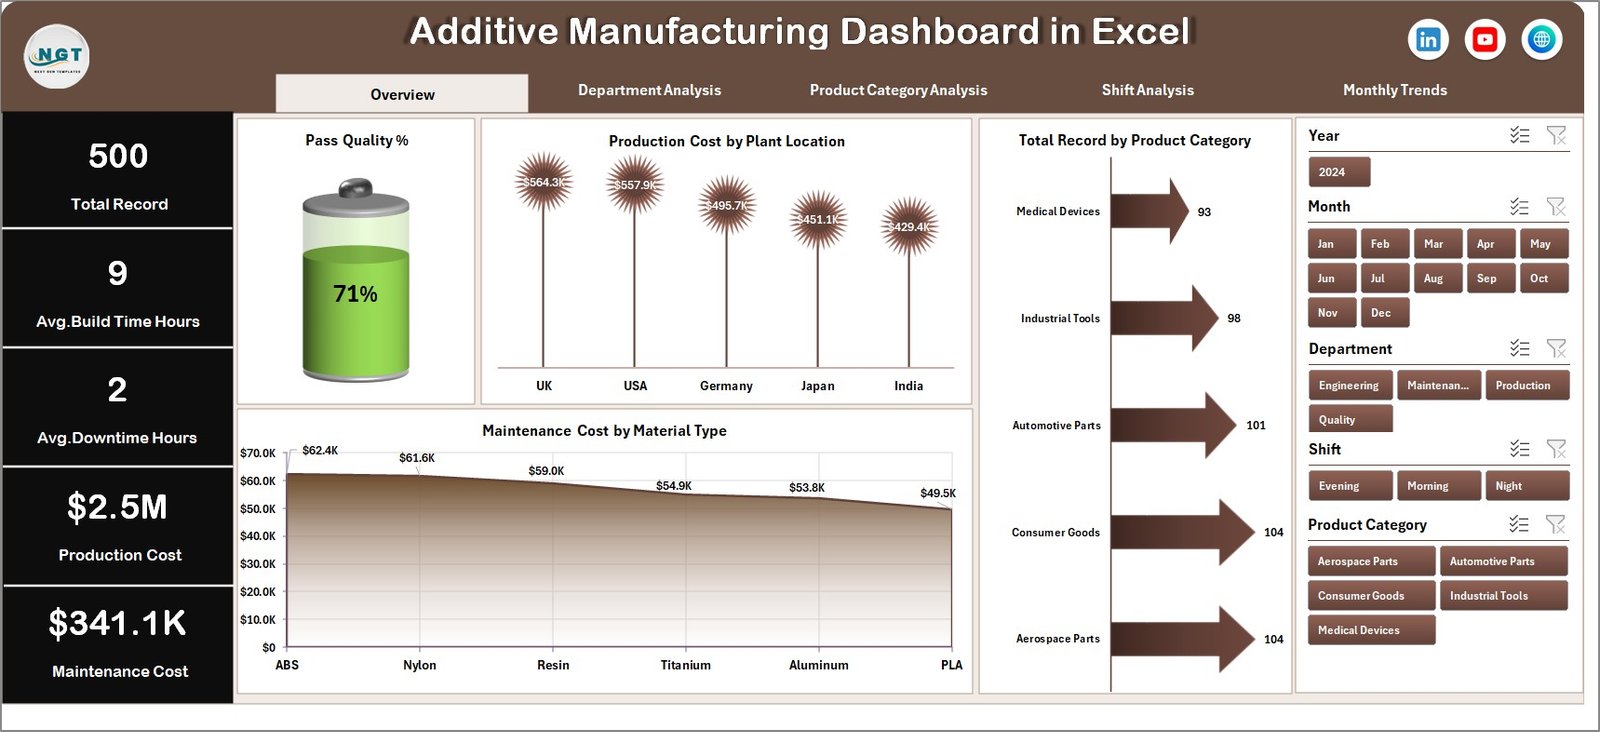
✅ Overview Page – Central monitoring panel for manufacturing operations
✅ Department Analysis Page – Department-level performance insights
✅ Product Category Analysis Page – Product-level production analysis
✅ Shift Analysis Page – Shift productivity comparison
✅ Month Analysis Page – Time-based production performance trends
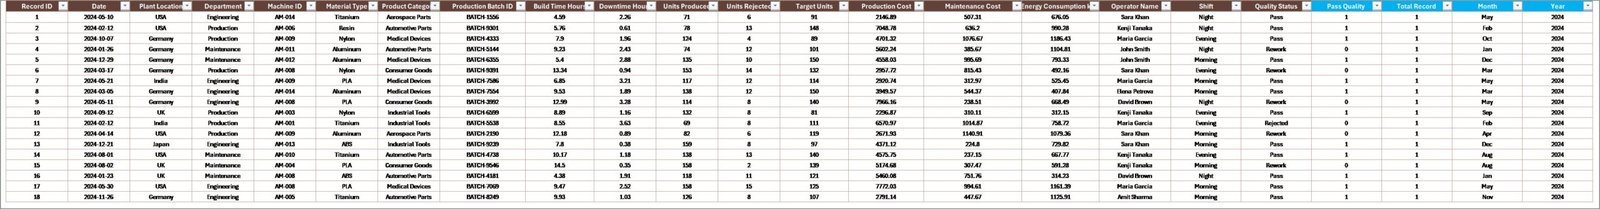
✅ Data Sheet – Structured production dataset
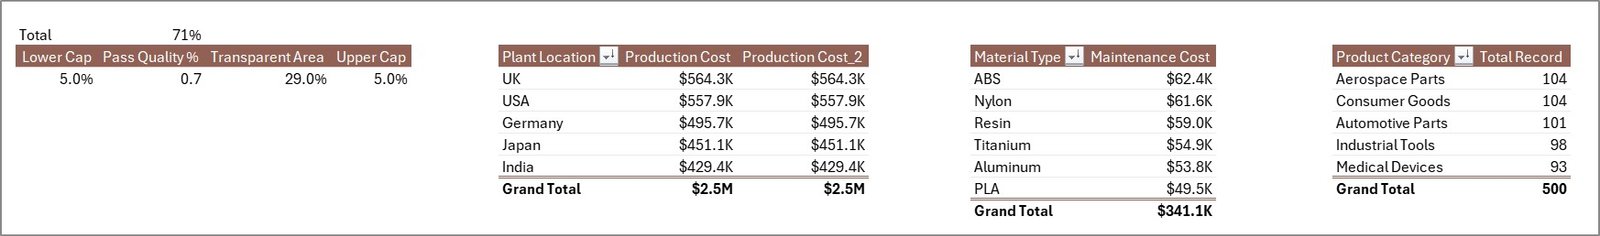
✅ Support Sheet – Backend calculations and pivot tables
The dashboard analyzes several important manufacturing metrics such as:
Production Cost
Maintenance Cost
Pass Quality Percentage
Build Time (Hours)
Department Productivity
Shift Performance
Plant Location Performance
Product Category Output
Because the dashboard organizes these metrics visually, managers can quickly evaluate manufacturing performance and identify operational bottlenecks.
⚙️ How to Use the Additive Manufacturing Dashboard in Excel
Using this dashboard is simple and user-friendly.
1️⃣ Enter manufacturing data into the Data Sheet.
2️⃣ Ensure the dataset includes production cost, maintenance cost, department, shift, and product category data.
3️⃣ Refresh pivot tables to update the dashboard.
4️⃣ Use slicers to filter insights by department, product category, shift, or month.
5️⃣ Analyze charts and KPI indicators to evaluate production performance.
Within seconds, managers can identify operational inefficiencies and improve production strategies.
Because Excel automatically updates pivot charts, the dashboard refreshes instantly when new data is added.
👥 Who Can Benefit from This Additive Manufacturing Dashboard
This dashboard is ideal for professionals responsible for managing manufacturing operations and production analytics.
It is particularly useful for:
🏭 Manufacturing Managers
⚙️ Production Engineers
📊 Manufacturing Analysts
🛠 Maintenance Teams
📈 Operations Managers
🏢 Plant Supervisors
Because the dashboard combines operational and financial performance metrics, multiple teams can use it simultaneously.
💡 Why Manufacturers Use Additive Manufacturing Dashboards
✔ Centralized monitoring of manufacturing performance
✔ Faster identification of operational bottlenecks
✔ Improved machine maintenance tracking
✔ Better cost management across plants and departments
✔ Data-driven production planning
✔ Clear performance comparison across departments and shifts
✔ Improved product quality monitoring
✔ Enhanced decision-making using visual insights
Instead of relying on manual reports, manufacturing teams can analyze operations using structured visual analytics.
This dashboard transforms manufacturing data into actionable insights that help organizations improve production efficiency and reduce operational costs.
### Click here to read the Detailed blog post
Visit our YouTube channel to learn step-by-step video tutorials
Youtube.com/@PKAnExcelExpert