Modern manufacturing is evolving rapidly, and 3D printing (additive manufacturing) is leading this transformation. Companies can now produce complex parts faster, reduce material waste, and customize products with unmatched precision. However, despite these advantages, many manufacturers struggle to measure operational performance effectively.
Without structured monitoring, production inefficiencies remain hidden, machine utilization declines, and operational costs increase. This is where the 3D Printing Manufacturing KPI Dashboard in Excel becomes an essential business solution.
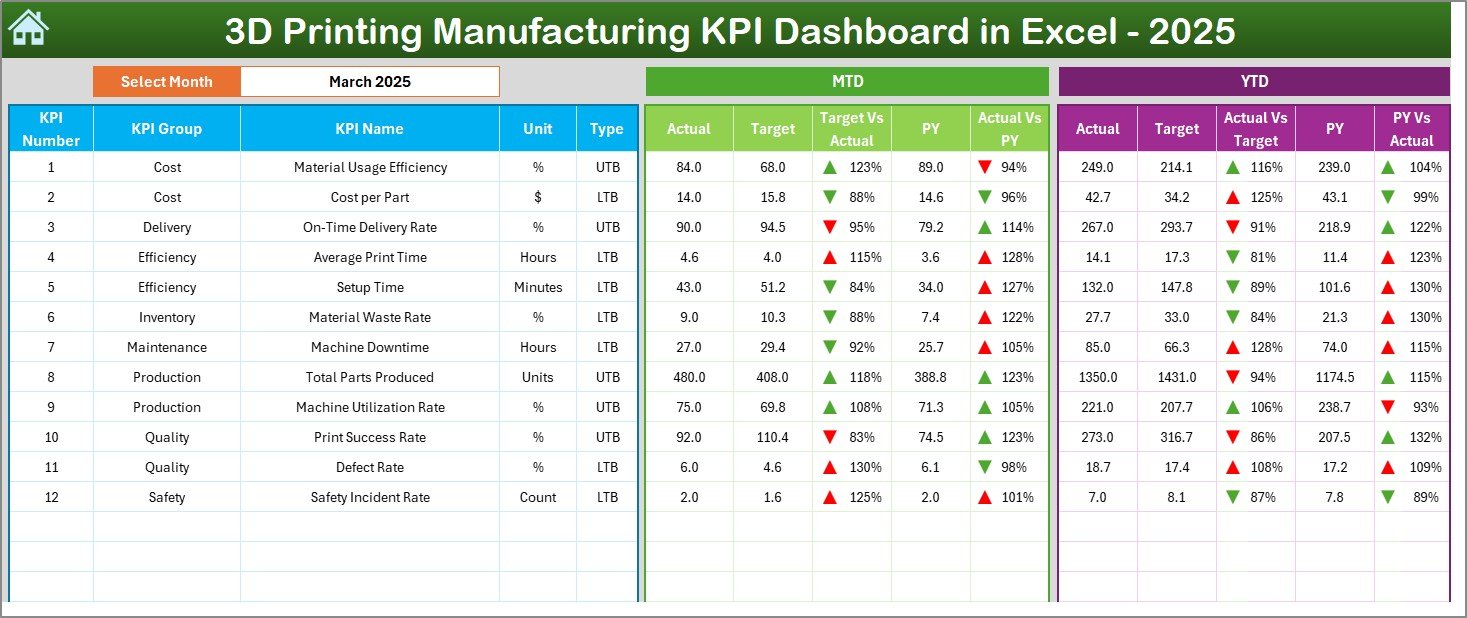
The 3D Printing Manufacturing KPI Dashboard in Excel is a ready-to-use performance monitoring system designed to help manufacturers track production efficiency, machine performance, material usage, quality metrics, and operational outcomes using structured Key Performance Indicators (KPIs).
Instead of managing scattered spreadsheets and manual calculations, this dashboard consolidates all performance metrics into one interactive Excel environment. As a result, managers gain instant visibility into operations and can make faster, data-driven decisions.
Built entirely in Excel, the dashboard combines automation, visualization, and flexibility — making advanced manufacturing analytics accessible to organizations of all sizes without investing in expensive software.
🚀 Key Feature of 3D Printing Manufacturing KPI Dashboard in Excel
📊 Interactive Manufacturing Dashboard – Monitor all production KPIs in one centralized view.
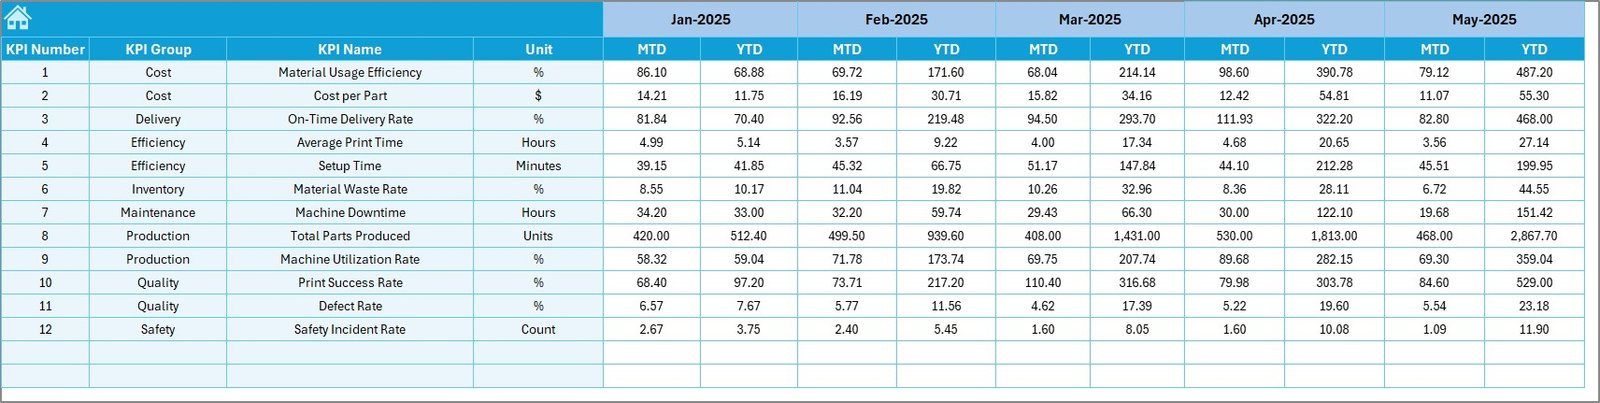
🎯 MTD & YTD Performance Tracking – Analyze Month-to-Date and Year-to-Date results instantly.
📈 Actual vs Target Comparison – Identify operational gaps quickly using automated calculations.
🔺 Visual Trend Indicators – Up and down arrows highlight performance improvements or declines.
🏭 Machine & Production Monitoring – Track utilization, success rates, and production efficiency.
🔄 Automatic Dashboard Updates – Input data once and the entire dashboard refreshes instantly.
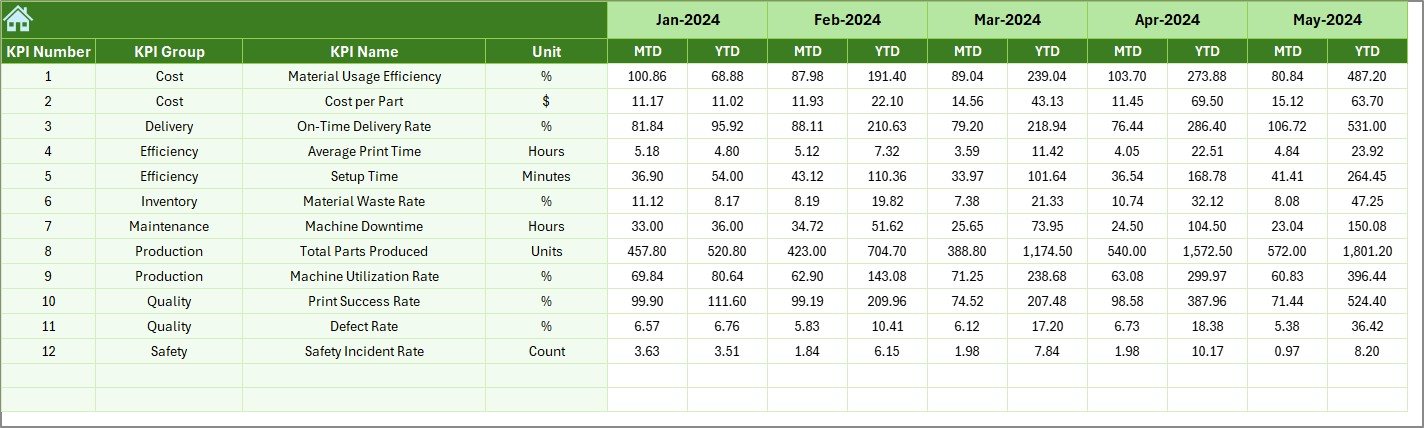
📉 Historical Performance Comparison – Compare current results with previous-year performance.
⚙️ Fully Customizable KPIs – Add or modify KPIs based on manufacturing needs.
📦 What’s Inside the 3D Printing Manufacturing KPI Dashboard in Excel
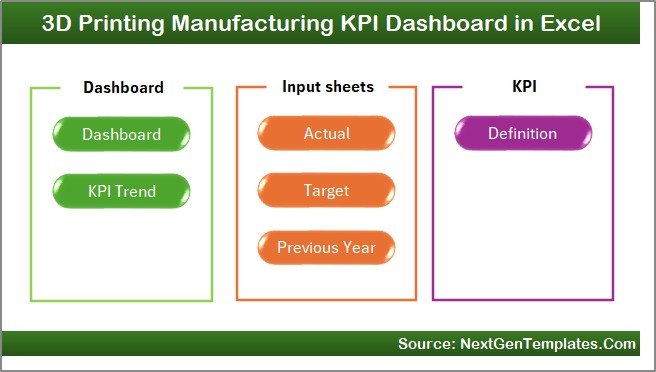
This professional Excel solution includes 7 structured worksheets designed to create a complete performance management system:
🏠 Home Sheet
A smart navigation hub with buttons allowing quick movement between dashboard sections.
📊 Dashboard Sheet
The main performance view displaying MTD, YTD, Target vs Actual, and Previous Year comparisons with visual indicators.
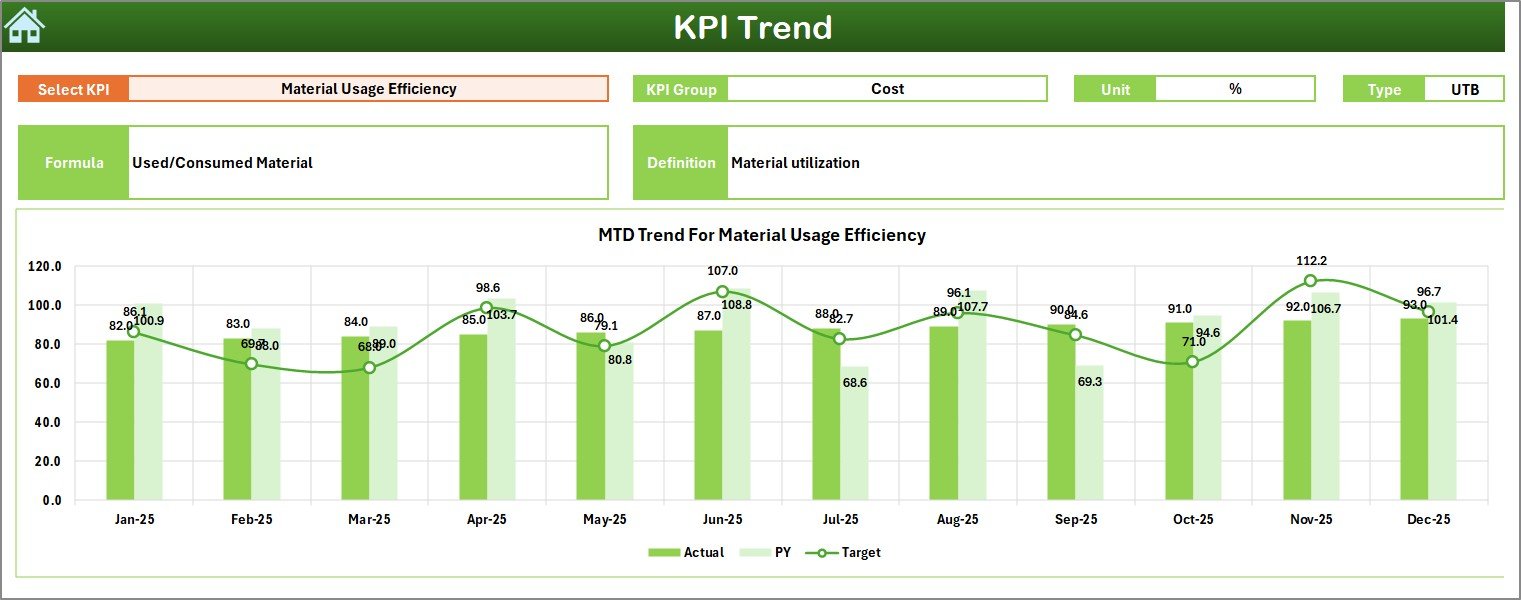
📈 KPI Trend Sheet
Analyze individual KPI performance over time with dynamic trend charts and KPI details.
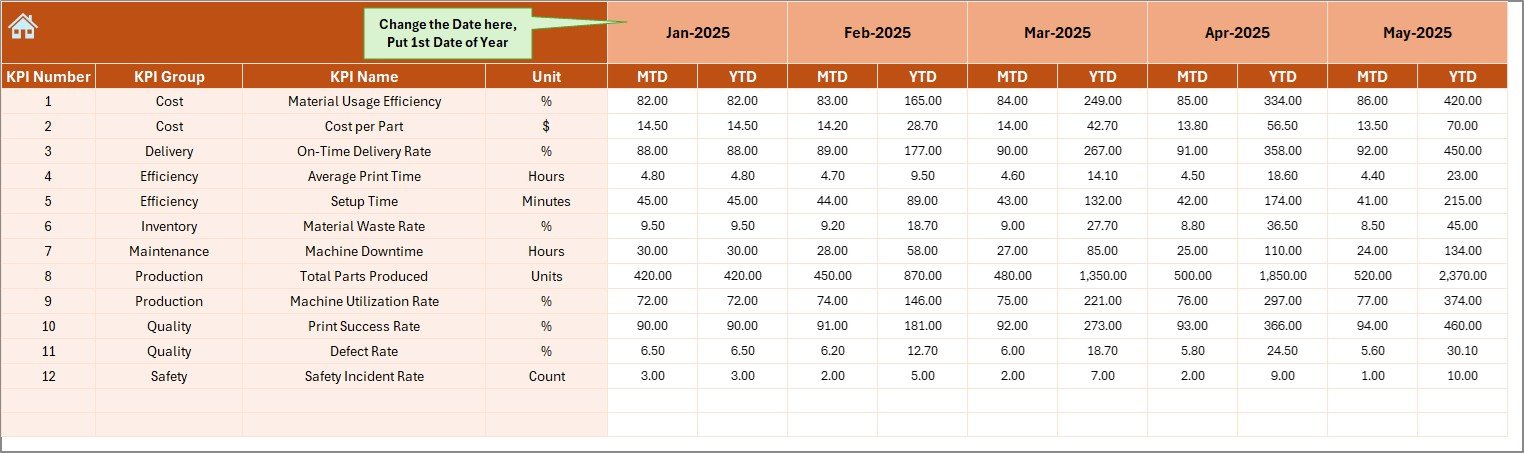
📝 Actual Numbers Input Sheet
Enter monthly production data, and all calculations update automatically.
🎯 Target Sheet
Define operational goals and measure performance against targets.
📅 Previous Year Numbers Sheet
Store historical data to enable year-over-year benchmarking.
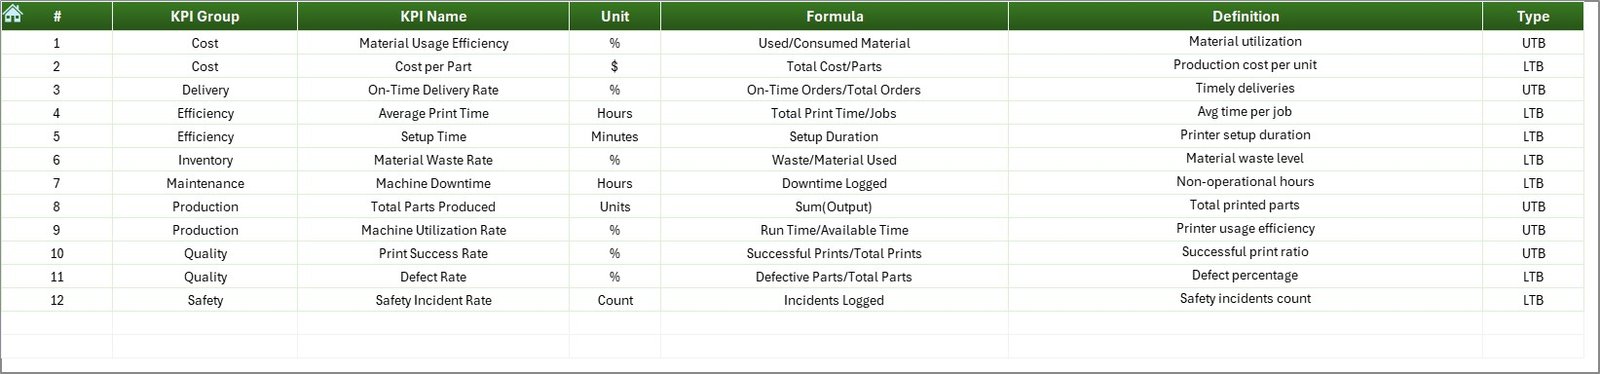
📘 KPI Definition Sheet
Standardize KPI formulas, units, and definitions to ensure clarity across teams.
Together, these sheets provide a complete manufacturing analytics framework.
⚙️ How to Use the 3D Printing Manufacturing KPI Dashboard in Excel
Using the dashboard is simple and beginner-friendly:
1️⃣ Define manufacturing KPIs aligned with operational goals.
2️⃣ Enter KPI definitions in the KPI Definition sheet.
3️⃣ Set monthly and yearly targets.
4️⃣ Input actual production data regularly.
5️⃣ Select reporting month from dropdown filters.
6️⃣ Analyze performance using dashboard visuals and trend charts.
Within minutes, managers receive actionable insights into production performance.
👥 Who Can Benefit from This 3D Printing Manufacturing KPI Dashboard in Excel
This dashboard is ideal for professionals involved in additive manufacturing operations:
🏭 Production Managers
⚙️ Plant Supervisors
📊 Manufacturing Analysts
✅ Quality Control Managers
📈 Operations Heads
💼 Manufacturing Business Owners
🚀 3D Printing Startups
Any organization seeking structured performance monitoring and operational improvement can benefit from this ready-to-use solution.
The dashboard improves visibility, reduces reporting effort, identifies bottlenecks early, and supports continuous improvement initiatives. Because it runs entirely in Excel, implementation is fast, affordable, and highly flexible.
By transforming raw manufacturing data into visual insights, the 3D Printing Manufacturing KPI Dashboard in Excel empowers teams to optimize production, reduce waste, and achieve sustainable operational growth.
### Click here to read the Detailed blog post
Visit our YouTube channel to learn step-by-step video tutorials:
👉 https://youtube.com/@PKAnExcelExpert