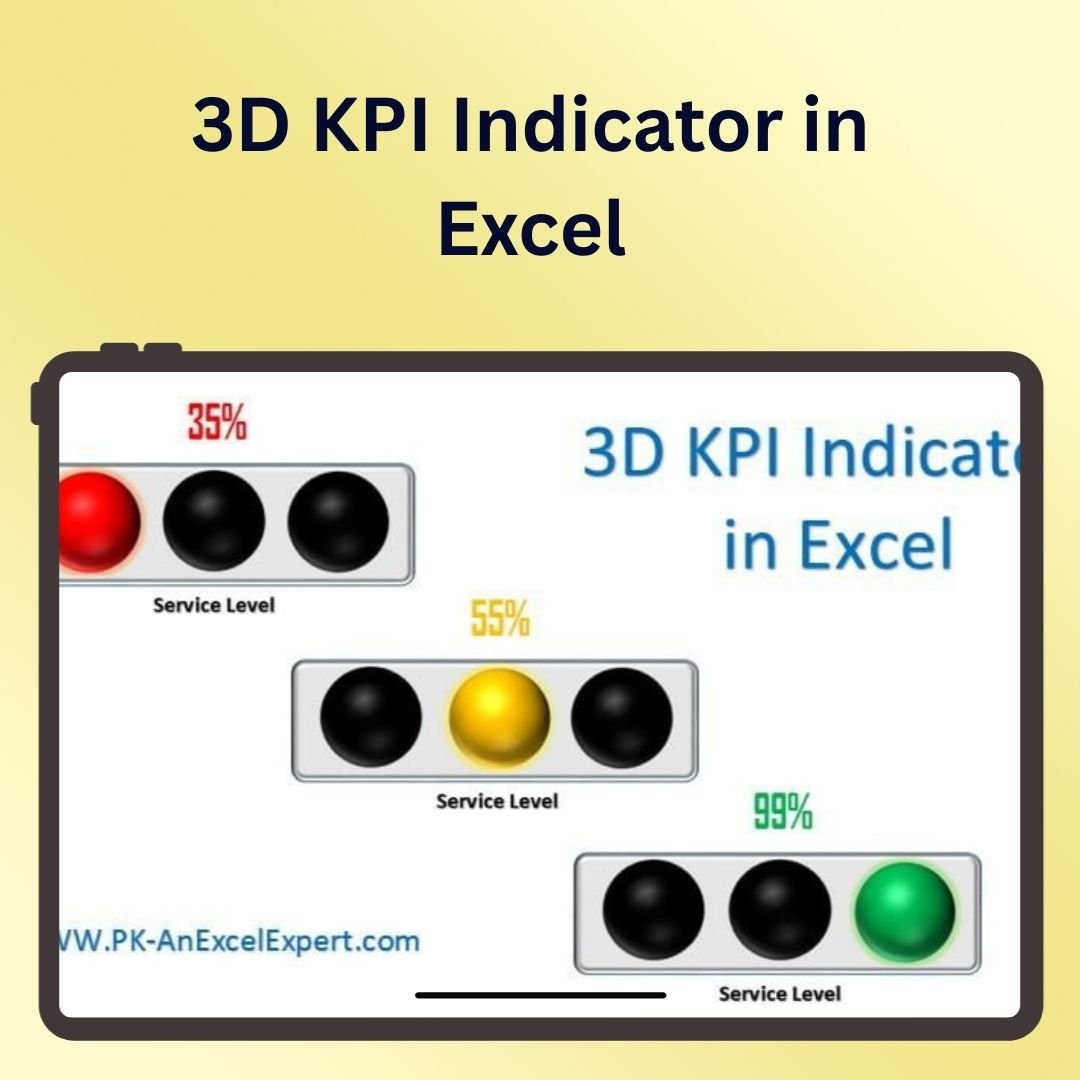
The 3D KPI Indicator in Excel is a visually stunning and dynamic tool designed to help businesses track and display key performance indicators (KPIs) in a unique 3D format. This template enables you to monitor multiple KPIs across various categories such as sales, operations, customer service, and finance, using engaging 3D visuals that make complex data easier to understand.
Whether you’re managing business performance or reporting to stakeholders, the 3D KPI Indicator in Excel makes data presentation more effective and visually appealing. The template integrates seamlessly with your existing data, providing real-time updates and insights into your KPIs with interactive 3D charts.
With this tool, you can track your organization’s progress towards set targets, identify trends, and make data-driven decisions that help improve overall performance. Fully customizable, this Excel template allows you to tailor the 3D indicators to reflect the KPIs that matter most to your business.

Key Features of the 3D KPI Indicator in Excel
📊 3D Visualization of Key Metrics
Transform your standard KPI reports into dynamic, visually engaging 3D charts. Display multiple KPIs with clear indicators and dynamic graphs for easy comparison and decision-making.
💡 Real-Time Data Updates
The 3D KPI indicator automatically updates as you input new data, ensuring your reports are always current and reflective of real-time performance.
📈 Customizable Indicator Setup
Tailor the 3D KPI indicators to fit your specific business goals. Choose the KPIs that align with your objectives, whether they’re sales, customer satisfaction, operational efficiency, or other important metrics.
🖥️ Interactive Dashboards
The template includes interactive elements such as slicers and filters, allowing you to drill down into specific data points or periods for a more detailed analysis.
🔄 Track Multiple KPIs in One View
Monitor and compare various KPIs in a single view. The 3D indicators display the performance of multiple metrics simultaneously, helping you assess progress at a glance.
Why You’ll Love the 3D KPI Indicator in Excel
✅ Enhance Data Presentation
The 3D format offers a more engaging and visually impactful way to present your KPIs. Make your reports stand out and capture your audience’s attention with dynamic, interactive visuals.
✅ Monitor Multiple KPIs Simultaneously
Track various performance indicators in one dashboard. Whether you need to monitor sales, operations, or customer satisfaction, this template allows you to compare multiple metrics in real-time.
✅ Improve Data Understanding & Decision Making
The 3D visual format makes it easier to interpret complex data. Quickly assess the performance of your business and make more informed decisions based on clear, actionable insights.
✅ Customizable & Easy to Use
Tailor the 3D KPI indicators to your specific needs. Modify the template to include the KPIs that matter most to your business and easily adjust the design to match your company’s branding or preferences.
✅ Save Time with Automated Updates
The 3D KPI indicators update automatically as you input new data, reducing the need for manual adjustments and allowing you to focus on analyzing the information.
What’s Inside the 3D KPI Indicator in Excel Template?
- 3D KPI Indicators: Visualize multiple KPIs in a dynamic 3D format for better engagement and understanding.
- Customizable Dashboard: Choose the KPIs you want to track and adjust the design to meet your business’s needs.
- Real-Time Data Updates: Automatically updates your dashboard as you input new data, ensuring real-time tracking.
- Interactive Features: Use slicers, filters, and dropdowns to drill down into specific data points and time periods.
- Multiple KPI Tracking: Monitor various KPIs simultaneously in one view for a holistic view of performance.
How to Use the 3D KPI Indicator in Excel
1️⃣ Download the Template: Get instant access to your 3D KPI Indicator in Excel.
2️⃣ Input Your Data: Enter your business data for the KPIs you wish to track.
3️⃣ Customize the Dashboard: Tailor the 3D indicators to reflect the most relevant KPIs for your business.
4️⃣ Track & Analyze: Use the real-time updates and interactive features to track and analyze your business performance.
Who Can Benefit from the 3D KPI Indicator in Excel?
🔹 Business Owners & Entrepreneurs
🔹 Sales & Marketing Teams
🔹 Operations & Project Managers
🔹 Financial Analysts & Performance Trackers
🔹 Anyone Needing to Track & Report KPIs
🔹 Data Analysts Looking for Interactive Dashboards
Enhance the way you track and present KPIs with the 3D KPI Indicator in Excel. Monitor multiple metrics, gain valuable insights, and make informed decisions that drive your business forward.
Click here to read the Detailed blog post
Visit our YouTube channel to learn step-by-step video tutorials
Youtube.com/@PKAnExcelExpert


Reviews
There are no reviews yet.