
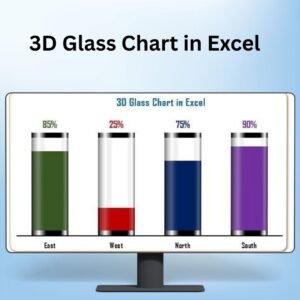
The 3D Glass Chart in Excel is a visually stunning and dynamic data visualization tool that brings a modern touch to your Excel presentations. This unique chart allows you to present your data in a three-dimensional glass-style format, making it ideal for showcasing complex data in a visually appealing and easy-to-understand way. Whether you’re displaying sales data, market trends, or financial metrics, the 3D Glass Chart adds a sleek, professional look to your reports and presentations.
Unlike traditional charts, the 3D Glass Chart uses a glass effect with depth and transparency, giving your data a more sophisticated and stylish appearance. This chart is fully customizable, allowing you to adjust colors, transparency, and other design elements to suit your needs. Whether you’re preparing a business report, client presentation, or internal dashboard, this chart will ensure your data stands out.

Key Features of the 3D Glass Chart in Excel
📌 Three-Dimensional Design
The 3D Glass Chart provides a depth effect that makes your data look more interactive and visually engaging. It offers a fresh take on traditional bar charts and pie charts by adding a glass-like transparency effect, making the chart stand out while maintaining a professional look.
🛠 Fully Customizable Appearance
You can adjust the transparency, colors, and shadows of the glass chart to make it fit your branding or presentation style. The customizable features ensure that your chart can be tailored to your unique needs.
💡 Elegant and Professional Look
The sleek, glassy design of the chart adds sophistication to your data presentation. It’s perfect for presenting key metrics, comparisons, or data trends in a more visually engaging way.
🔢 Clear and Engaging Data Representation
The 3D Glass Chart allows you to represent complex data in a way that’s easy to understand. Whether you’re showing comparisons, trends, or financial performance, the chart’s unique design makes it easier for your audience to quickly grasp insights.
🚀 Dynamic Updates
As you update the data in Excel, the 3D Glass Chart automatically adjusts to reflect the changes in real time. This ensures that your presentations are always up to date, without the need for manual adjustments.
📊 Ideal for Business Presentations
The 3D Glass Chart is perfect for corporate presentations, client reports, and internal dashboards. Its modern and polished design ensures that your data is not only accurate but also visually appealing.
⚙ Simple Setup and Customization
Creating the 3D Glass Chart in Excel is straightforward. With easy-to-follow instructions, you can quickly set up the chart and customize it to suit your needs, whether you’re a beginner or an advanced user.
🚀 Why You’ll Love the 3D Glass Chart in Excel
✅ Three-Dimensional Effect – Make your data visually appealing with depth and transparency. ✅ Customizable Design – Adjust colors, transparency, and more to suit your needs. ✅ Elegant and Professional Look – Add a sophisticated touch to your data presentations. ✅ Dynamic Updates – Automatically update your chart as data changes. ✅ Ideal for Business Presentations – Perfect for corporate reports, client presentations, and dashboards.
📂 What’s Inside the 3D Glass Chart in Excel?
- 3D Glass Effect: A stylish three-dimensional chart with a glass-like appearance.
- Customizable Design Elements: Adjust colors, transparency, and shadows to match your style.
- Dynamic Data Updates: The chart automatically adjusts to changes in data.
- Clear Setup Instructions: Step-by-step guide to create and customize the chart.
🔍 How to Use the 3D Glass Chart in Excel
1️⃣ Download the Template – Instant access to the Excel file upon purchase. 2️⃣ Input Your Data – Enter your data into the Excel sheet for chart visualization. 3️⃣ Customize the Design – Adjust transparency, colors, and other design features. 4️⃣ Track and Present – Use the chart to track key metrics and present data clearly. 5️⃣ Share and Collaborate – Present the chart in reports or share it in meetings for impactful data discussions.
🎯 Who Can Benefit from the 3D Glass Chart in Excel? 🔹 Business Analysts
🔹 Sales and Marketing Teams
🔹 Data Scientists
🔹 Financial Analysts
🔹 Project Managers
🔹 Anyone presenting data visually in business or corporate settings
Enhance your data presentations with the 3D Glass Chart in Excel. This tool provides a sleek, modern way to visualize data, making it not only easy to understand but also visually appealing.
Click here to read the Detailed blog post
https://www.pk-anexcelexpert.com/3d-glass-chart-in-excel/


Reviews
There are no reviews yet.