PK

7 Powerful Reasons This Excel Tool Will Transform Your Ayurveda Clinic Forever

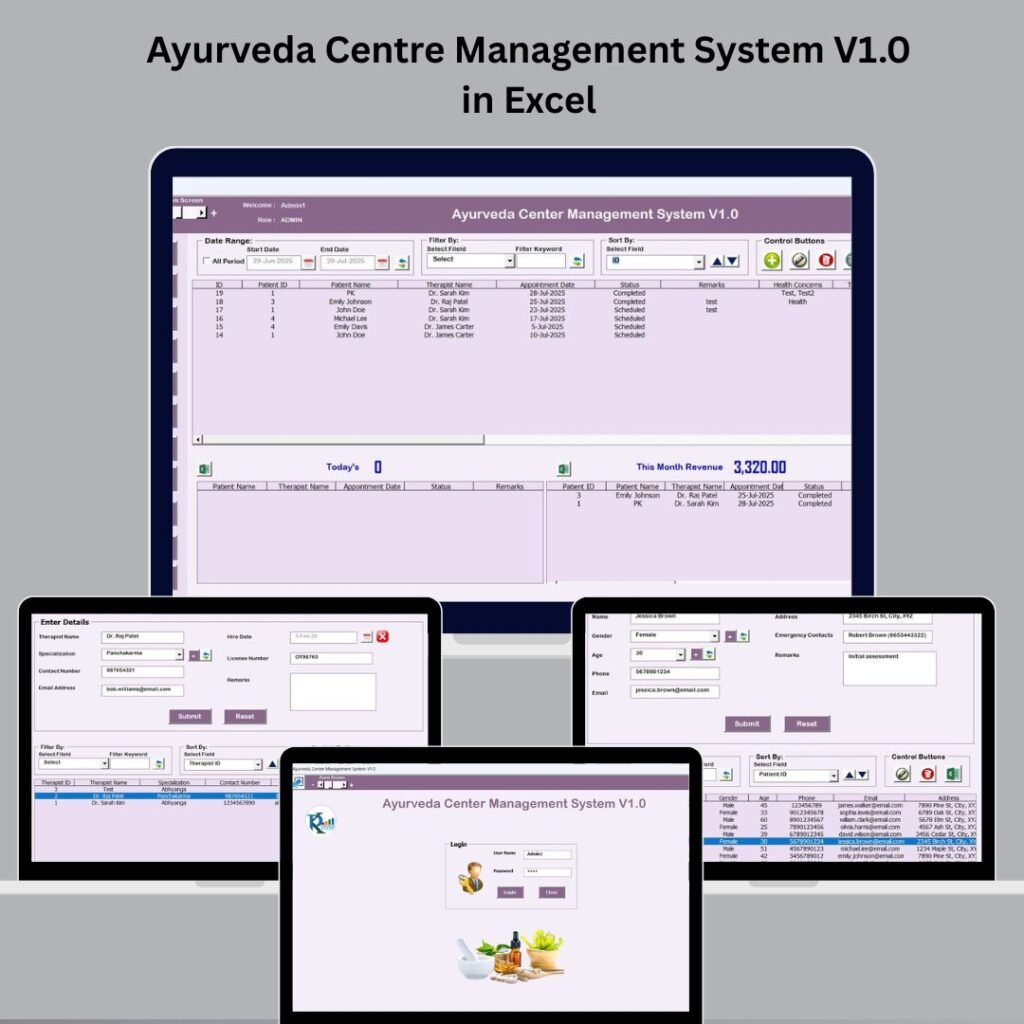
Running an Ayurveda clinic is deeply rewarding — but managing the day-to-day operations? That part can get overwhelming fast. Between juggling patient records, scheduling appointments, tracking expenses, and coordinating therapists, even the most passionate practitioners struggle to stay organized.Ayurveda Clinic What if one simple Excel file could handle all of that — without any expensive

7 Powerful Reasons This Excel Tool Will Transform Your Ayurveda Clinic Forever Read More »

3 Powerful IT Asset Management Dashboards That Will Transform Your Operations

Every growing organization faces the same challenge — keeping track of hundreds (or thousands) of IT assets scattered across departments, locations, and vendors. Laptops, servers, software licenses, networking equipment… the list keeps growing, and so does the chaos. What if you could monitor every single asset, its cost, warranty status, depreciation, and utilization from one

3 Powerful IT Asset Management Dashboards That Will Transform Your Operations Read More »

3 Best Team Performance Dashboards That Will Instantly Supercharge Your Team’s Productivity

Managing a team without real data is like flying blind. You assign tasks, set deadlines, and hope for the best — but without clear visibility into who’s doing what, how long it’s taking, and where bottlenecks are forming, productivity silently erodes. That’s exactly why we built the Team Performance Dashboard series — a powerful trio

3 Best Team Performance Dashboards That Will Instantly Supercharge Your Team’s Productivity Read More »

5 Powerful Reasons This Production Planning Dashboard in Power BI Will Transform Your Manufacturing Operations

Stop guessing. Start knowing. One dashboard. Five analytical views. Real-time clarity on every order, every plant, every planner. 👉 Get the Dashboard — Only $17.99   Is Your Production Team Flying Blind? Not Anymore. Managing a manufacturing operation without clear data visibility is like trying to drive in the dark — dangerous, slow, and costly.

5 Powerful Reasons This Production Planning Dashboard in Power BI Will Transform Your Manufacturing Operations Read More »

7 Powerful Reasons to Use a Revenue Analysis Dashboard in Power BI & Google Sheets

Imagine logging in every morning and instantly knowing exactly where your revenue stands, which products are hitting targets, which regions are underperforming, and where profit is leaking — all without opening a single spreadsheet tab or running one manual formula. That level of clarity is no longer a luxury reserved for enterprises with dedicated data

7 Powerful Reasons to Use a Revenue Analysis Dashboard in Power BI & Google Sheets Read More »

7 Powerful Reasons This Procurement Cost Analysis Dashboard Will Transform Your Buying Strategy

Introducing the Procurement Cost Analysis Dashboard in Excel — a ready-to-use, interactive solution built specifically for procurement professionals who want real-time visibility into costs, vendor performance, and departmental spending. And right now, it’s available for just $14.99 (originally $28.99).procurement cost analysis dashboard Procurement Cost Analysis Dashboard in Excel — Overview Sheet 1. 📊 Get a

7 Powerful Reasons This Procurement Cost Analysis Dashboard Will Transform Your Buying Strategy Read More »

3 Powerful Training Budget Dashboards That Will Transform How You Track L&D Spending

Stop guessing where your training dollars go. Get real-time visibility with ready-to-use dashboards built for Excel, Power BI & Google Sheets.training budget dashboard 📊 Excel Dashboard âš¡ Power BI Dashboard 🟢 Google Sheets Dashboard Is your organization investing thousands in employee training — but struggling to track where every dollar goes? You’re not alone. Most

3 Powerful Training Budget Dashboards That Will Transform How You Track L&D Spending Read More »

7 Powerful Reasons You Need a Pharmaceutical Dashboard Right Now (Power BI & Google Sheets)

Why Pharmaceutical Businesses Struggle Without the Right Data Tools Running a pharmaceutical business without clear, real-time data visibility is like driving at night without headlights. You’re moving fast—but you can’t see what’s ahead. Sales reps missing targets, inventory expiring on shelves, profit margins shrinking across channels, and regional performance gaps going unnoticed—these are daily pain

7 Powerful Reasons You Need a Pharmaceutical Dashboard Right Now (Power BI & Google Sheets) Read More »

Quality KPI Dashboard in Excel, Power BI and Google Sheets

7 Powerful Reasons to Use a Quality KPI Dashboard in Excel, Power BI & Google Sheets

Quality control is no longer just a checkbox — it’s a competitive advantage. Businesses that actively monitor their quality metrics consistently outperform those that rely on guesswork. But tracking quality performance manually using spreadsheets or paper-based systems? That’s a recipe for errors, delays, and missed opportunities. That’s where a dedicated Quality KPI Dashboard changes everything.

7 Powerful Reasons to Use a Quality KPI Dashboard in Excel, Power BI & Google Sheets Read More »

5 Powerful Reasons These Sales BI Dashboards Will Transform How You Track Revenue

Whether you prefer the robust power of Power BI or the simplicity of Google Sheets, NextGenTemplates has you covered with two ready-to-use, professionally designed solutions.Powerful Reasons These Sales BI Dashboards Introducing the Sales Business Intelligence Dashboard in Power BI and the Sales Business Intelligence Dashboard in Google Sheets — two dynamic, plug-and-play dashboards built to give you complete visibility

5 Powerful Reasons These Sales BI Dashboards Will Transform How You Track Revenue Read More »

Shopping Cart
Scroll to Top