Tracking and managing key performance indicators is essential for organizations that rely on knowledge management, research teams, learning departments, and outsourced accounting operations. Knowledge Hubs KPI Dashboard in Excel However, many organizations still struggle with scattered spreadsheets, inconsistent reporting formats, and time-consuming manual analysis. As a result, decision-makers often lack a clear view of performance trends, making it difficult to measure progress and improve operational efficiency.
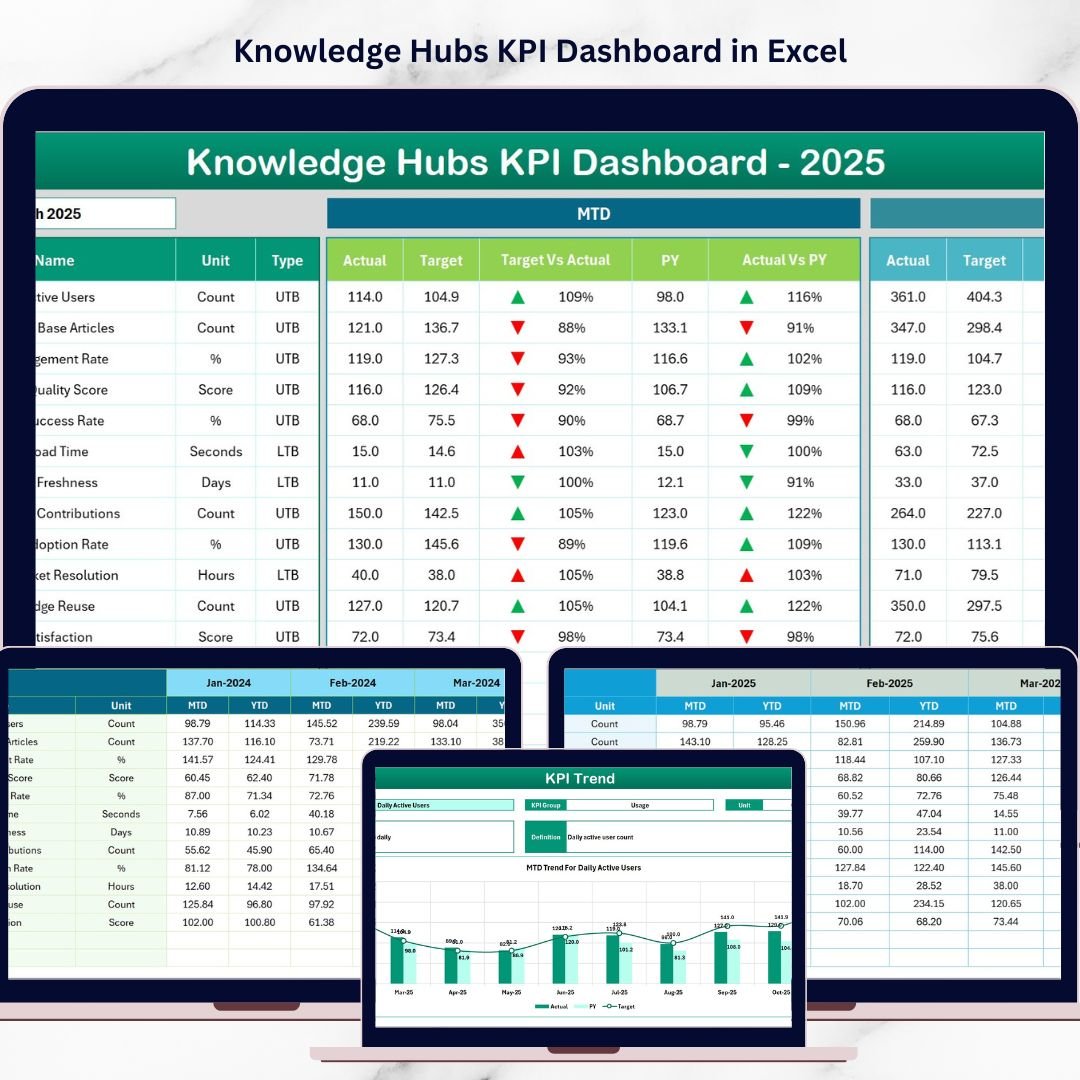
The Knowledge Hubs KPI Dashboard in Excel is a powerful, ready-to-use performance monitoring solution designed to simplify KPI tracking, reporting, and analysis. Built with structured worksheets, dynamic calculations, and interactive visualizations, this dashboard helps organizations monitor month-to-date (MTD) and year-to-date (YTD) performance while comparing actual values against targets and previous year results.
Knowledge Hubs KPI Dashboard in Excel Instead of creating complex reports manually, teams can simply update structured input sheets and instantly view updated dashboards. This approach ensures faster insights, improved transparency, and data-driven decision-making.
Whether you are monitoring outsourced accounting performance, managing knowledge management metrics, or tracking operational KPIs, this Excel dashboard provides a centralized and professional reporting system that saves time and improves accuracy.
🚀 Key Features of Knowledge Hubs KPI Dashboard in Excel
📊 Interactive KPI Dashboard – Monitor performance metrics in a clean and dynamic interface.
📅 Dynamic Month Selection – Select the reporting month (Cell D3) to instantly update all dashboard metrics.
📈 MTD & YTD Tracking – Compare monthly and yearly performance trends easily.
🎯 Target vs Actual Analysis – Evaluate performance against planned targets.
📉 Previous Year Benchmarking – Analyze growth or decline compared to historical data.
📊 KPI Trend Charts – Visualize KPI movements across months.
📘 Detailed KPI Definitions – Maintain clarity with formulas, units, and KPI descriptions.
⚡ Automated Conditional Formatting – Up and down arrows instantly highlight performance changes.
🧾 Organized Data Input Sheets – Structured input for Actual, Target, and Previous Year data.
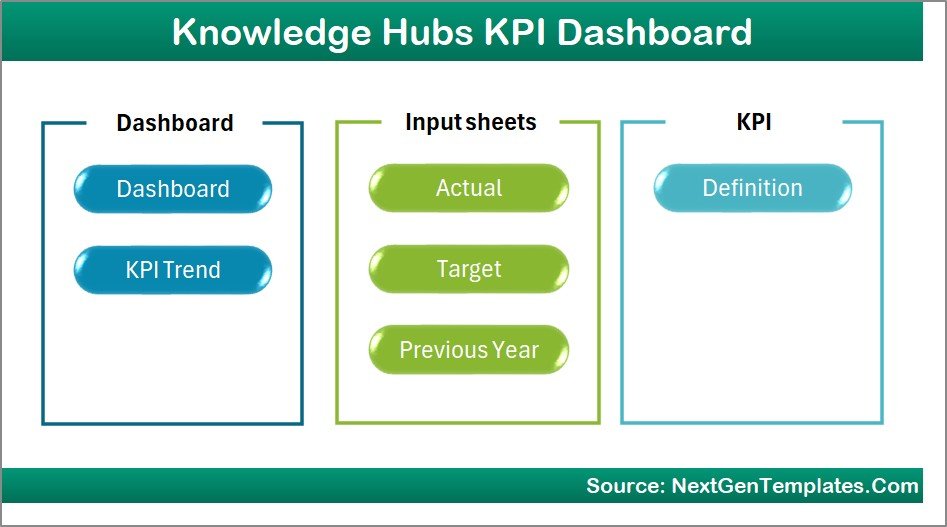
📦 Dashboard Structure – 7 Organized Worksheets
This template contains seven structured worksheets designed to provide a complete KPI performance management system
1️⃣ Home Sheet – Navigation Hub
The Home Sheet acts as the index page for the entire dashboard.
It includes six navigation buttons that allow users to quickly move between different sheets. This improves usability and helps users locate analysis pages instantly.
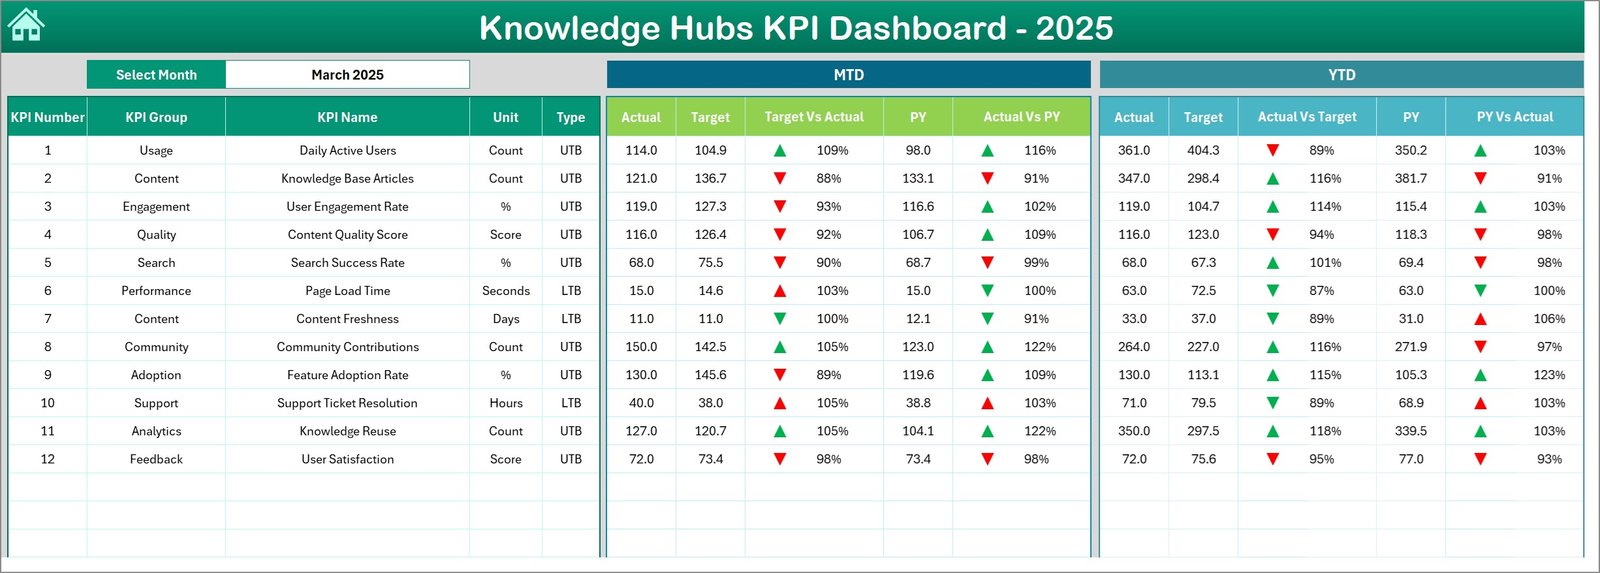
2️⃣ Dashboard Sheet – Main KPI Overview
The Dashboard Sheet is the core performance reporting page.
Users can select a month from the dropdown located in cell D3, which automatically updates all dashboard values.
Displayed metrics include:
MTD Performance
-
MTD Actual
-
MTD Target
-
MTD Previous Year
-
Target vs Actual comparison
-
Previous Year vs Actual comparison
YTD Performance
-
YTD Actual
-
YTD Target
-
YTD Previous Year
-
Target vs Actual comparison
-
Previous Year vs Actual comparison
Conditional formatting arrows provide instant visual insights into KPI performance.
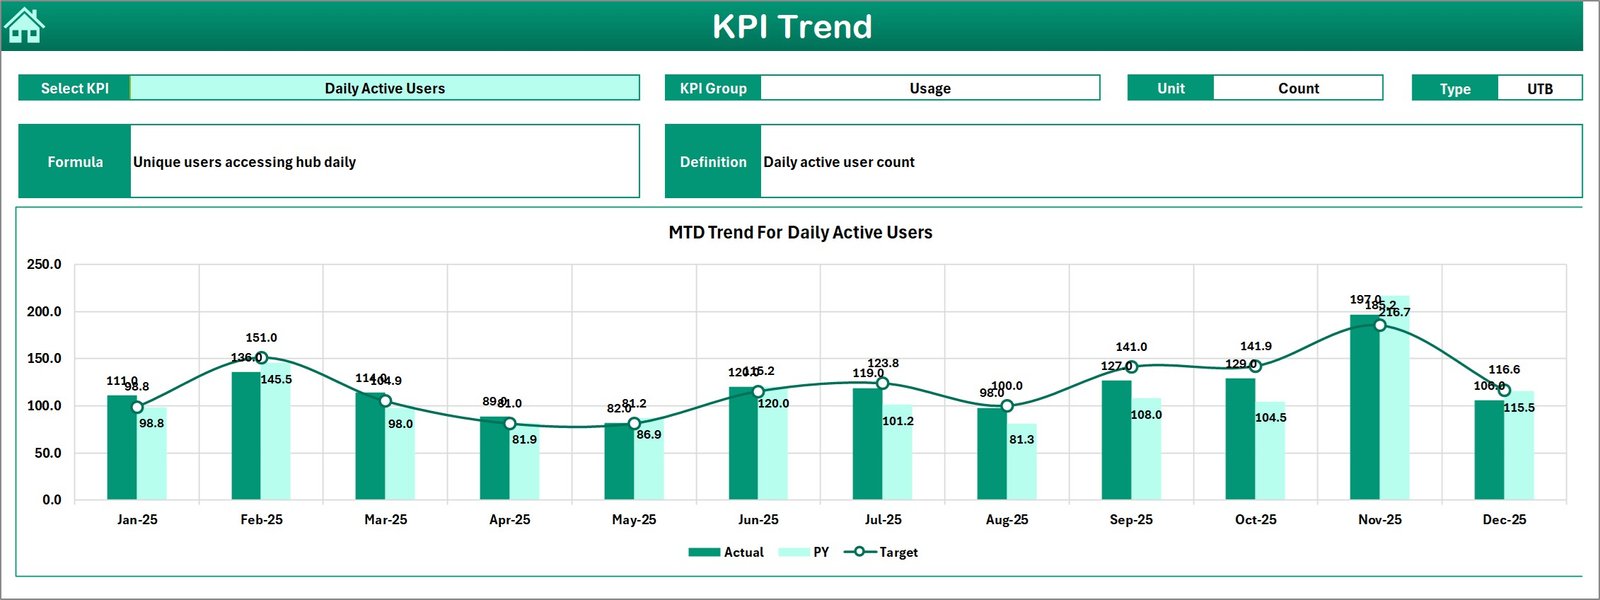
3️⃣ KPI Trend Sheet – Performance Trend Analysis
The KPI Trend Sheet enables detailed KPI analysis.
Users can select a KPI from the dropdown menu located in cell C3.
The sheet displays:
-
KPI Group
-
Unit of Measure
-
KPI Type (Lower the Better / Upper the Better)
-
KPI Formula
-
KPI Definition
Additionally, the sheet contains trend charts for MTD and YTD performance, helping users understand how KPIs evolve over time.
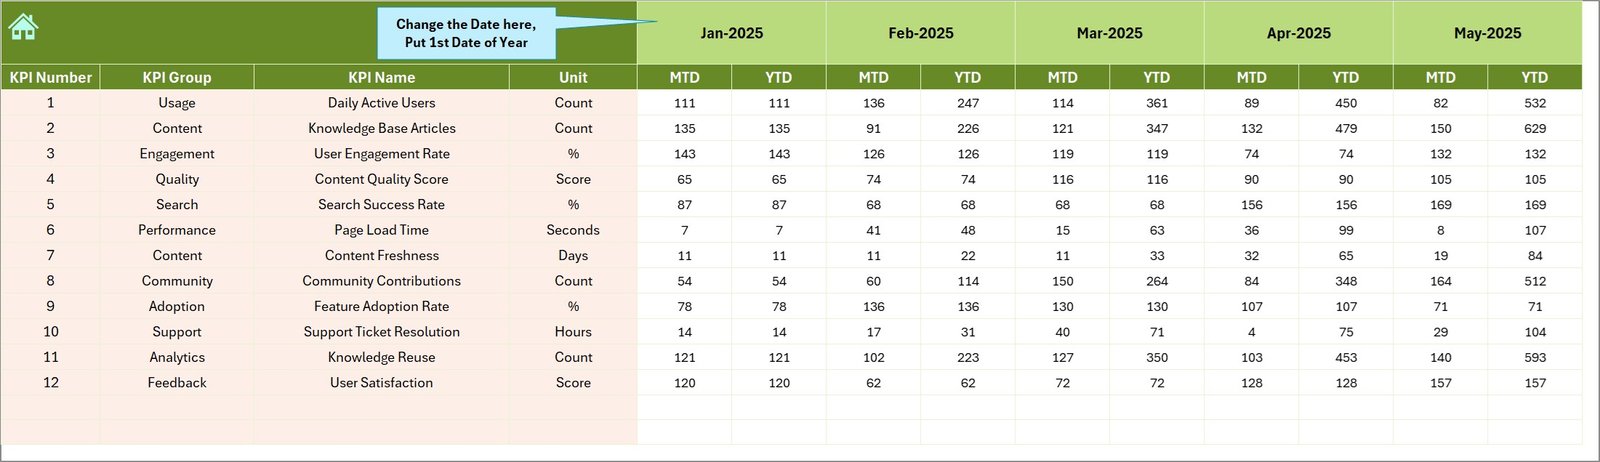
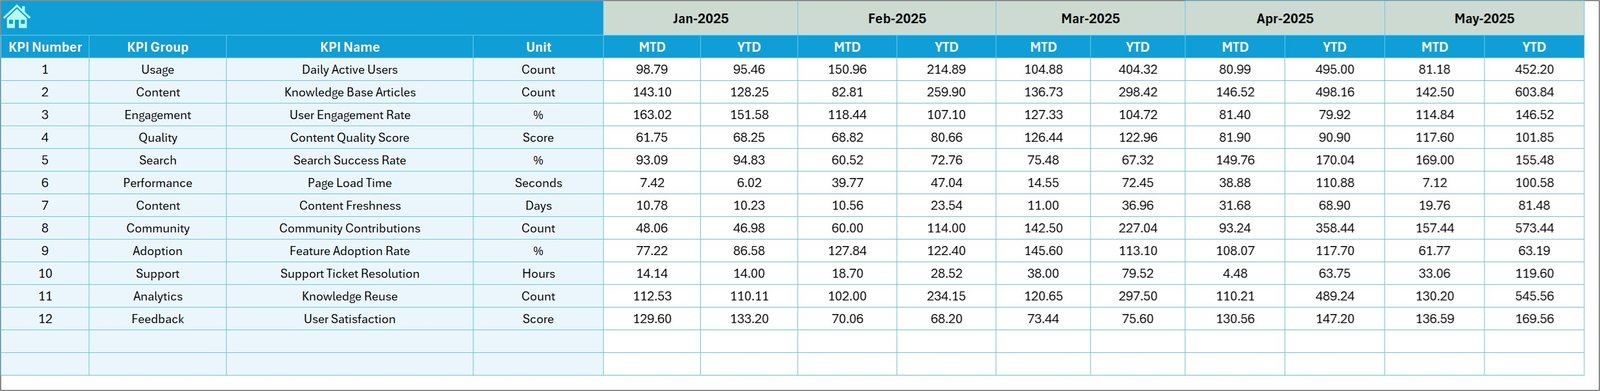
4️⃣ Actual Numbers Input Sheet
This sheet is used to enter actual KPI values.
Users simply:
-
Define the starting month in cell E1
-
Enter monthly MTD and YTD actual numbers
Once entered, the dashboard automatically updates calculations.
5️⃣ Target Numbers Sheet
This sheet stores monthly KPI targets.
Users enter both:
-
MTD target values
-
YTD target values
This allows the dashboard to compare actual performance with planned objectives.
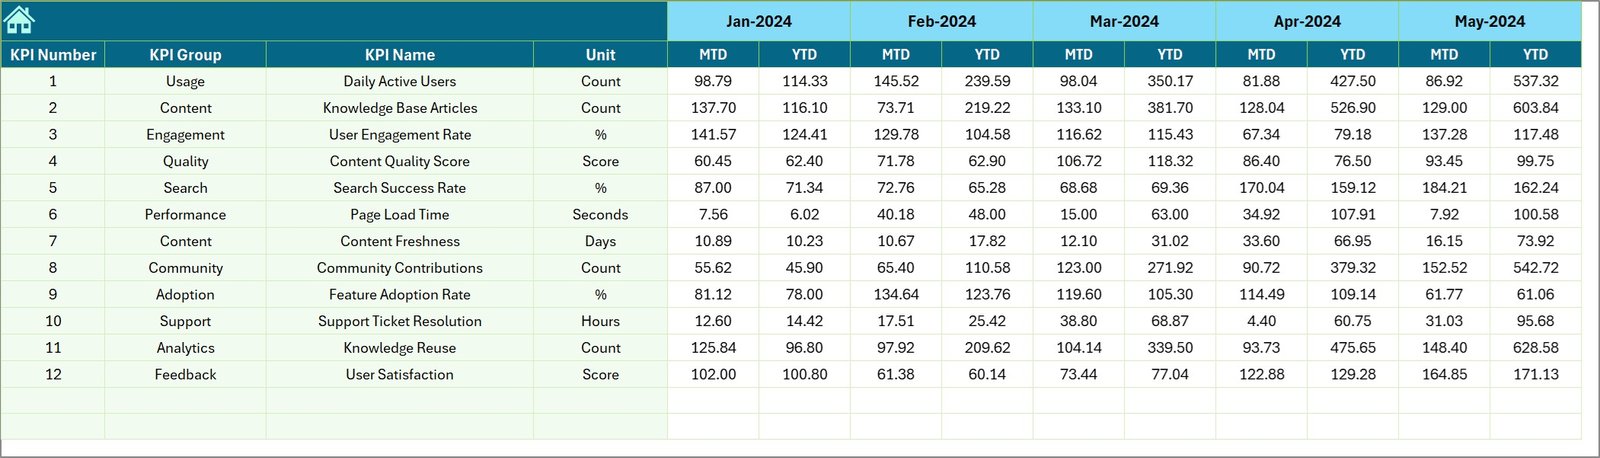
6️⃣ Previous Year Numbers Sheet
This sheet stores historical KPI data from the previous year.
By maintaining this information, users can analyze performance trends and evaluate year-over-year improvements.
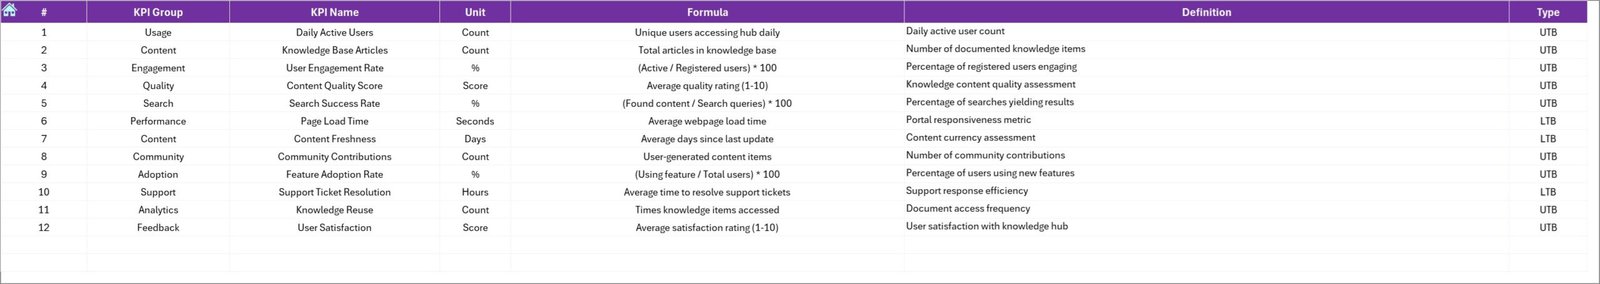
7️⃣ KPI Definition Sheet
This sheet acts as the KPI reference database.
It includes:
-
KPI Name
-
KPI Group
-
Unit of Measure
-
KPI Formula
-
KPI Definition
-
KPI Type (Lower the Better or Upper the Better)
This ensures that every KPI is clearly defined and understood across the organization.
⭐ Advantages of Knowledge Hubs KPI Dashboard
✅ Centralized KPI Monitoring – Track all performance metrics in one place.
✅ Improved Decision-Making – Visual dashboards simplify complex data analysis.
✅ Time-Saving Reporting – Automated calculations reduce manual work.
✅ Enhanced Data Consistency – Structured input sheets minimize errors.
✅ Flexible Customization – Modify KPIs to match business needs.
✅ Clear Performance Insights – Conditional formatting highlights trends instantly.
🔧 Best Practices for Using the Dashboard
✔ Keep KPI definitions updated and aligned with business objectives.
✔ Update actual numbers regularly for accurate insights.
✔ Review trend charts frequently to detect issues early.
✔ Ensure all users understand data input procedures.
✔ Backup dashboard files regularly to avoid data loss.
Click here to read the Detailed blog post
🎥 Visit our YouTube channel to watch the demo
👉 https://youtube.com/@NextGenTemplates


