Bridge construction projects demand precise planning, continuous monitoring, and strict performance control. However, many construction companies still rely on scattered spreadsheets and manual reports, which makes it difficult to track progress, control budgets, and maintain safety compliance.
That is exactly why the Bridge Construction KPI Dashboard in Excel is a powerful solution for modern construction teams.
This ready-to-use Excel dashboard helps project managers, engineers, and infrastructure companies monitor construction performance through a centralized reporting system. Instead of reviewing multiple project files, all important bridge construction metrics can be analyzed from one interactive dashboard.
With automated calculations, trend analysis, and performance comparisons, this dashboard allows construction teams to identify issues early, evaluate progress accurately, and make data-driven decisions to complete projects successfully.
Whether you manage infrastructure development, government bridge projects, or large construction operations, this Excel KPI dashboard simplifies performance monitoring and improves project transparency.
🚀 Key Feature of Bridge Construction KPI Dashboard in Excel
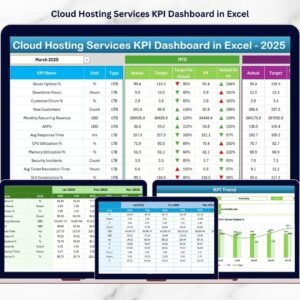
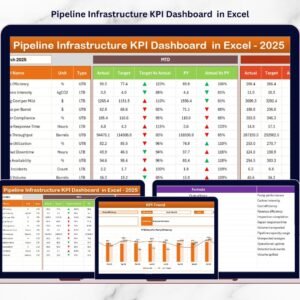
📊 Interactive KPI Monitoring Dashboard
Monitor all bridge construction KPIs from a centralized dashboard with automated calculations and visual indicators.
📅 Dynamic Month Selection
Select the desired month from the drop-down menu, and the dashboard automatically updates all metrics for that period.
📈 MTD and YTD Performance Tracking
Track Month-to-Date (MTD) and Year-to-Date (YTD) performance to evaluate project progress effectively.
🎯 Target vs Actual Comparison
Compare actual results against planned targets to quickly identify performance gaps.
📉 Previous Year Comparison
Evaluate current performance against historical data to understand long-term project trends.
🔺 Conditional Formatting Indicators
Visual arrows and color indicators instantly highlight whether KPI performance is improving or declining.
📊 Trend Analysis Charts
Analyze KPI performance trends using interactive MTD and YTD charts.
🏗 Centralized KPI Monitoring System
All bridge construction metrics such as productivity, safety, costs, and project progress are displayed in one place.
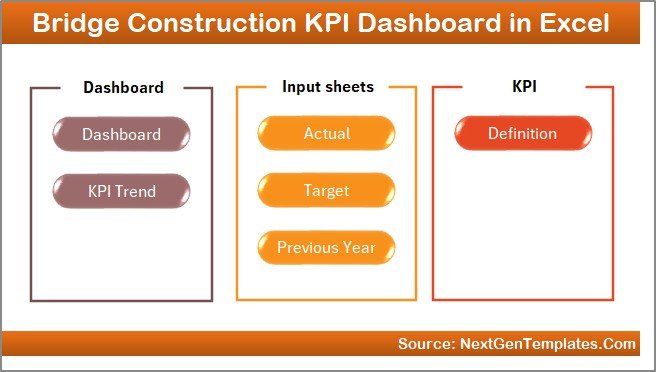
📦 What’s Inside the Bridge Construction KPI Dashboard in Excel
This ready-to-use Excel dashboard includes 7 structured worksheets designed for complete KPI management.
📍 Home Sheet – Dashboard Navigation
A user-friendly index page with navigation buttons to quickly access all dashboard sheets.
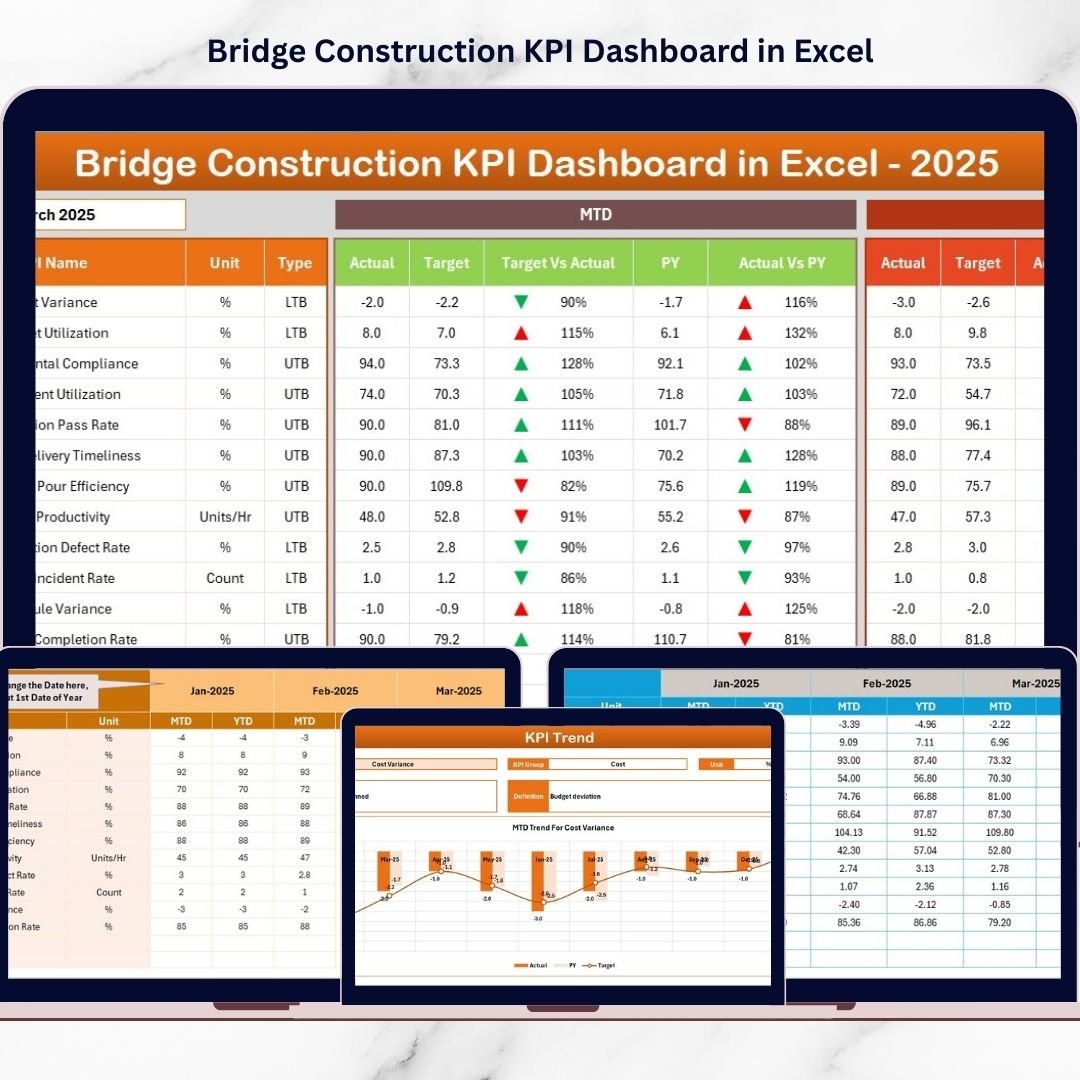
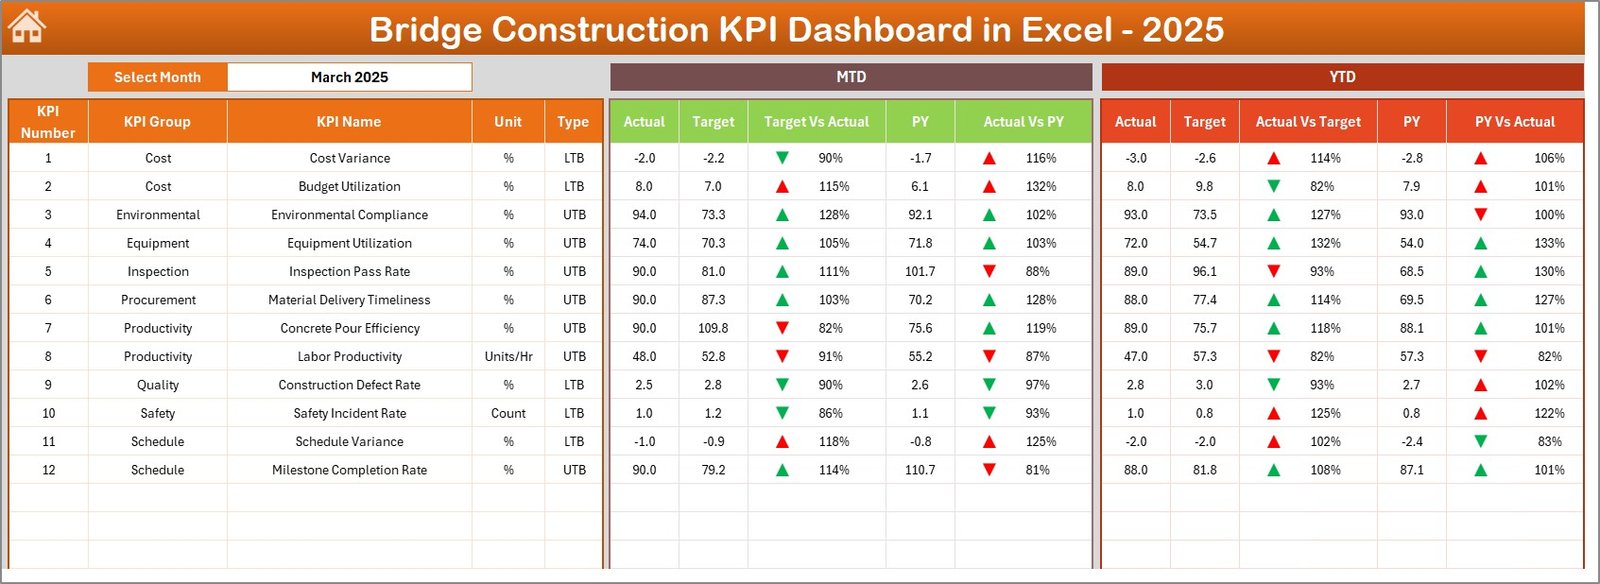
📍 Dashboard Sheet – Main KPI Overview
Displays a complete summary of bridge construction KPIs with performance comparisons and visual indicators.
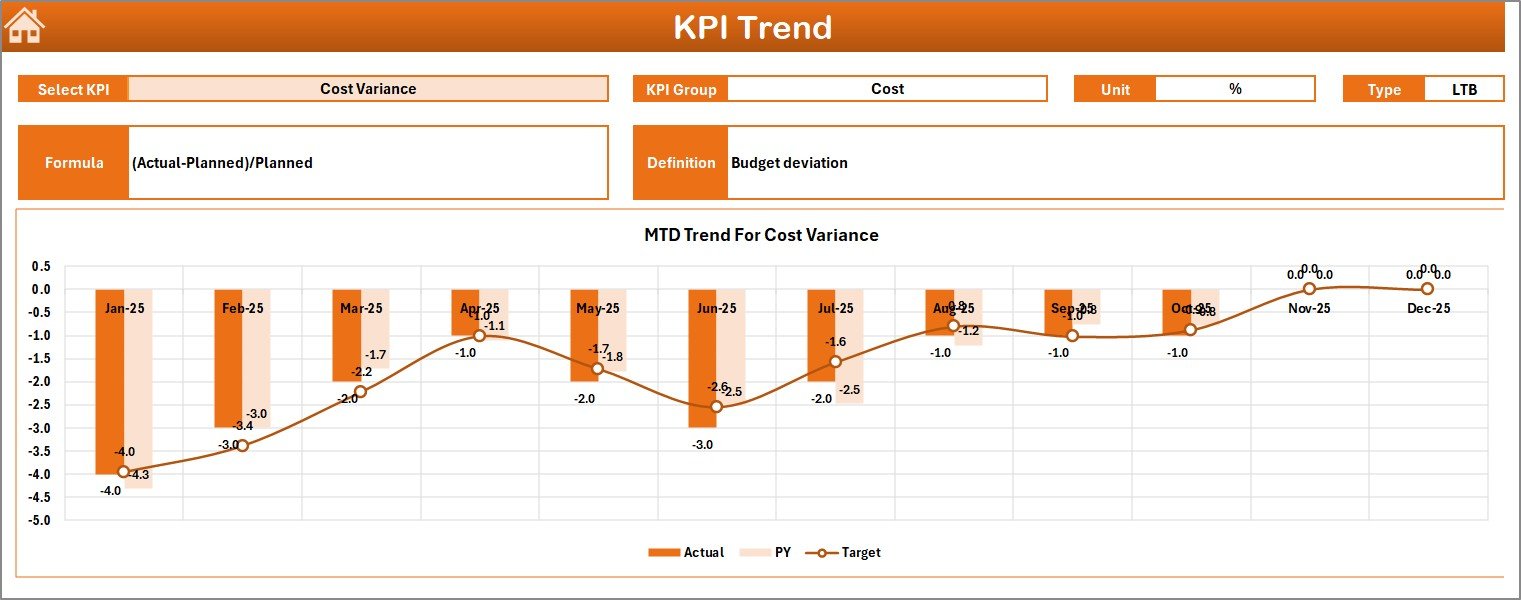
📍 KPI Trend Sheet – KPI Performance Analysis
Allows users to select any KPI and analyze its monthly and yearly performance trends.
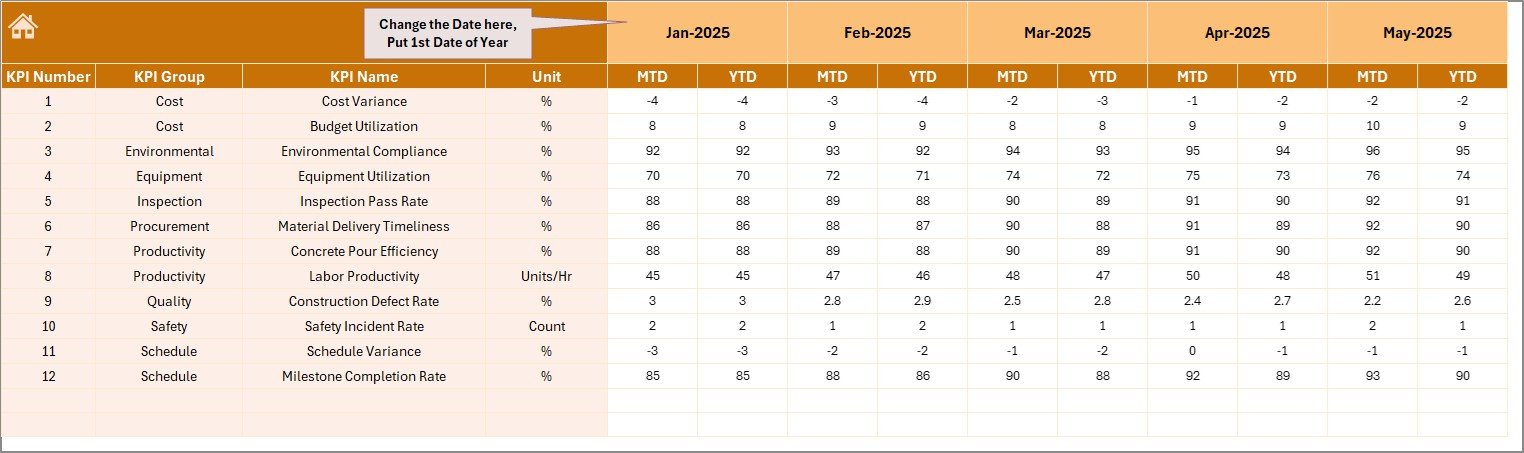
📍 Actual Numbers Input Sheet – Data Entry System
A structured data entry sheet where users input monthly KPI performance data.
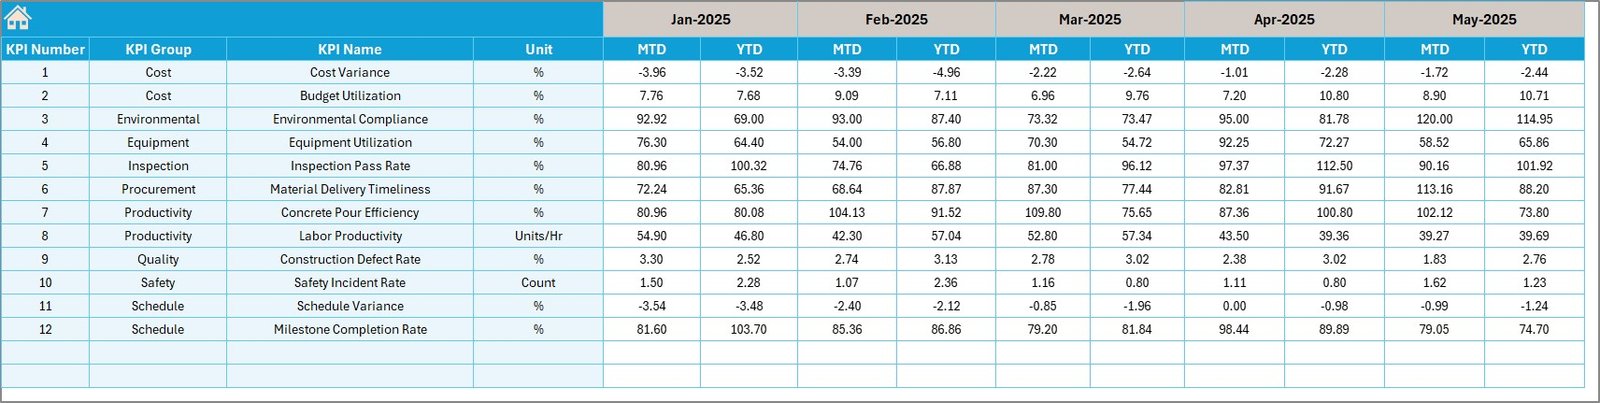
📍 Target Sheet – KPI Target Planning
Allows project managers to define monthly KPI targets and performance expectations.
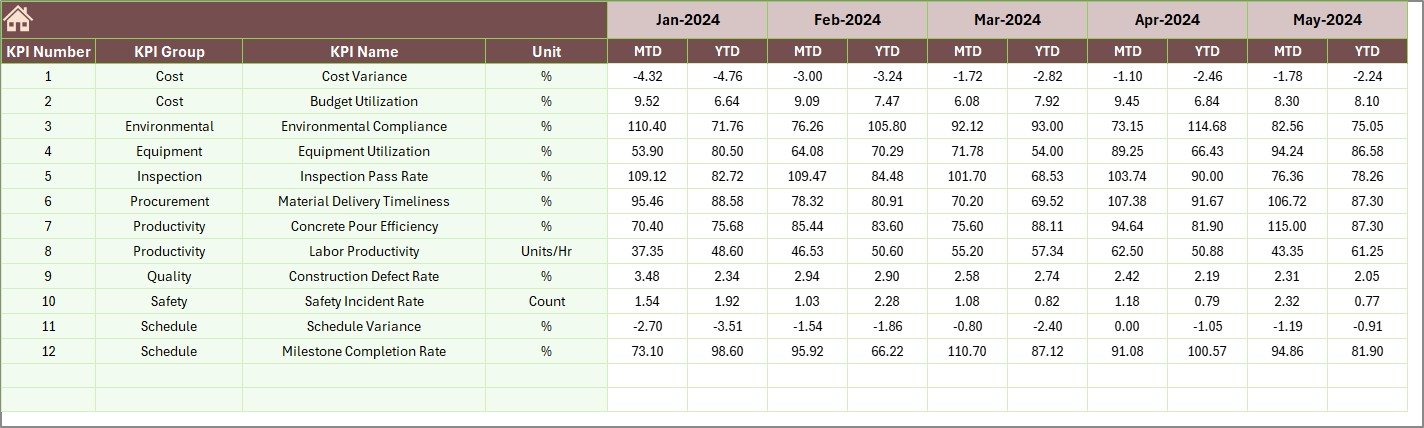
📍 Previous Year Numbers Sheet – Historical Data Comparison
Stores historical KPI performance data to compare current performance with previous year results.
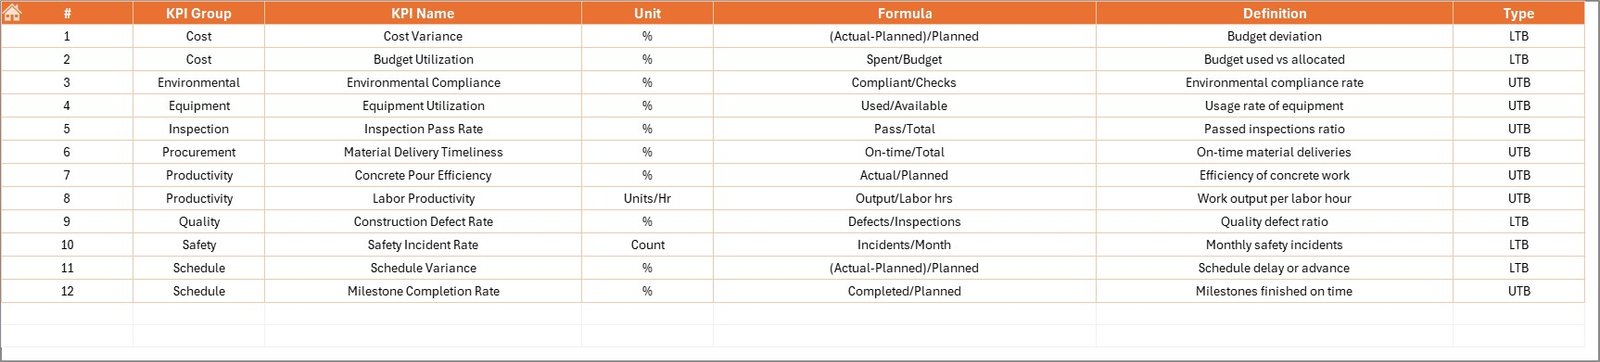
📍 KPI Definition Sheet – KPI Database
A centralized sheet that stores KPI names, groups, units, formulas, and definitions.
Together, these sheets create a powerful KPI monitoring system for bridge construction projects.
🛠 How to Use the Bridge Construction KPI Dashboard in Excel
Using this dashboard is simple and requires no advanced Excel skills.
Step 1 – Define KPIs
Enter KPI details in the KPI Definition Sheet, including KPI name, group, unit, and formula.
Step 2 – Enter Target Values
Add monthly target values in the Target Sheet for each KPI.
Step 3 – Input Actual Data
Enter project performance data in the Actual Numbers Input Sheet.
Step 4 – Add Historical Data
Input previous year KPI values in the Previous Year Numbers Sheet.
Step 5 – Analyze the Dashboard
Open the Dashboard Sheet and select the desired month to view KPI performance insights instantly.
Within seconds, the dashboard will visualize project performance using charts, comparisons, and indicators.
👷 Who Can Benefit from This Bridge Construction KPI Dashboard in Excel
This Excel dashboard is designed for professionals involved in infrastructure development and construction management.
🏗 Bridge Construction Companies – Monitor project progress, safety, and productivity.
👷 Project Managers – Track KPI performance and ensure projects stay on schedule.
📊 Construction Engineers – Analyze project performance metrics efficiently.
🏢 Infrastructure Development Firms – Monitor large infrastructure projects with structured KPI reporting.
📑 Government Infrastructure Departments – Track public bridge construction project performance.
📈 Project Analysts and Consultants – Evaluate construction performance trends and improve planning.
Click here to read the Detailed blog post
Visit our YouTube channel to learn step-by-step video tutorials
https://www.youtube.com/@PKAnExcelExpert