In today’s fast-moving manufacturing industry, companies producing industrial tools and fasteners must constantly monitor performance to stay competitive. Rising production costs, strict delivery timelines, and increasing quality expectations make performance tracking more important than ever. However, many organizations still depend on disconnected spreadsheets and manual reporting methods that slow down analysis and decision-making.
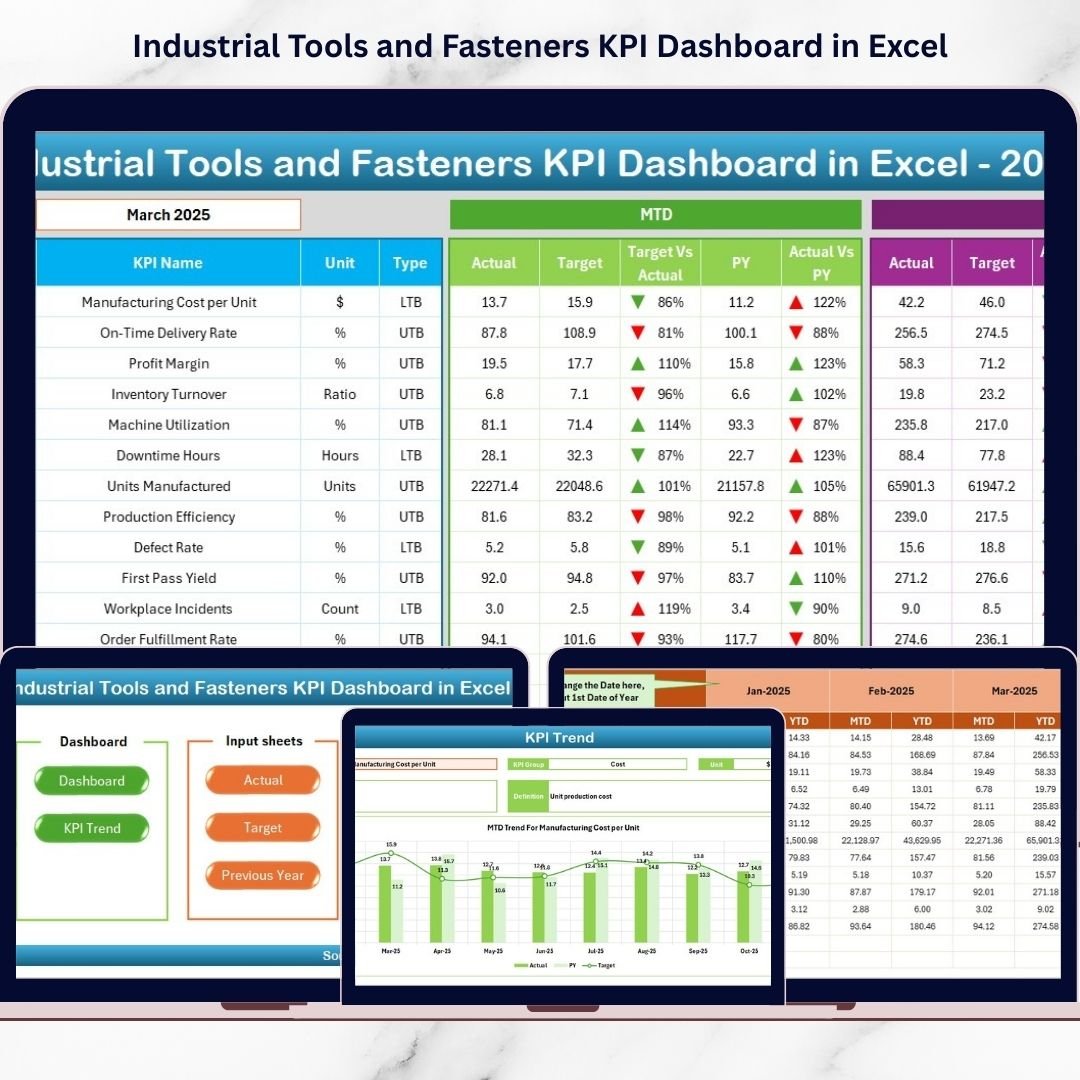
The Industrial Tools and Fasteners KPI Dashboard in Excel is designed to solve these challenges by transforming complex operational data into clear, actionable insights. This ready-to-use dashboard helps manufacturers monitor production, quality, delivery, cost, and efficiency KPIs through a structured and automated Excel system.
Instead of spending hours compiling reports, managers can instantly view performance trends, compare targets, and identify improvement opportunities — all from one centralized dashboard.
Built entirely in Microsoft Excel, this solution combines automation, visualization, and simplicity, making it ideal for manufacturing teams looking for a powerful yet affordable analytics tool.
⭐ Key Features of Industrial Tools and Fasteners KPI Dashboard in Excel
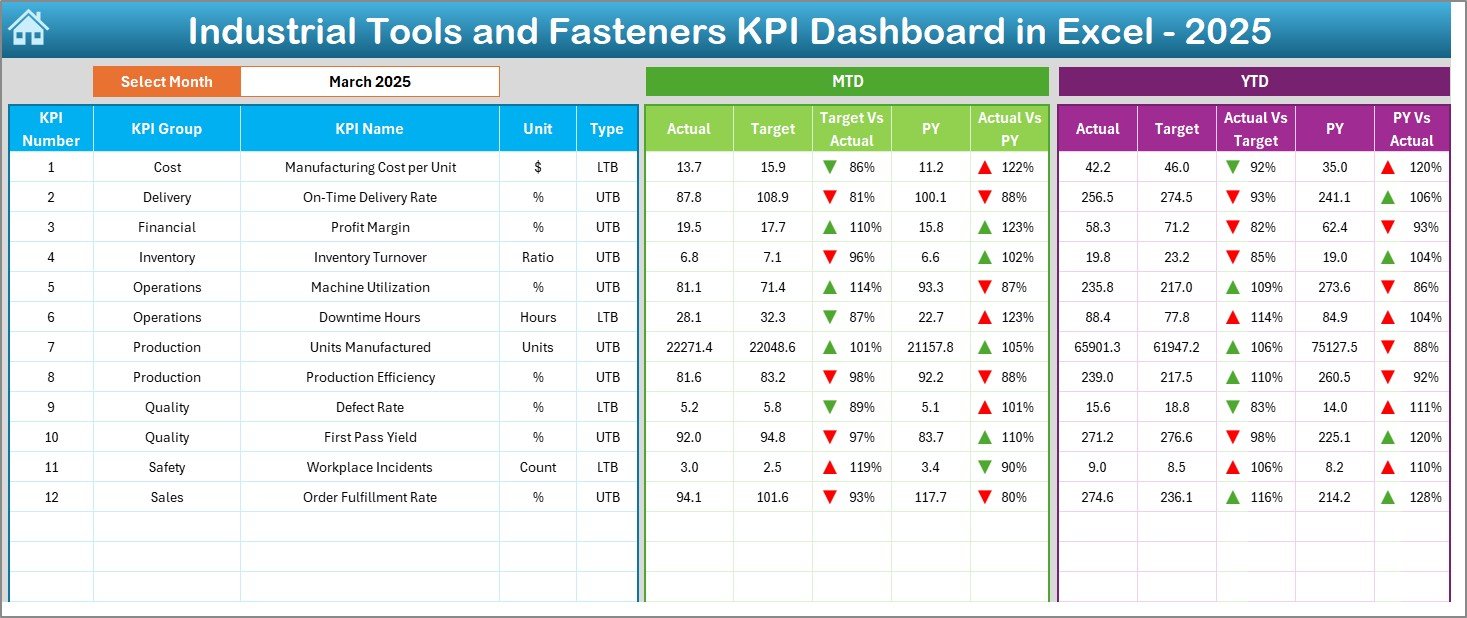
✅ Interactive dashboard with automated KPI calculations
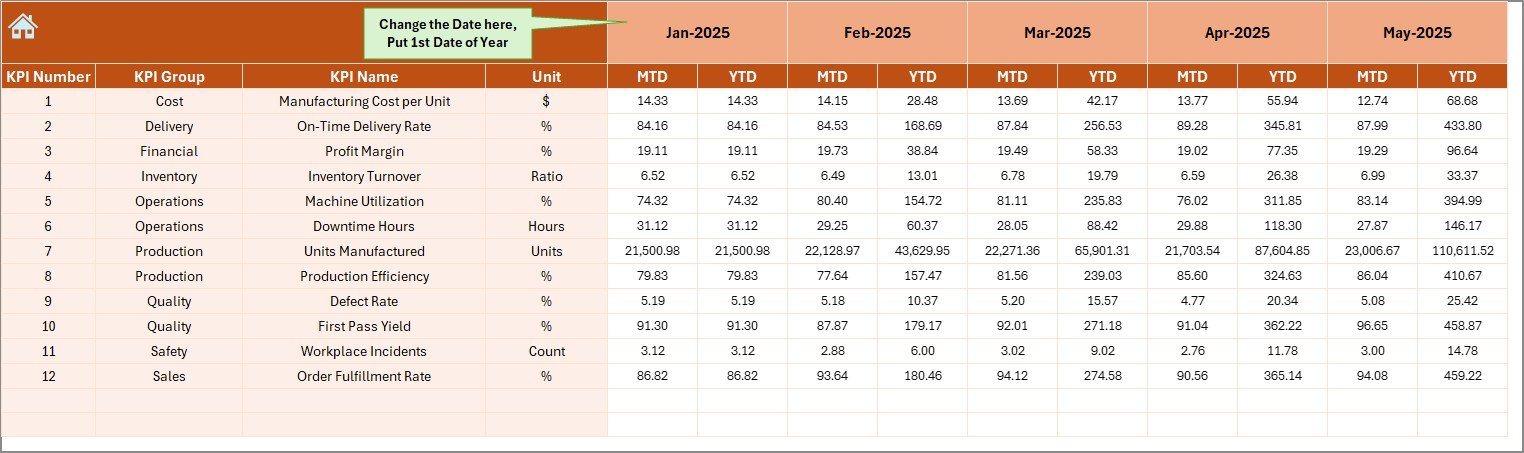
✅ Month selection control for dynamic reporting
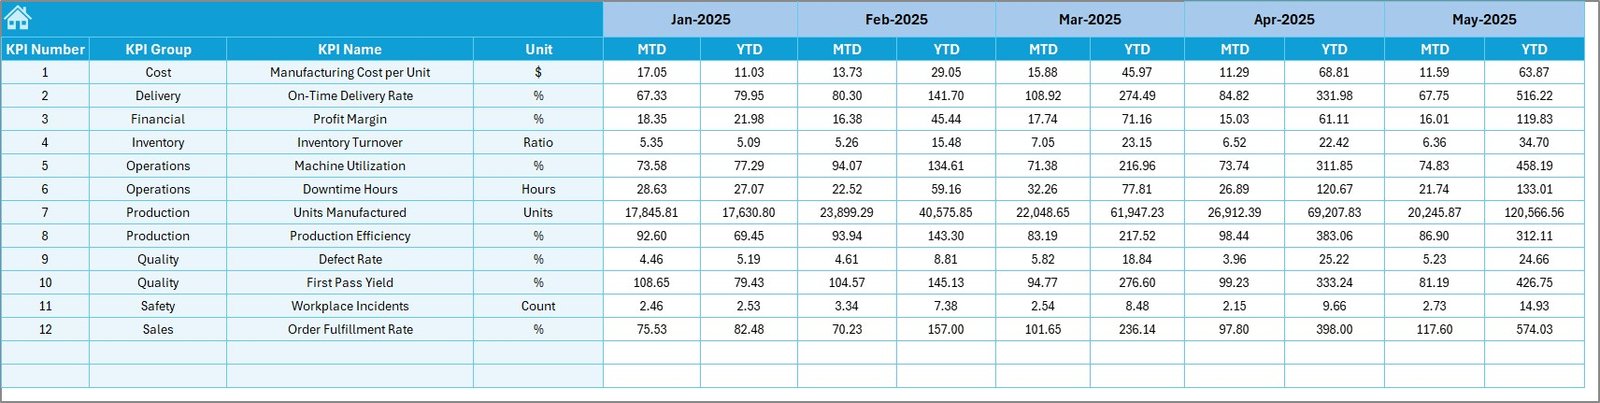
✅ MTD and YTD performance analysis
✅ Actual vs Target and Previous Year comparisons
✅ Visual performance indicators with up/down arrows
✅ Dedicated sheets for data input, targets, and benchmarking
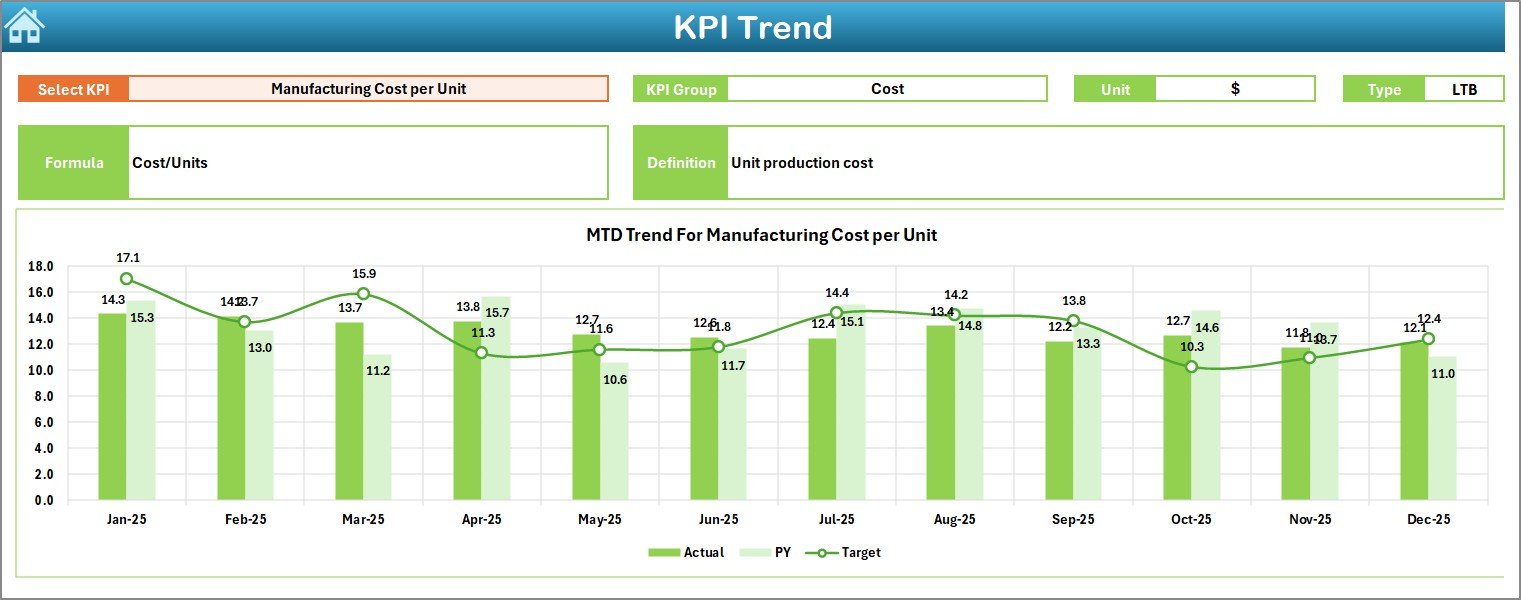
✅ Dynamic KPI trend analysis with charts
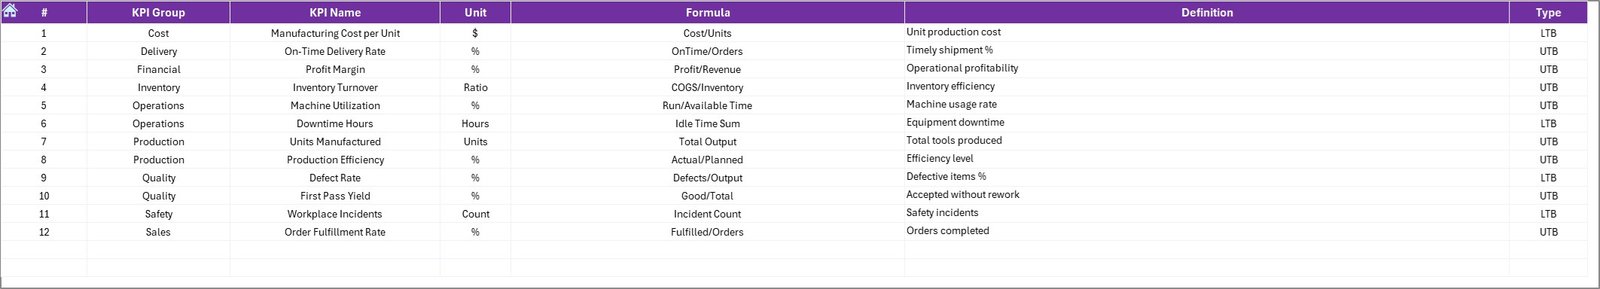
✅ Centralized KPI definition and documentation system
These features allow managers to understand operational performance within seconds and make faster, data-driven decisions.
📦 What’s Inside the Industrial Tools and Fasteners KPI Dashboard in Excel
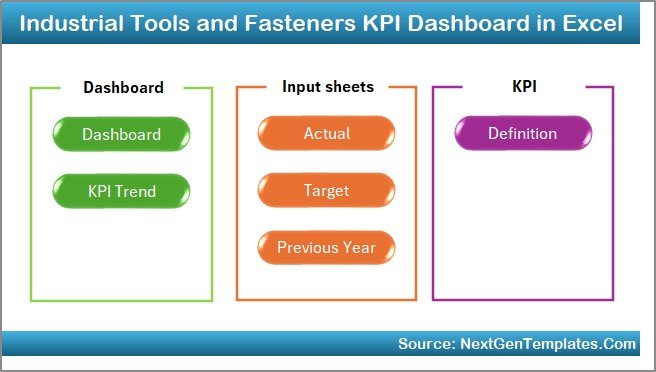
This product includes a fully structured Excel workbook with 7 professionally designed worksheets:
-
Summary Page – Navigation hub with quick access buttons
-
Dashboard Sheet – Complete KPI performance overview
-
Trend Sheet – Historical KPI analysis and comparisons
-
Actual Numbers Input Sheet – Monthly data entry system
-
Target Sheet – Performance goal management
-
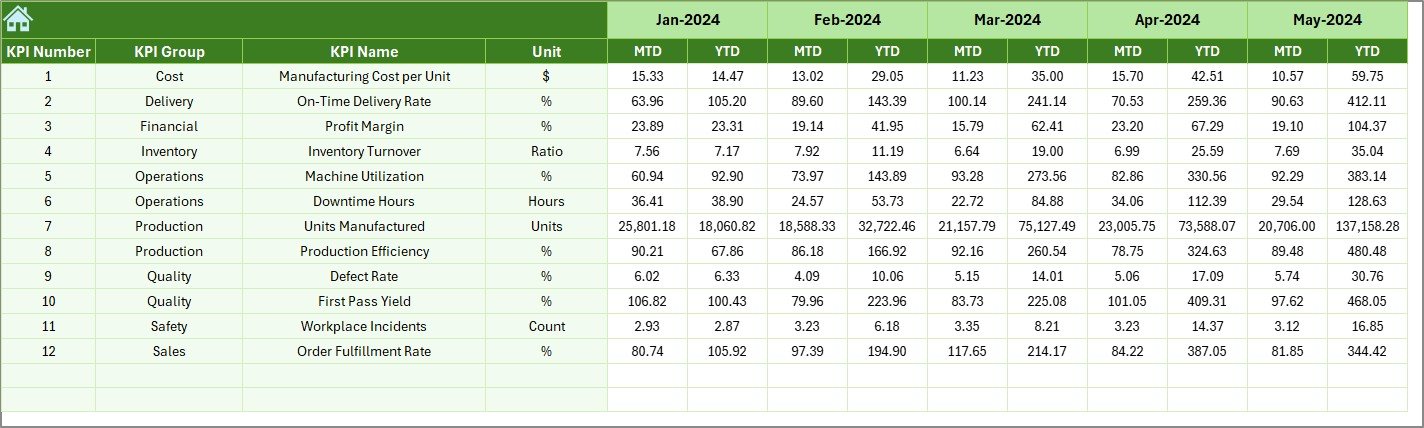
Previous Year Numbers Sheet – Benchmarking and comparisons
-
KPI Definition Sheet – KPI formulas and explanations repository
Each sheet works together to create a seamless KPI monitoring environment.
🛠 How to Use the Industrial Tools and Fasteners KPI Dashboard in Excel
Using the dashboard is simple and requires no advanced technical skills:
1️⃣ Define KPIs in the KPI Definition sheet
2️⃣ Enter performance targets in the Target sheet
3️⃣ Input monthly actual data values
4️⃣ Add previous year performance numbers
5️⃣ Select a reporting month from the dropdown
6️⃣ Instantly analyze results on the dashboard
Once data is entered, Excel automatically updates charts, comparisons, and indicators — saving significant reporting time.
🎯 Who Can Benefit from This Industrial Tools and Fasteners KPI Dashboard in Excel
This dashboard is ideal for professionals involved in manufacturing operations, including:
-
Production Managers
-
Plant Supervisors
-
Quality Engineers
-
Operations Managers
-
Supply Chain Teams
-
Manufacturing Analysts
-
Business Owners & Decision Makers
Because all stakeholders work from a single source of truth, collaboration improves and operational alignment becomes stronger.
Organizations using this dashboard gain multiple advantages such as improved productivity, faster decision-making, better performance visibility, and stronger strategic planning. By combining automation with structured KPI tracking, businesses can reduce reporting effort while increasing operational control.
Unlike complex BI tools, this Excel dashboard is easy to implement, highly customizable, and cost-effective. It enables companies of all sizes to adopt data-driven manufacturing without investing in expensive software.
If your organization wants clearer insights, improved efficiency, and smarter performance monitoring, this dashboard provides the perfect starting point.
Click here to read the Detailed blog post
Watch the step-by-step video tutorial:


