In today’s rapidly evolving financial ecosystem, microfinance institutions (MFIs) play a vital role in empowering small businesses, rural entrepreneurs, and financially underserved communities. However, managing thousands of loans, tracking repayments, monitoring branch performance, and analyzing regional financial trends can quickly become complex without structured analytics.
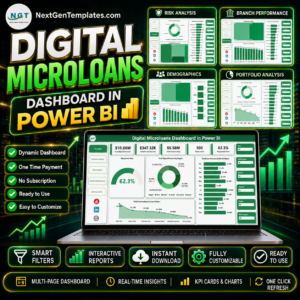
The Microfinance Institutions Dashboard in Power BI is a powerful, ready-to-use business intelligence solution designed to simplify microfinance performance monitoring. This interactive dashboard converts raw financial data into meaningful visual insights, enabling organizations to make faster, smarter, and data-driven decisions.
Instead of relying on multiple spreadsheets or manual reports, decision-makers can analyze all operational and financial metrics from one centralized platform. As a result, institutions improve loan monitoring, reduce operational risks, and enhance financial sustainability.
Built using Microsoft Power BI, this dashboard delivers real-time analytics through interactive visuals, dynamic slicers, and automated reporting. Whenever data updates, dashboard visuals refresh instantly, ensuring leadership teams always work with accurate information.
Whether you want to evaluate loan performance, compare branch productivity, analyze repayment trends, or monitor regional growth, this dashboard provides complete visibility into microfinance operations.
📊 Key Feature of Microfinance Institutions Dashboard in Power BI
📈 Centralized Financial Monitoring
Track loans, repayments, interest performance, and outstanding balances in one dashboard.
🎛️ Interactive Slicers & Filters
Analyze performance instantly by branch, region, loan type, or time period.
💳 Loan Portfolio Performance Analysis
Understand lending efficiency and repayment behavior visually.
🏢 Branch Performance Insights
Compare productivity and repayment trends across branches.
🌍 Regional Financial Analysis
Identify high-performing markets and potential risk areas.
📅 Monthly Trend Tracking
Monitor financial performance changes over time.
⚡ Real-Time Dashboard Updates
Refresh data and instantly view updated analytics.
📊 Executive KPI Cards
Quickly evaluate institutional health through summarized metrics.
📦 What’s Inside the Microfinance Institutions Dashboard in Power BI
This ready-to-use dashboard includes five structured analytical pages:
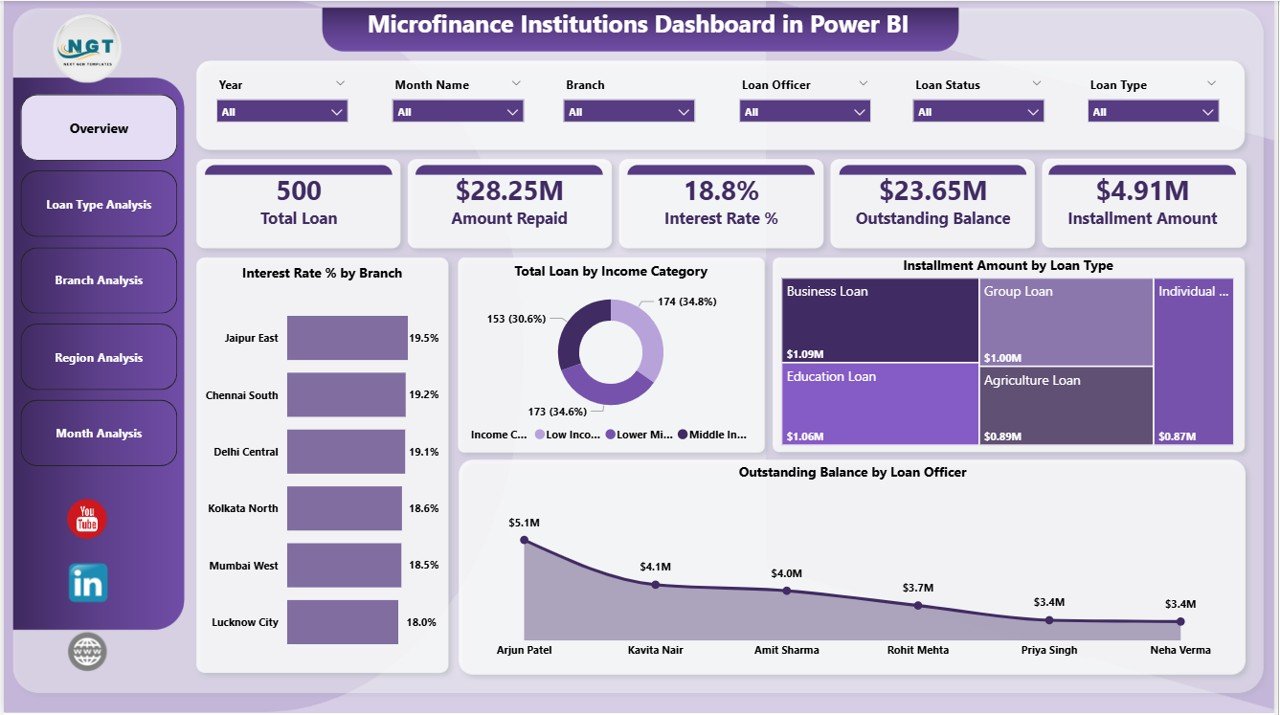
🔹 Overview Page
The executive control center displaying:
-
Interest Rate % by Branch
-
Total Loan by Income Category
-
Instalment Amount by Loan Type
-
Outstanding Balance by Loan Officer
Executives can instantly understand organizational performance using KPI cards and summary visuals.
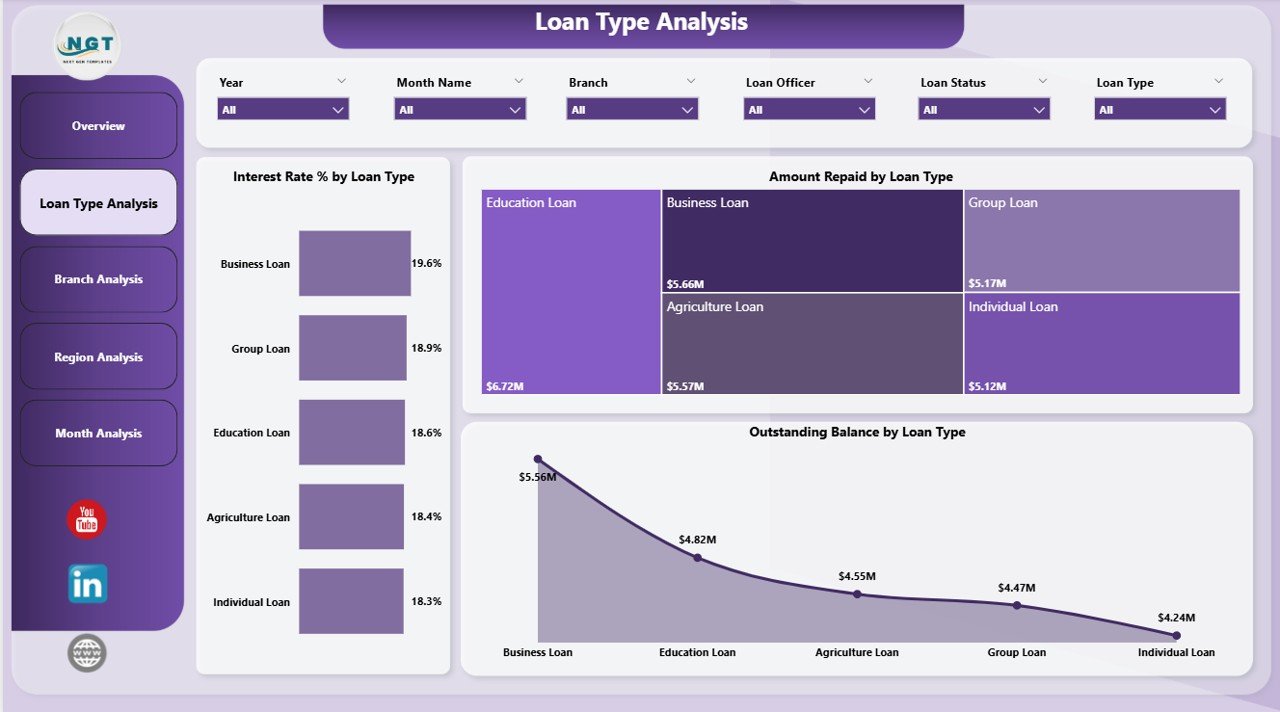
🔹 Loan Type Analysis
Analyze performance across loan categories using:
-
Interest Rate % by Loan Type
-
Amount Repaid by Loan Type
-
Outstanding Balance by Loan Type
Helps identify profitable and high-risk loan products.
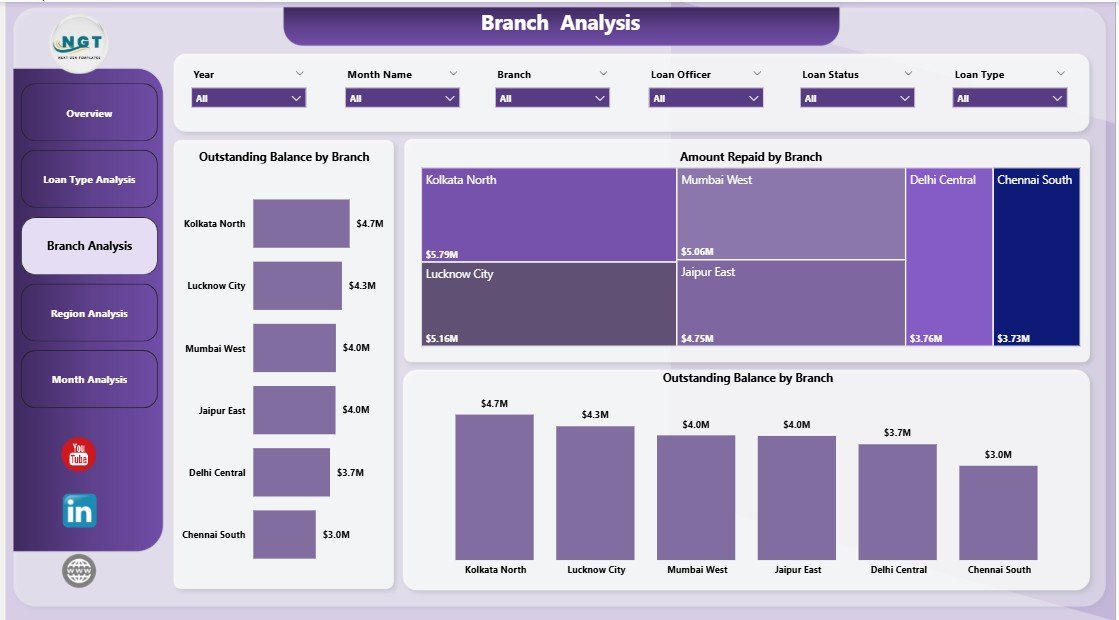
🔹 Branch Analysis
Evaluate operational efficiency with:
-
Total Loan by Branch
-
Amount Repaid by Branch
-
Outstanding Balance by Branch
Supports accountability and performance improvement.
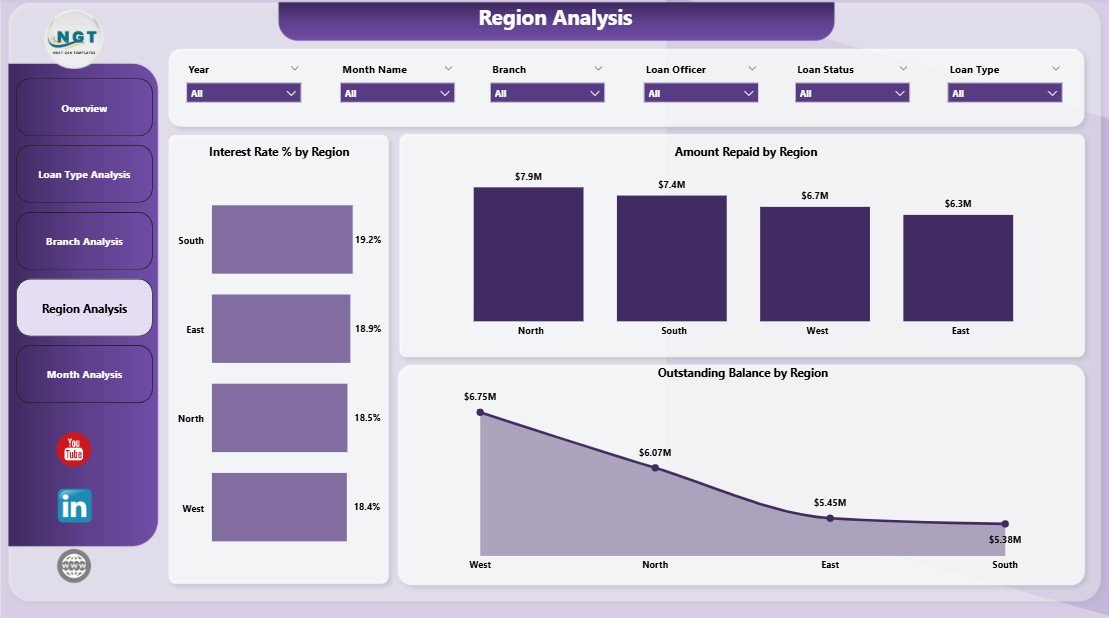
🔹 Region Analysis
Understand geographic performance through:
-
Interest Rate % by Region
-
Amount Repaid by Region
-
Outstanding Balance by Region
Enables strategic expansion planning.
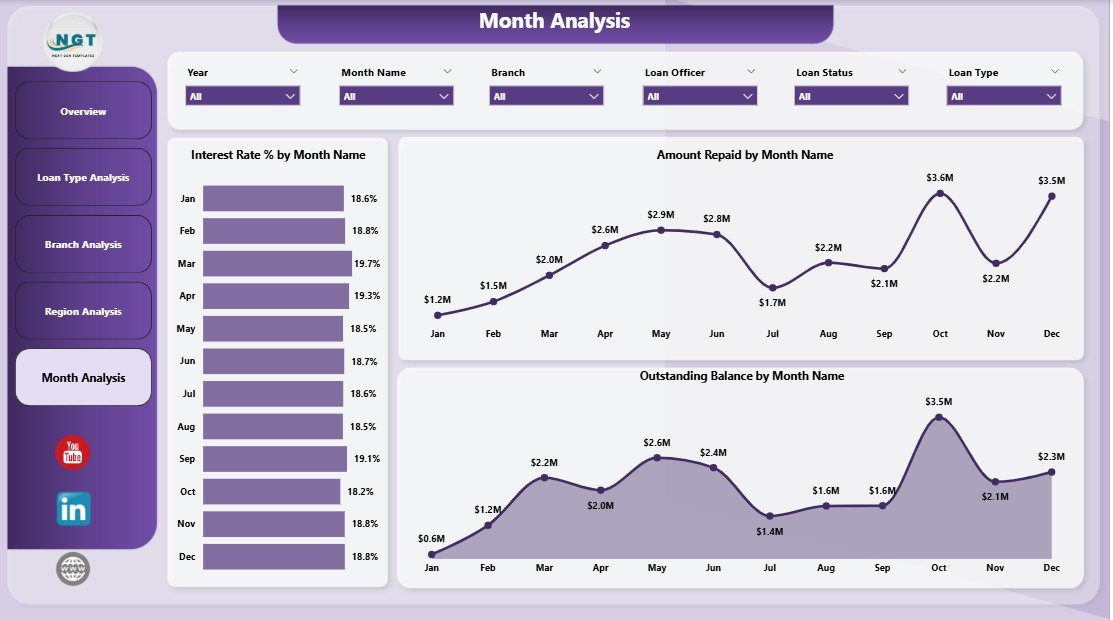
🔹 Month Analysis
Track financial trends using:
-
Interest Rate % by Month
-
Amount Repaid by Month
-
Outstanding Balance by Month
Helps forecast cash flow and detect early warning signals.
🛠️ How to Use the Microfinance Institutions Dashboard in Power BI
Using the dashboard is simple and user-friendly:
1️⃣ Import loan and repayment datasets into Power BI.
2️⃣ Refresh data connections.
3️⃣ Use slicers to filter insights dynamically.
4️⃣ Review KPI cards on the Overview page.
5️⃣ Navigate across analytical pages for deeper analysis.
6️⃣ Share interactive reports with stakeholders.
Because of its intuitive design, even non-technical users can operate the dashboard easily.
👥 Who Can Benefit from This Microfinance Institutions Dashboard
This dashboard is ideal for:
✔ Microfinance Institutions
✔ Financial Analysts
✔ Loan Officers
✔ Branch Managers
✔ NGO Finance Teams
✔ Executive Leadership
✔ Impact Investors & Stakeholders
Any organization managing loan portfolios and financial inclusion programs can benefit significantly.
🚀 Business Benefits
Implementing this dashboard helps organizations:
✅ Improve loan monitoring accuracy
✅ Detect repayment risks early
✅ Enhance branch accountability
✅ Reduce manual reporting effort
✅ Improve transparency for stakeholders
✅ Support data-driven lending decisions
Ultimately, institutions strengthen both financial performance and social impact.
### Click here to read the Detailed blog post
Visit our YouTube channel to learn step-by-step video tutorials
👉 Youtube.com/@PKAnExcelExpert