In today’s competitive manufacturing environment, synthetic fiber companies cannot rely on guesswork or scattered spreadsheets anymore. Production efficiency, quality consistency, operational costs, and delivery performance must be monitored continuously to stay profitable. However, manual reporting often causes delays, errors, and lack of visibility.
That’s exactly why we created the Synthetic Fibers KPI Dashboard in Excel — a powerful, ready-to-use performance monitoring solution designed specifically for synthetic fiber manufacturing operations.
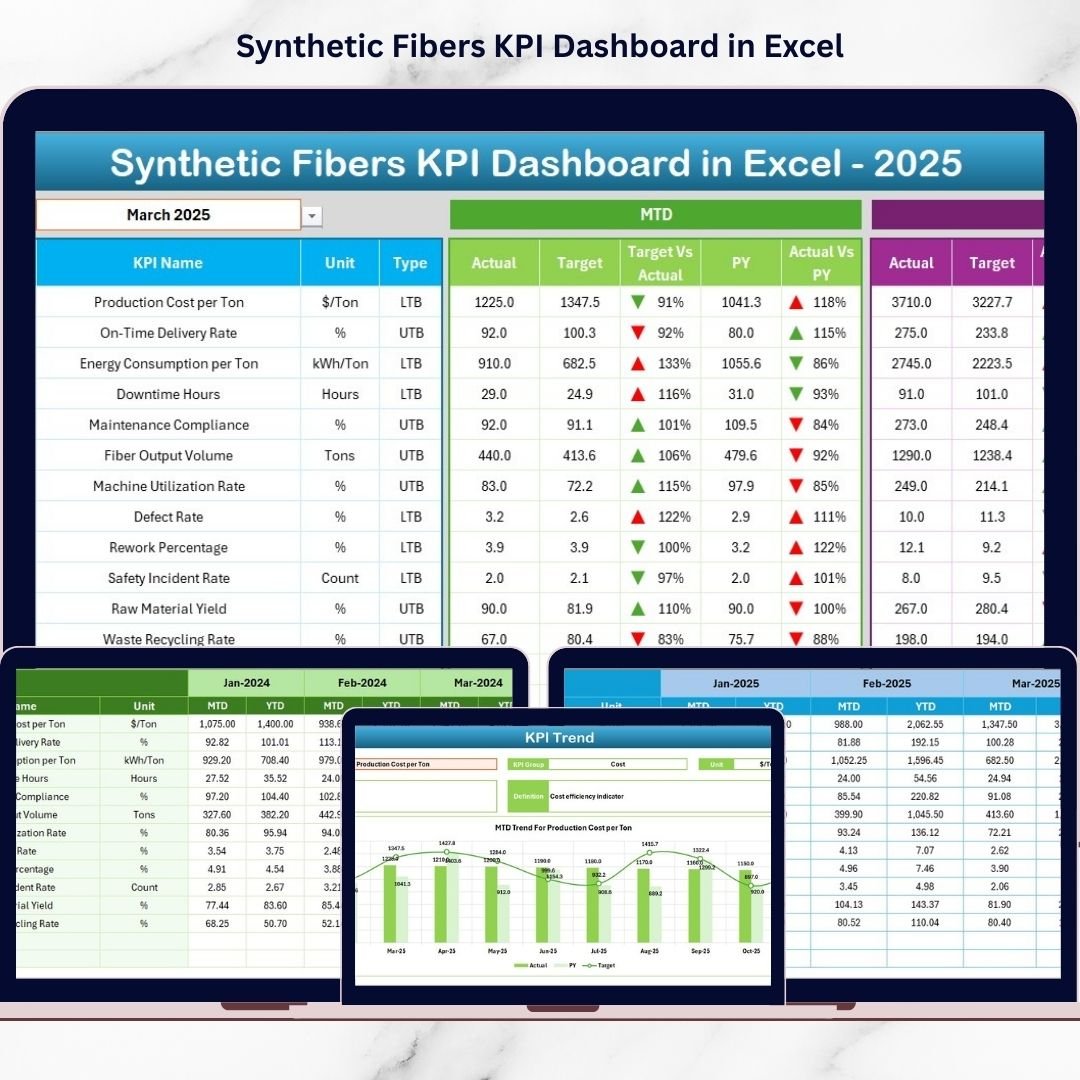
This professionally designed Excel dashboard transforms complex production data into clear visual insights, enabling managers to track KPIs, compare performance, and make faster data-driven decisions — all in one centralized system.
Whether you are a production manager, plant head, or manufacturing analyst, this dashboard helps you monitor operational performance effortlessly without investing in expensive software.
🚀 Key Features of Synthetic Fibers KPI Dashboard in Excel
✅ Fully automated KPI monitoring system
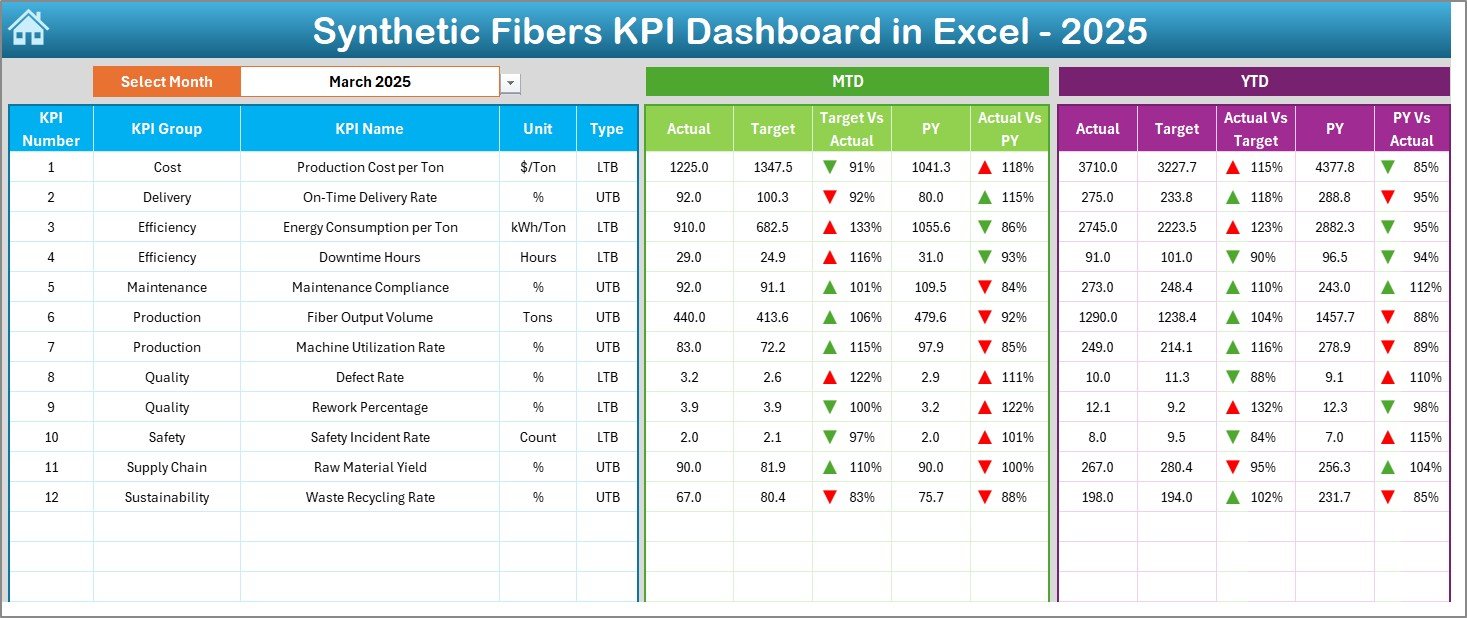
✅ Dynamic monthly selection with auto-updating dashboard
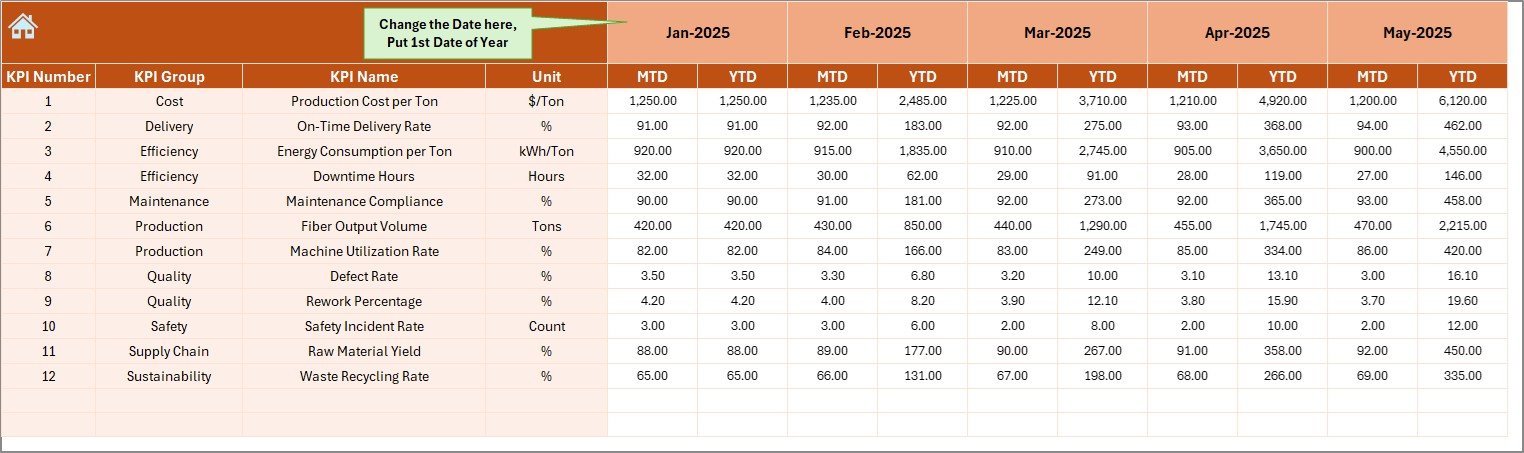
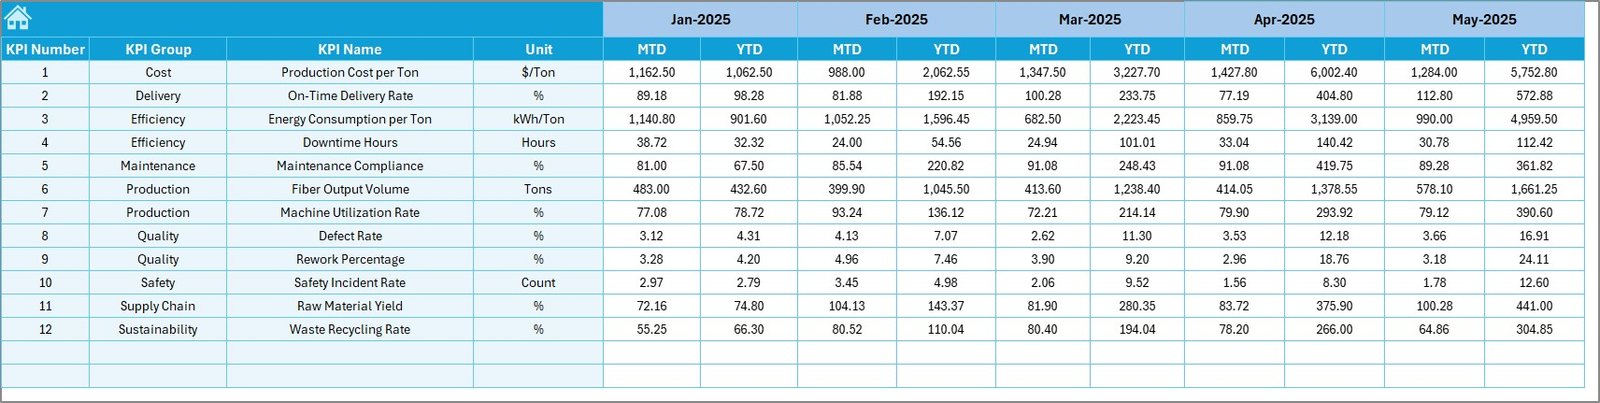
✅ MTD & YTD performance tracking
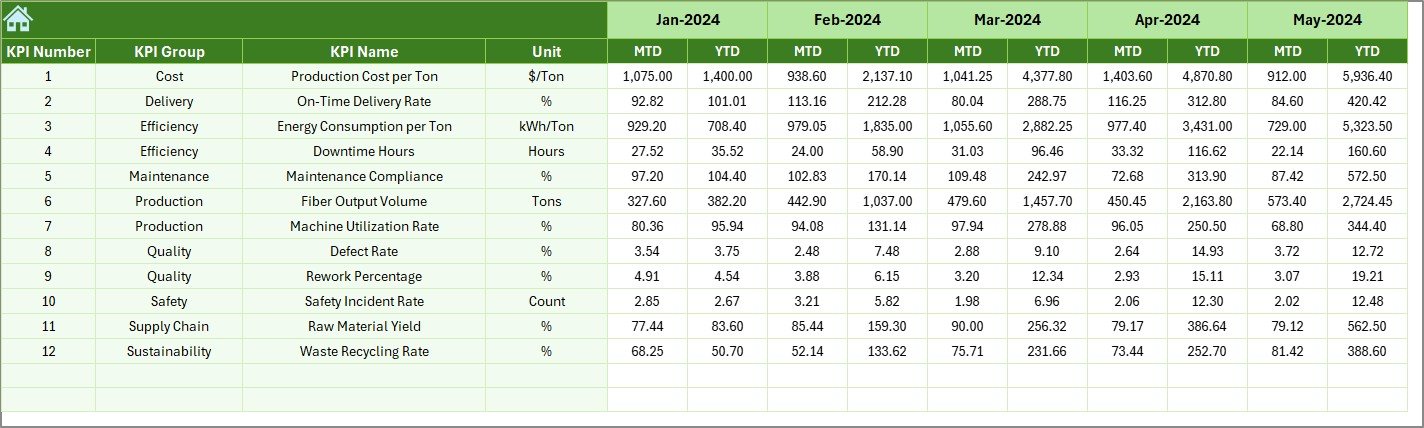
✅ Target vs Actual and Previous Year comparisons
✅ Conditional formatting with performance indicators
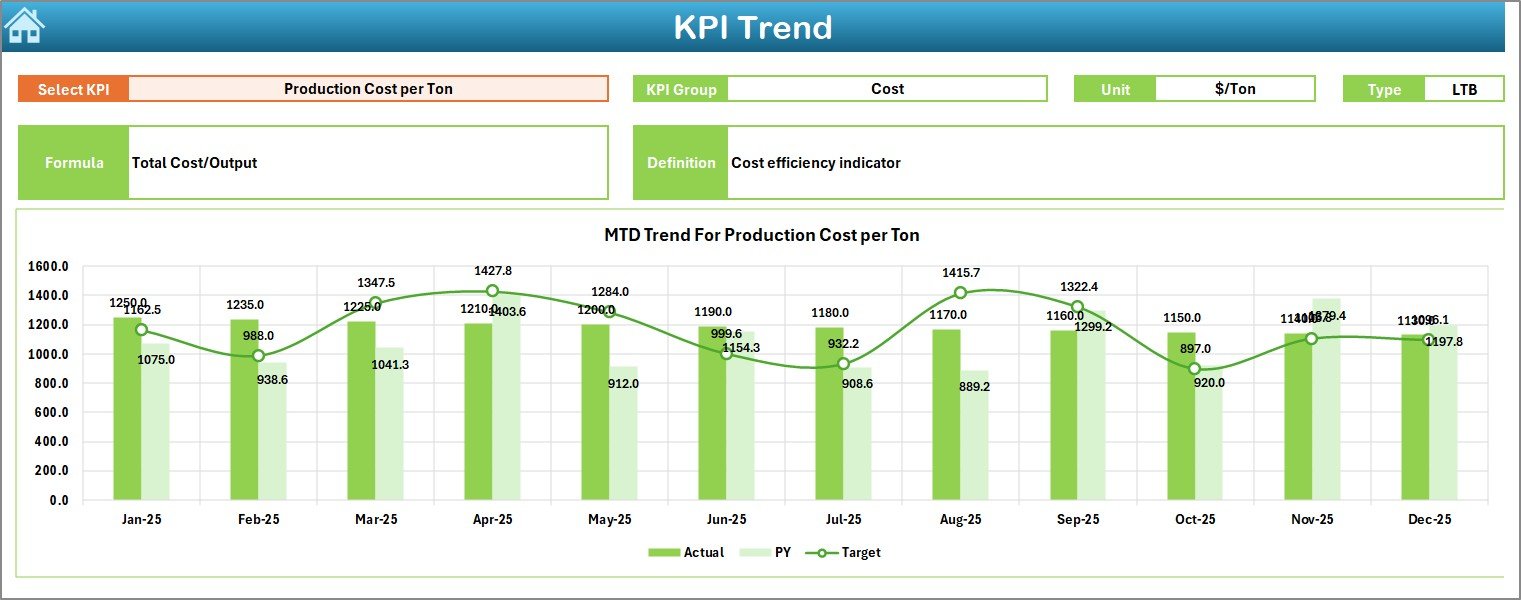
✅ KPI trend analysis with interactive charts
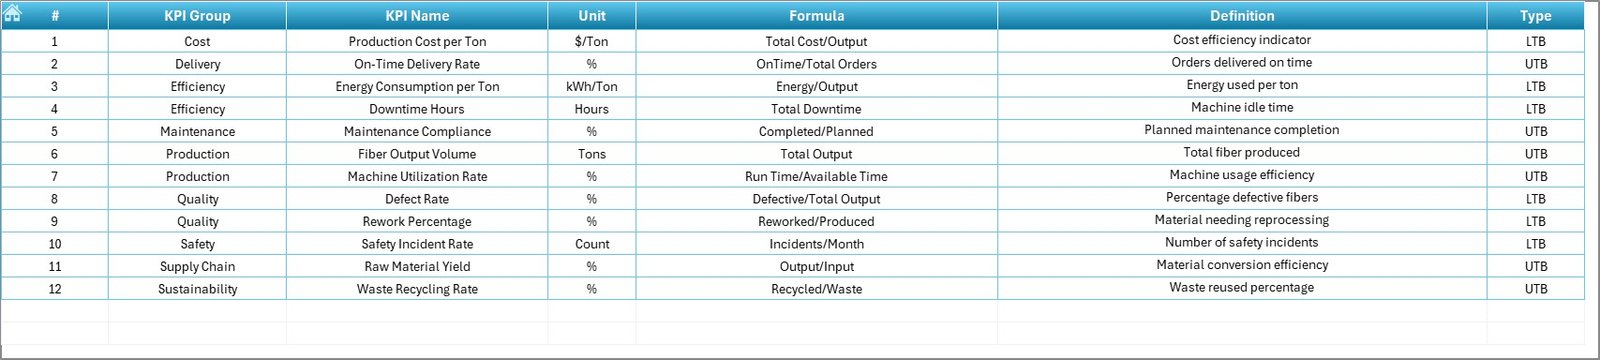
✅ Centralized KPI definition management
✅ Easy data entry structure for quick updates
The dashboard visually highlights performance improvement or decline using smart indicators, helping managers take corrective action instantly.
📦 What’s Inside the Synthetic Fibers KPI Dashboard in Excel
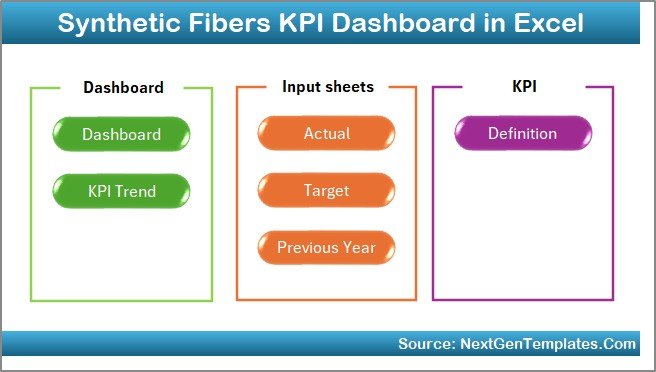
This ready-to-use template includes 7 structured worksheets that together create a complete KPI management system:
🏠 Home Sheet – Navigation hub with quick-access buttons for smooth workflow.
📊 Dashboard Sheet – Main performance overview showing MTD, YTD, targets, and yearly comparisons with visual indicators.
📈 KPI Trend Sheet – Detailed KPI analysis with dropdown selection, trend charts, and performance comparisons.
✍️ Actual Numbers Input Sheet – Centralized data entry section where monthly performance values are entered.
🎯 Target Sheet – Stores planned KPI targets for accurate performance benchmarking.
📅 Previous Year Data Sheet – Enables historical performance comparison and growth analysis.
📘 KPI Definition Sheet – Maintains KPI names, formulas, units, and definitions for consistency.
Together, these sheets provide a structured and professional KPI tracking environment.
⚙️ How to Use the Synthetic Fibers KPI Dashboard in Excel
Using the dashboard is simple and beginner-friendly:
1️⃣ Enter KPI definitions once in the KPI Definition Sheet.
2️⃣ Add monthly targets in the Target Sheet.
3️⃣ Input previous-year performance data.
4️⃣ Update current actual values monthly.
5️⃣ Select the month from the dropdown (Cell D3).
6️⃣ Watch the dashboard update automatically.
No advanced Excel skills are required — automation handles calculations and visual updates instantly.
👥 Who Can Benefit from This Synthetic Fibers KPI Dashboard
This dashboard is ideal for:
✅ Production Managers monitoring efficiency
✅ Plant Heads tracking operational performance
✅ Quality Managers analyzing defect trends
✅ Operations Teams improving productivity
✅ Supply Chain Managers reviewing performance metrics
✅ Manufacturing Consultants & Analysts
Any organization involved in synthetic fiber production can use this dashboard to improve visibility and decision-making.
By converting raw manufacturing data into meaningful visuals, this dashboard helps organizations:
✔ Identify performance gaps faster
✔ Improve production planning
✔ Monitor efficiency trends
✔ Enhance accountability
✔ Support data-driven management
Unlike complex BI tools, this Excel solution remains cost-effective, flexible, and easy to implement.
### Click hare to read the Detailed blog post
Learn the complete working, implementation strategy, and KPI explanation in our detailed article.


