Managing petrochemical operations without clear performance visibility is like running a refinery without instruments. Production efficiency, safety compliance, maintenance reliability, energy consumption, and financial performance must be monitored continuously. However, many organizations still rely on disconnected spreadsheets and manual reporting systems, which slow decision-making and increase operational risks.
That’s exactly why we created the Petrochemicals KPI Dashboard in Excel — a powerful, ready-to-use performance monitoring solution designed to transform raw operational data into actionable insights instantly.
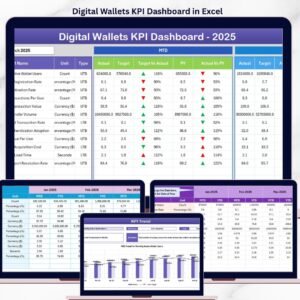
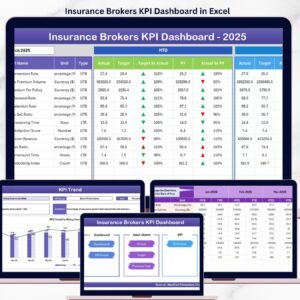
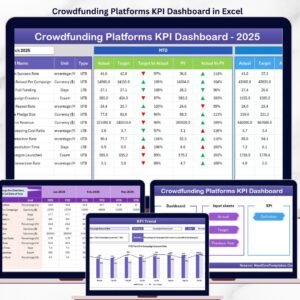
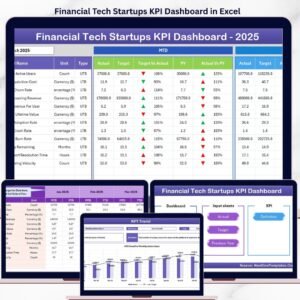
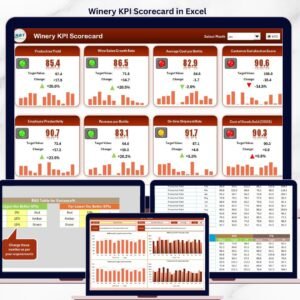
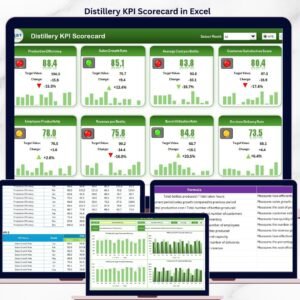
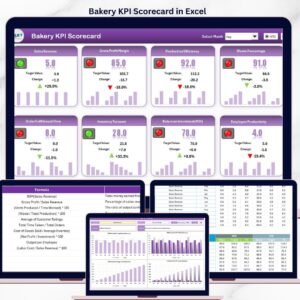
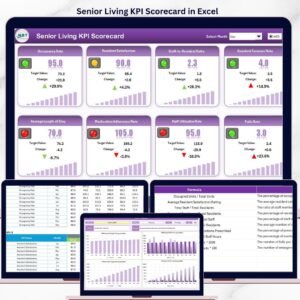
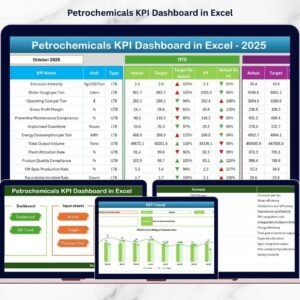
This professionally designed Excel dashboard helps petrochemical companies track KPIs, analyze trends, compare targets, and monitor operational performance from one centralized interface. Instead of spending hours preparing reports, managers can now make faster, data-driven decisions with clarity and confidence.
Whether you manage refinery operations, production planning, maintenance performance, or safety compliance, this dashboard simplifies performance tracking while improving operational transparency.
🚀 Key Features of Petrochemicals KPI Dashboard in Excel
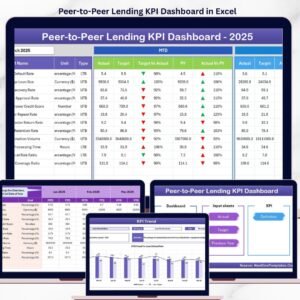
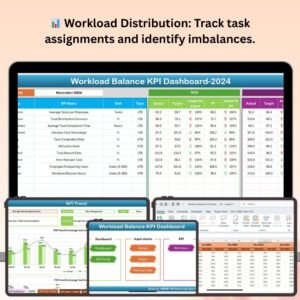
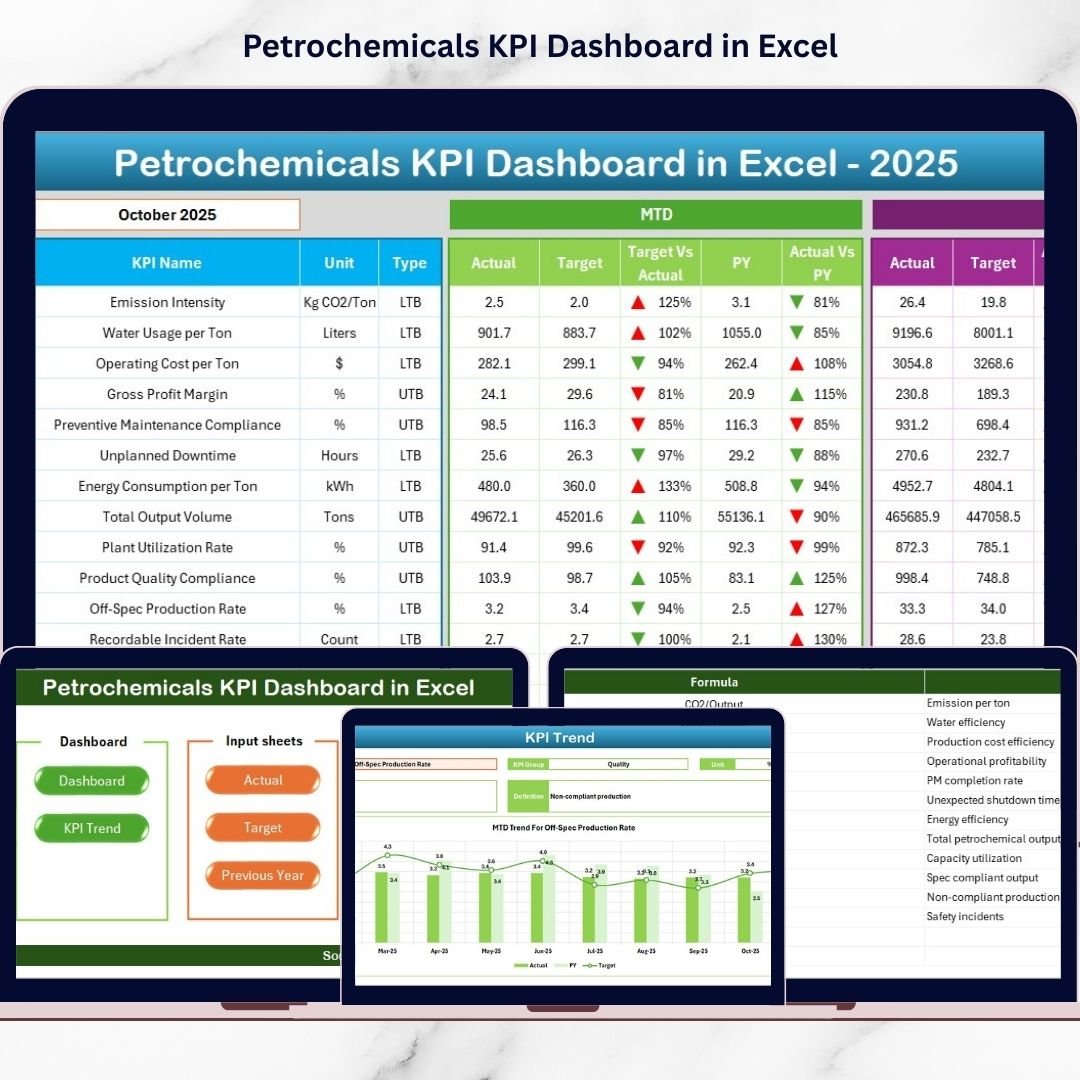
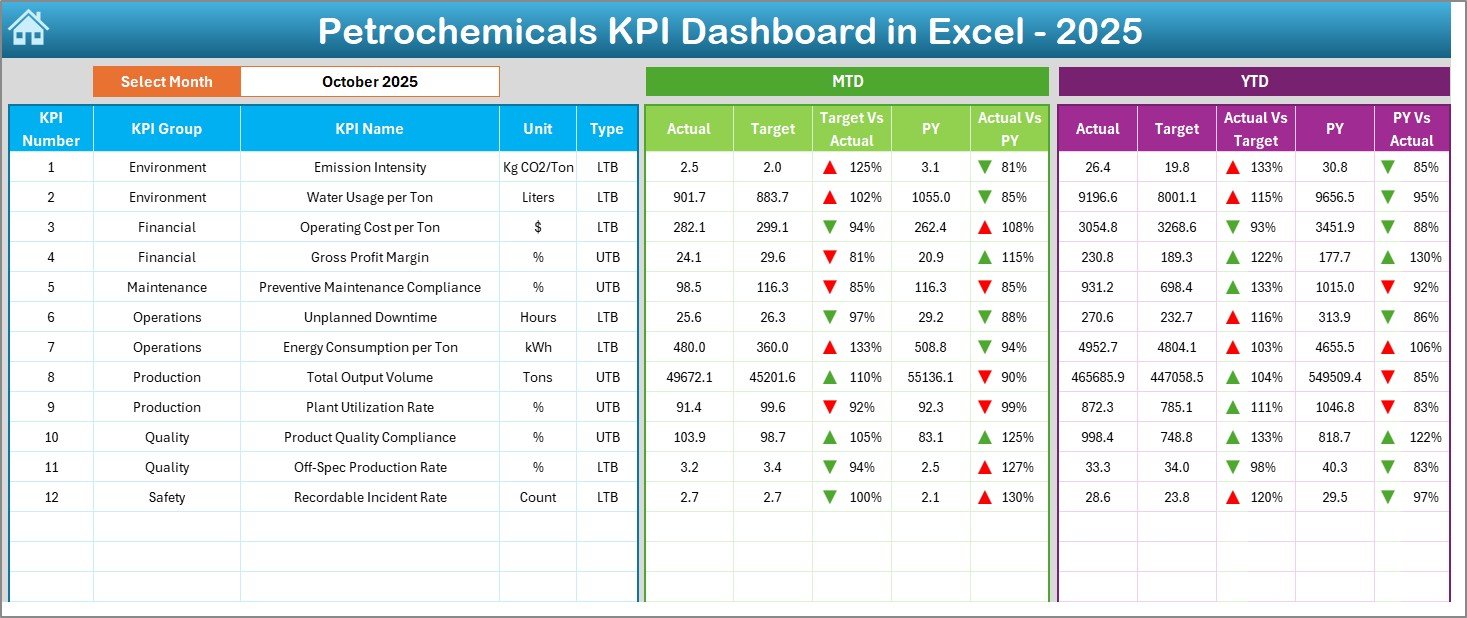
✅ Interactive Monthly Dashboard – Select any month and instantly view updated KPI performance across the entire dashboard.
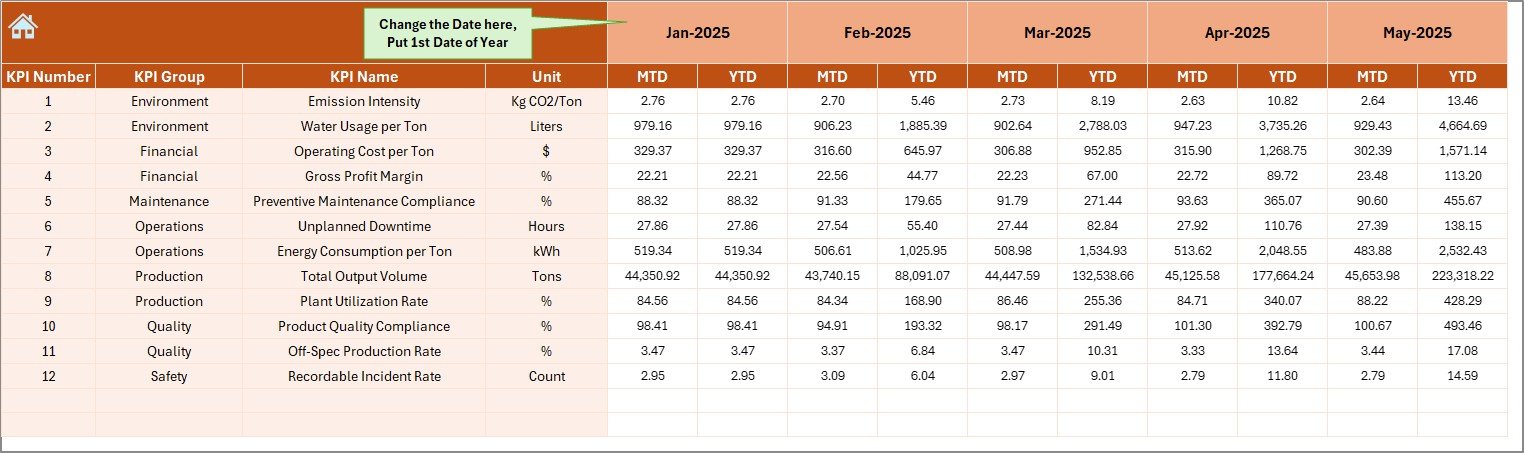
📊 MTD & YTD Performance Tracking – Monitor Month-to-Date and Year-to-Date results with automated calculations.
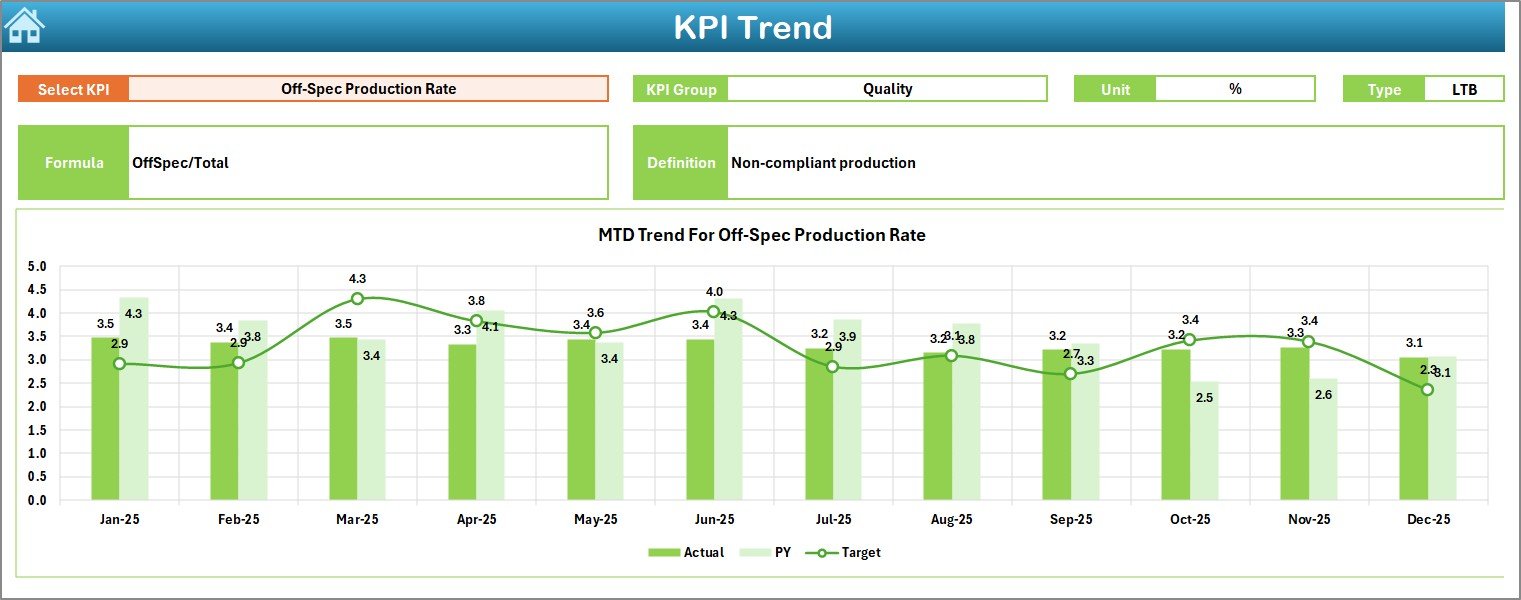
🎯 Target vs Actual Comparison – Quickly identify performance gaps using visual indicators.
📈 Trend Analysis Charts – Analyze KPI performance trends to support forecasting and strategic planning.
⬆️⬇️ Conditional Formatting Indicators – Up and down arrows instantly show improvement or decline.
🧭 Easy Navigation System – Summary page enables one-click access to all dashboard sheets.
📂 Centralized Data Structure – Organized sheets for Actuals, Targets, Historical Data, and KPI Definitions.
⚙️ Fully Excel-Based Solution – No coding or expensive BI tools required.
📦 What’s Inside the Petrochemicals KPI Dashboard in Excel
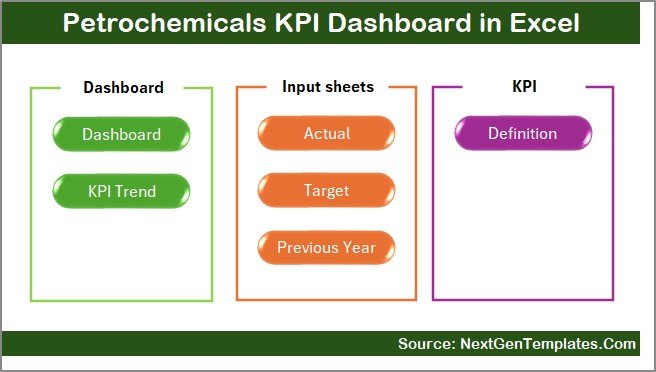
This ready-to-use template includes 7 professionally structured worksheets:
-
Summary Sheet – Dashboard navigation hub for quick access.
-
Dashboard Sheet – Main performance overview with KPI comparisons.
-
KPI Trend Sheet – Detailed KPI analysis with dynamic charts.
-
Actual Numbers Sheet – Structured data entry for operational values.
-
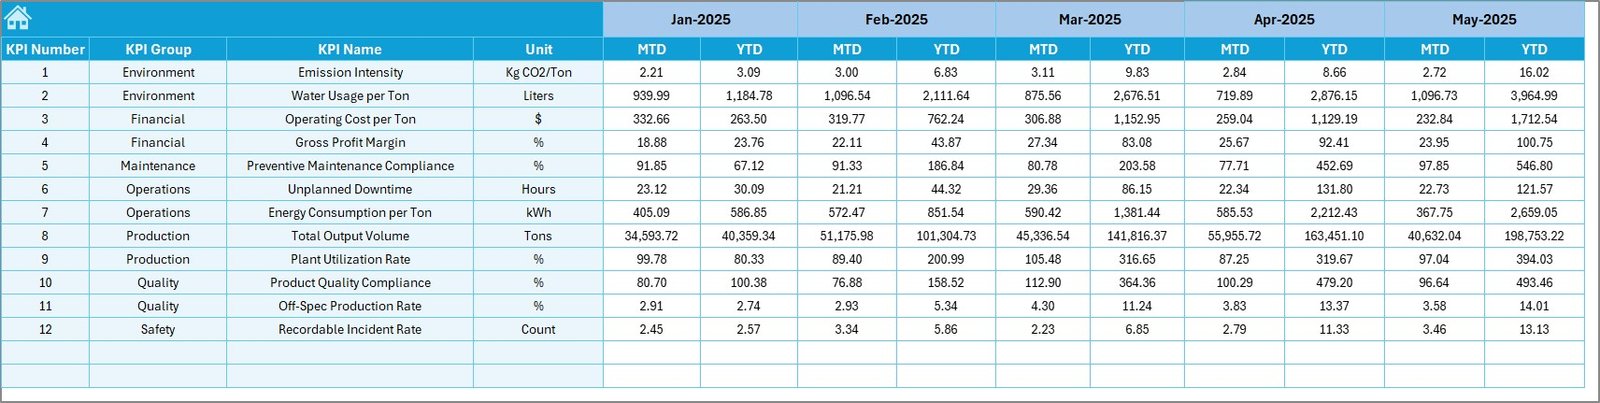
Target Sheet – Monthly performance benchmarks.
-
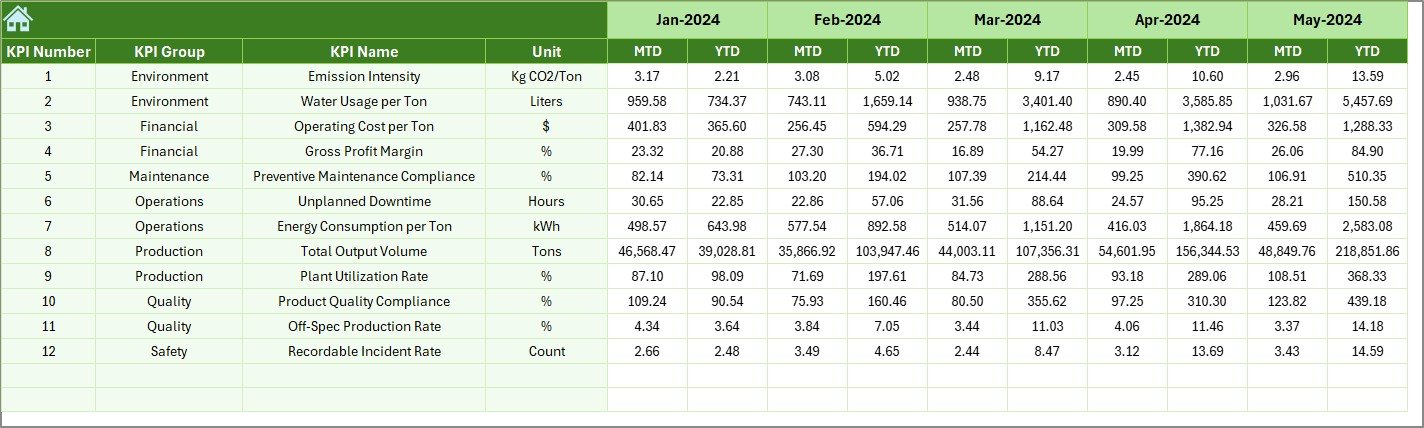
Previous Year Sheet – Historical performance comparison.
-
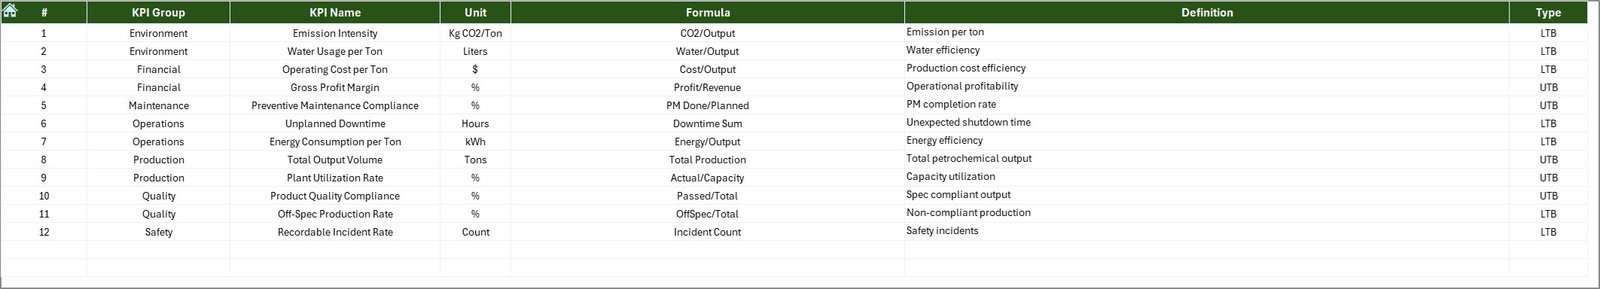
KPI Definition Sheet – KPI master database for standardized reporting.
Each worksheet works together to create a complete performance management ecosystem.
🛠️ How to Use the Petrochemicals KPI Dashboard in Excel
Using this dashboard is simple and beginner-friendly:
1️⃣ Define KPIs in the KPI Definition sheet.
2️⃣ Enter monthly targets for performance benchmarking.
3️⃣ Add actual operational values in the input sheet.
4️⃣ Input previous year data for comparisons.
5️⃣ Select a month from the dropdown menu.
6️⃣ Instantly analyze performance insights on the dashboard.
Because calculations and visuals update automatically, reporting becomes fast and error-free.
👥 Who Can Benefit from This Petrochemicals KPI Dashboard in Excel
This dashboard is ideal for professionals across petrochemical organizations:
🏭 Plant Managers monitoring production efficiency
⚙️ Operations Managers improving plant performance
🔧 Maintenance Teams tracking equipment reliability
🦺 Safety Officers analyzing compliance KPIs
💰 Finance Analysts evaluating operational costs
📊 Senior Executives making strategic decisions
From operational teams to leadership, everyone gains clear performance visibility.
Implementing this dashboard helps organizations eliminate manual reporting, standardize KPI tracking, and improve operational efficiency through structured analytics. With centralized monitoring and automated insights, teams respond faster to performance issues and maintain continuous improvement.
If your organization wants to reduce downtime, improve productivity, and strengthen data-driven decision-making, this dashboard provides the perfect starting point — without complex software or heavy investment.
Click here to read the Detailed blog post
Watch the step-by-step video tutorial: