Running a textile dyeing and finishing unit without clear performance tracking is like operating machinery without gauges. Small inefficiencies in dyeing quality, production efficiency, chemical usage, or delivery timelines can quickly increase operational costs and reduce customer satisfaction. That’s why modern textile manufacturers are shifting toward data-driven performance monitoring.
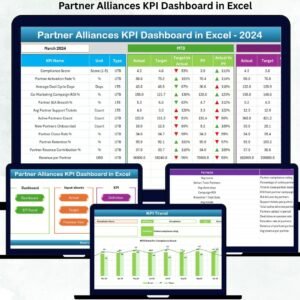
The Textile Dyeing and Finishing KPI Dashboard in Excel is a powerful, ready-to-use analytical solution designed specifically for textile processing operations. Instead of managing multiple spreadsheets or manual reports, this dashboard converts complex operational data into clear visual insights that help managers make faster and smarter decisions.
Built entirely in Microsoft Excel, this dashboard allows textile factories to monitor KPIs, compare targets with actual performance, analyze historical trends, and identify improvement opportunities — all within a familiar and easy-to-use environment.
Whether you manage dyeing production, quality control, or operational planning, this dashboard provides complete visibility into performance without requiring expensive ERP or BI software.
✅ Key Feature of Textile Dyeing and Finishing KPI Dashboard in Excel
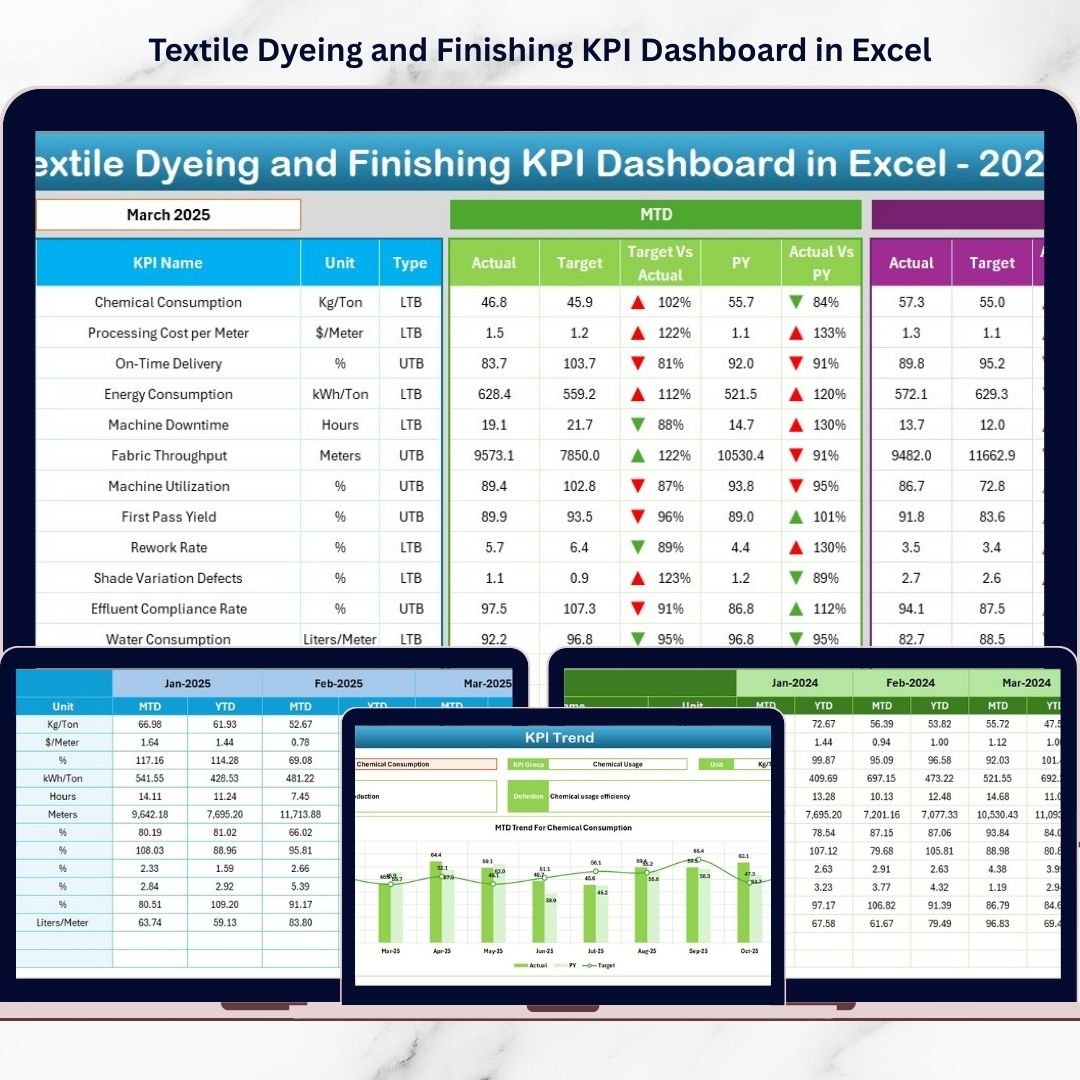
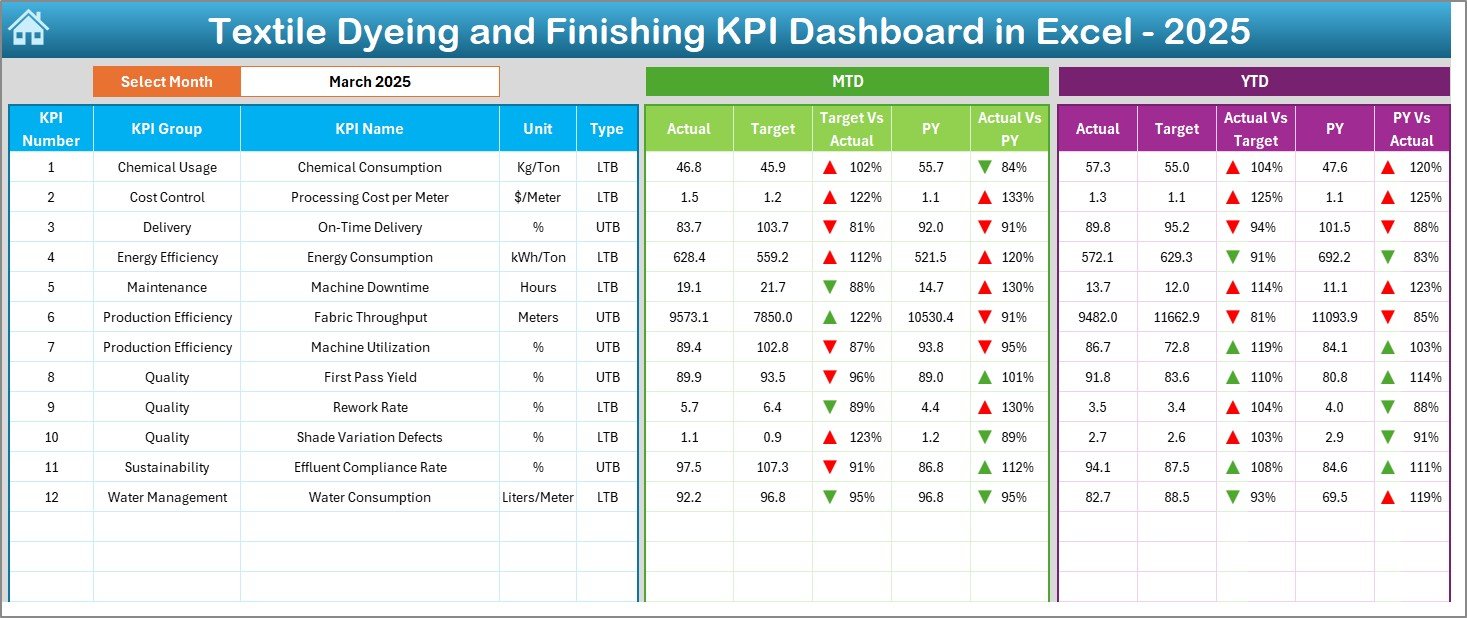
📊 Dynamic KPI Monitoring – Track production, quality, cost, and efficiency KPIs in one centralized dashboard.
📅 Automatic Month Selection – Select a month and instantly update all charts, KPIs, and comparisons automatically.
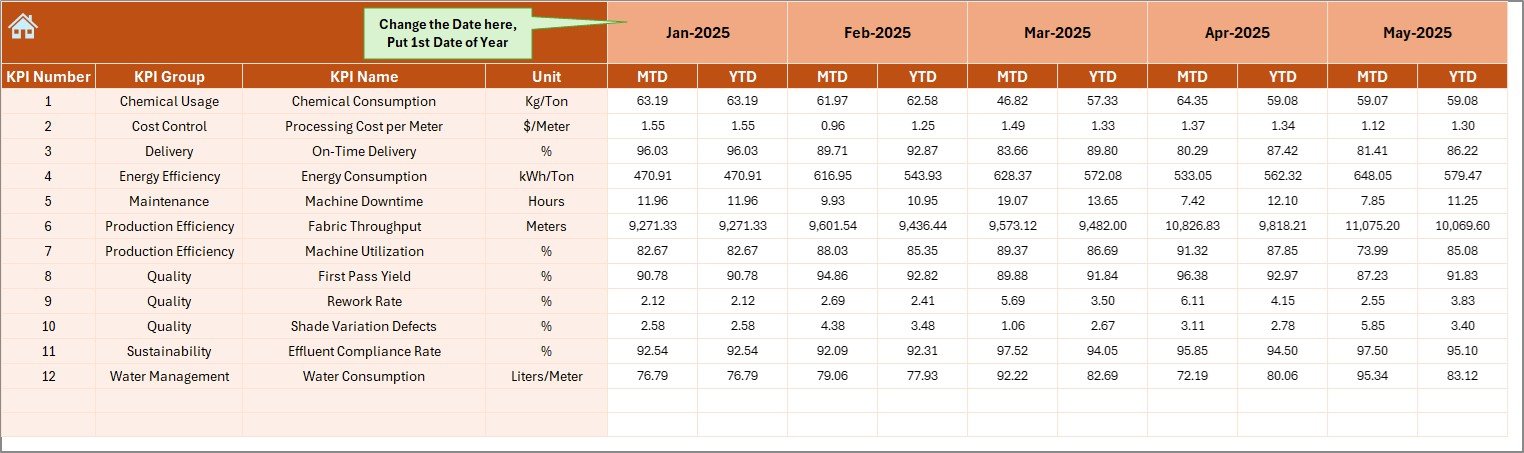
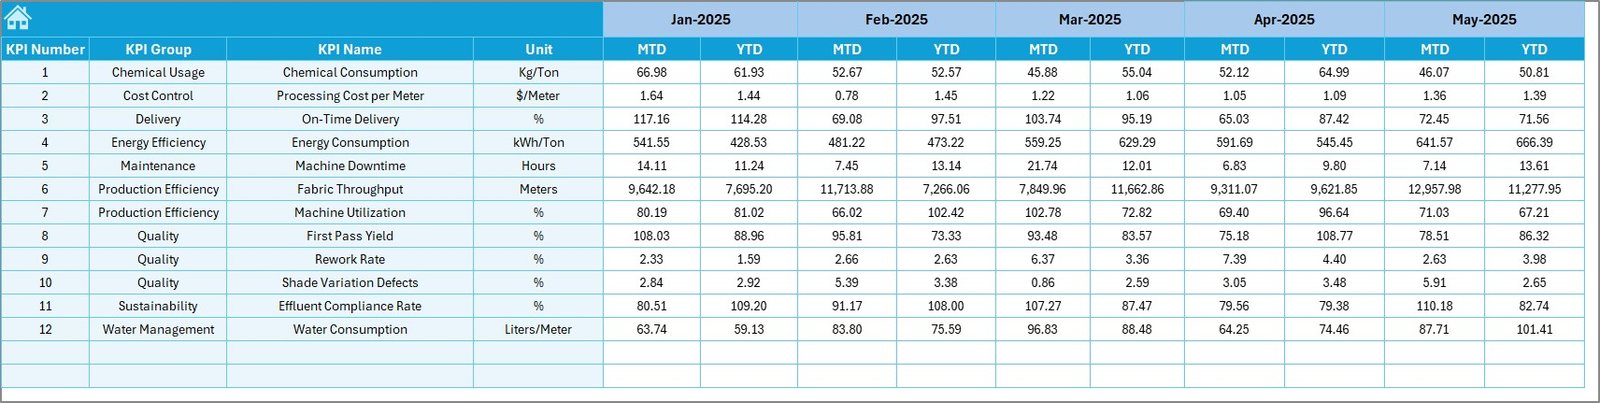
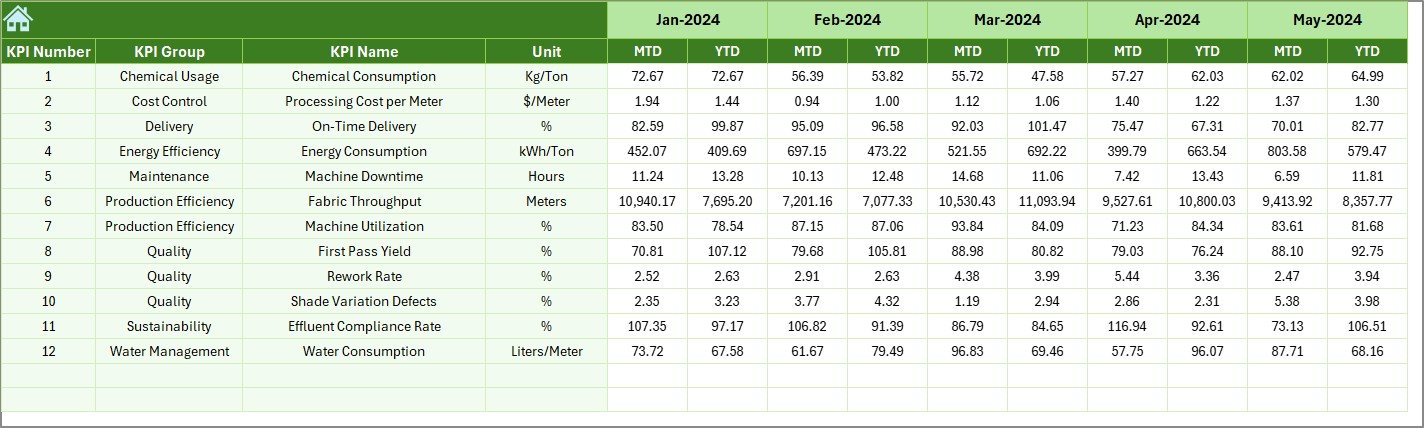
📈 MTD & YTD Performance Analysis – Monitor Month-to-Date and Year-to-Date results against targets and previous year benchmarks.
🎯 Target vs Actual Comparison – Instantly identify performance gaps using visual indicators and trend arrows.
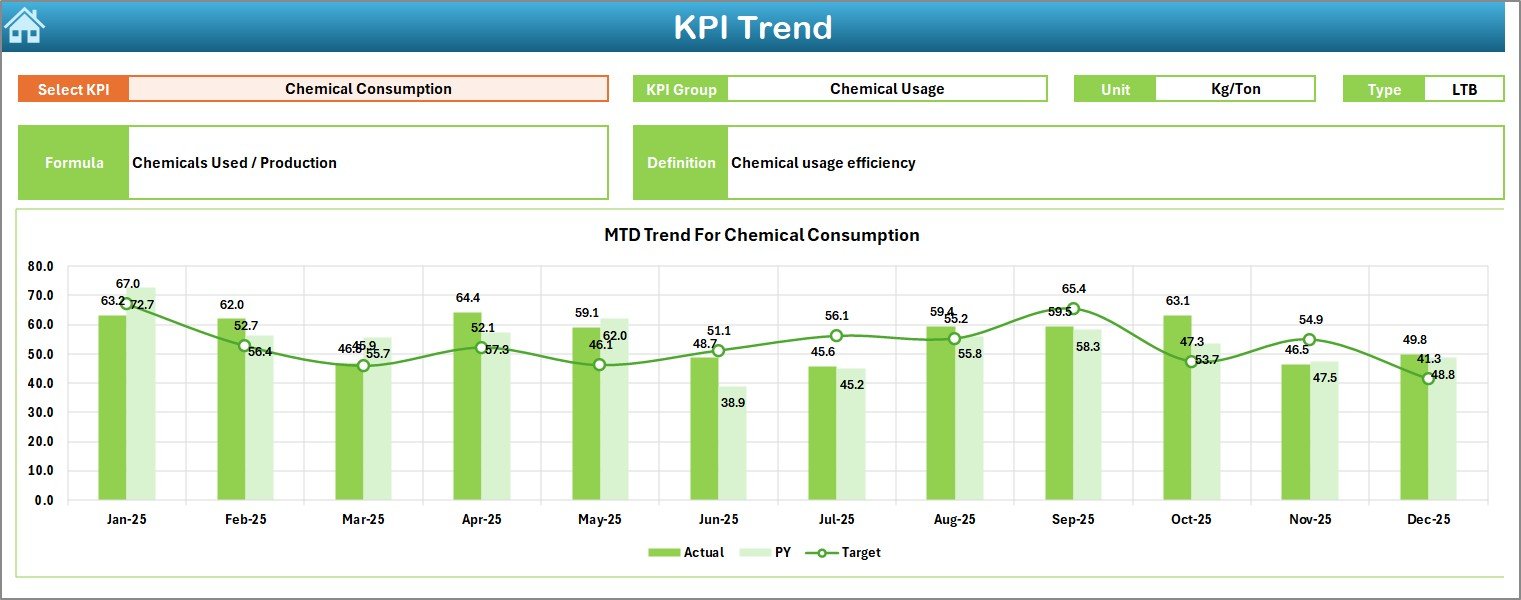
📉 KPI Trend Analysis – Analyze long-term KPI behavior with dynamic trend charts.
🧾 Centralized Data Entry System – Reduce reporting errors through structured input sheets.
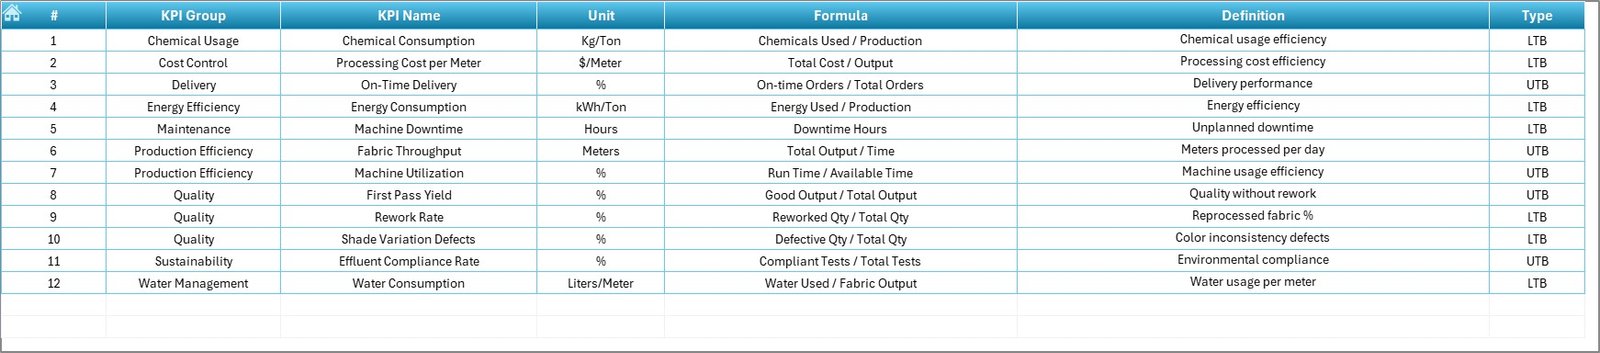
📚 KPI Definition Documentation – Maintain consistent KPI understanding across teams.
🚀 User-Friendly Navigation – Home page buttons provide smooth movement across dashboard pages.
📦 What’s Inside the Textile Dyeing and Finishing KPI Dashboard in Excel
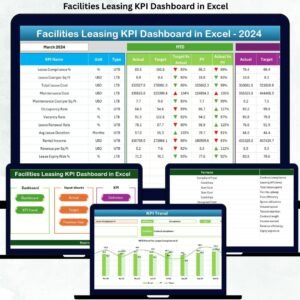
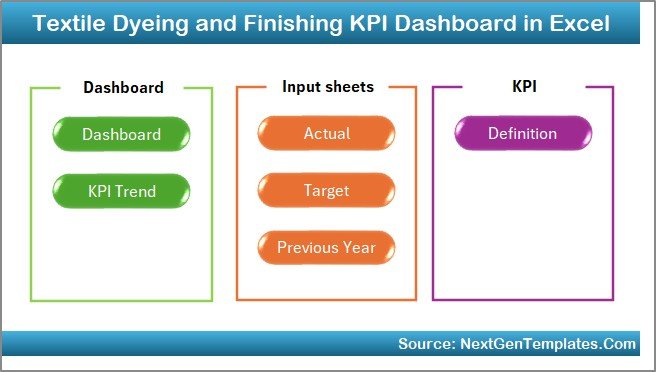
This professional dashboard includes 7 structured worksheets designed for complete performance management:
-
🏠 Home Sheet – Navigation hub with quick-access buttons.
-
📊 Dashboard Sheet – Central KPI overview with automated calculations.
-
📈 KPI Trend Sheet – Individual KPI analysis with trend visualization.
-
✍️ Actual Numbers Input Sheet – Centralized operational data entry.
-
🎯 Target Sheet – Monthly and yearly performance planning.
-
📅 Previous Year Sheet – Historical benchmarking for comparisons.
-
📘 KPI Definition Sheet – KPI formulas, units, and descriptions.
Together, these sheets create a structured monitoring ecosystem that simplifies textile performance management.
⚙️ How to Use the Textile Dyeing and Finishing KPI Dashboard
Using the dashboard requires no advanced technical skills.
1️⃣ Enter operational data in the Actual Numbers Input Sheet.
2️⃣ Define targets in the Target Sheet.
3️⃣ Store historical data in the Previous Year Sheet.
4️⃣ Select the desired month from the dashboard dropdown.
5️⃣ Instantly review KPI performance, trends, and comparisons.
Once data is entered, Excel formulas automatically update visuals and performance indicators, saving hours of manual reporting work.
👥 Who Can Benefit from This Textile Dyeing and Finishing KPI Dashboard
This dashboard is ideal for:
🏭 Textile Factory Owners monitoring profitability
👨🏭 Production Managers improving efficiency
🎨 Dyeing Supervisors controlling process quality
✅ Quality Control Teams reducing defects
📊 Operations Analysts analyzing performance trends
⚙️ Industrial Engineers optimizing resource usage
Because the system runs in Excel, both small and large textile units can implement advanced analytics quickly.
By transforming raw operational numbers into actionable insights, this dashboard helps organizations reduce waste, improve quality consistency, optimize resources, and achieve better production outcomes. Instead of relying on assumptions, managers gain clarity through structured KPI tracking — leading to smarter decisions and stronger profitability.
## Click here to read the Detailed blog post
Visit our YouTube channel to learn step-by-step video tutorials:
👉 https://youtube.com/@PKAnExcelExpert