Running a printing business without clear visibility into costs, delivery performance, and profitability is risky. Deadlines are tight. Margins are thin. Client expectations are high. And one unnoticed cost spike can silently reduce your profits.
What if you could monitor revenue, printing cost, profit margin, delivery performance, client segmentation, product performance, and technology efficiency — all in one powerful Excel dashboard?
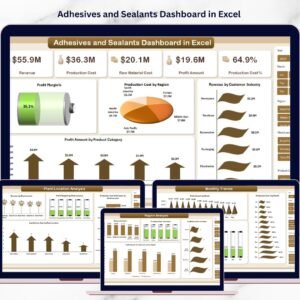
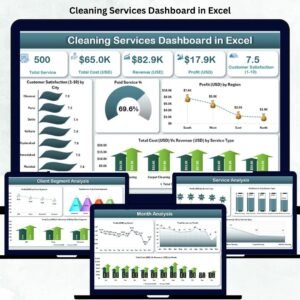
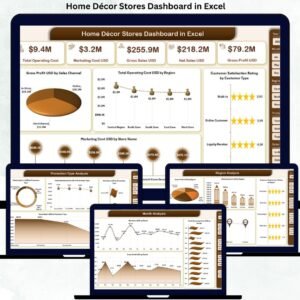
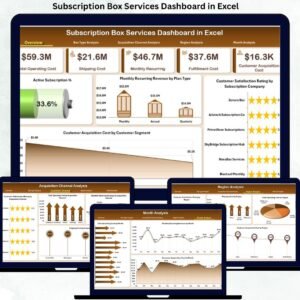
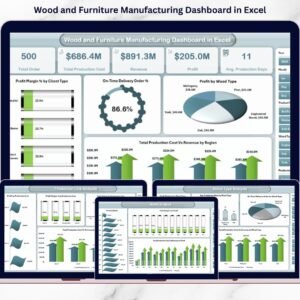
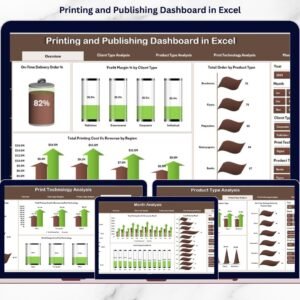
Introducing the Printing and Publishing Dashboard in Excel — a ready-to-use, interactive business intelligence solution designed specifically for printing and publishing companies.
This dashboard transforms raw operational data into meaningful visual insights. Instead of juggling multiple spreadsheets, you can manage your entire performance system from one structured Excel file using dynamic slicers, KPI cards, and pivot charts.
No complicated setup. No expensive software. Just smart, structured reporting.
🚀 Key Feature of Printing and Publishing Dashboard in Excel
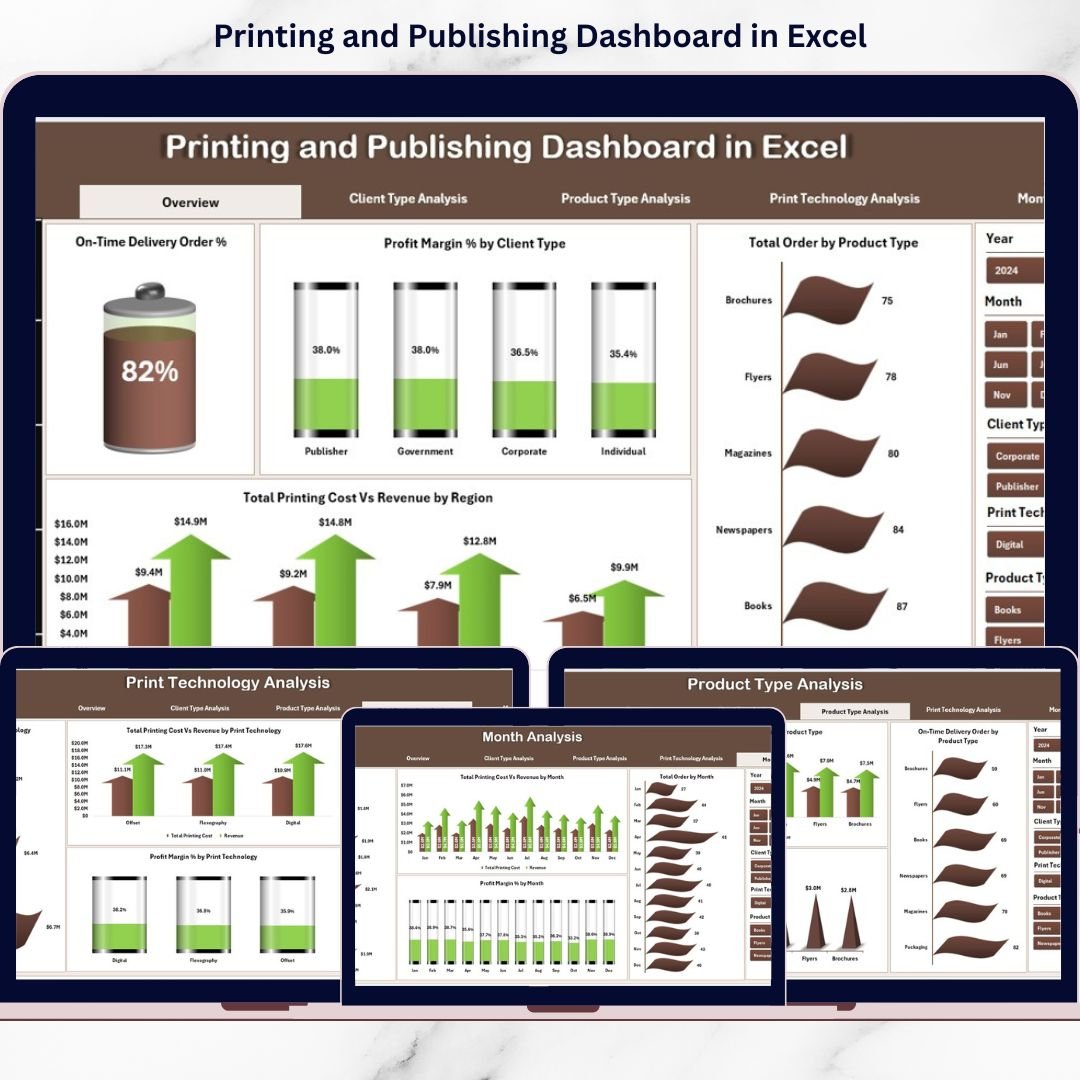
📊 5 Fully Interactive Analytical Pages – Overview, Client Type, Product Type, Print Technology, and Month Analysis.
🎯 Powerful KPI Cards – Track Total Orders, Total Revenue, Total Printing Cost, and Profit Margin % instantly.
📈 Dynamic Slicers – Filter data by Client Type, Product Type, Region, and more in seconds.
💰 Cost vs Revenue Comparison – Identify profit leaks and high-performing segments clearly.
🚚 On-Time Delivery Tracking – Monitor delivery performance and client satisfaction.
⚙️ Print Technology Analysis – Measure ROI and efficiency by printing method.
📆 Monthly Trend Analysis – Understand seasonal demand and forecast smarter.
📦 What’s Inside the Printing and Publishing Dashboard in Excel
This structured Excel file includes:
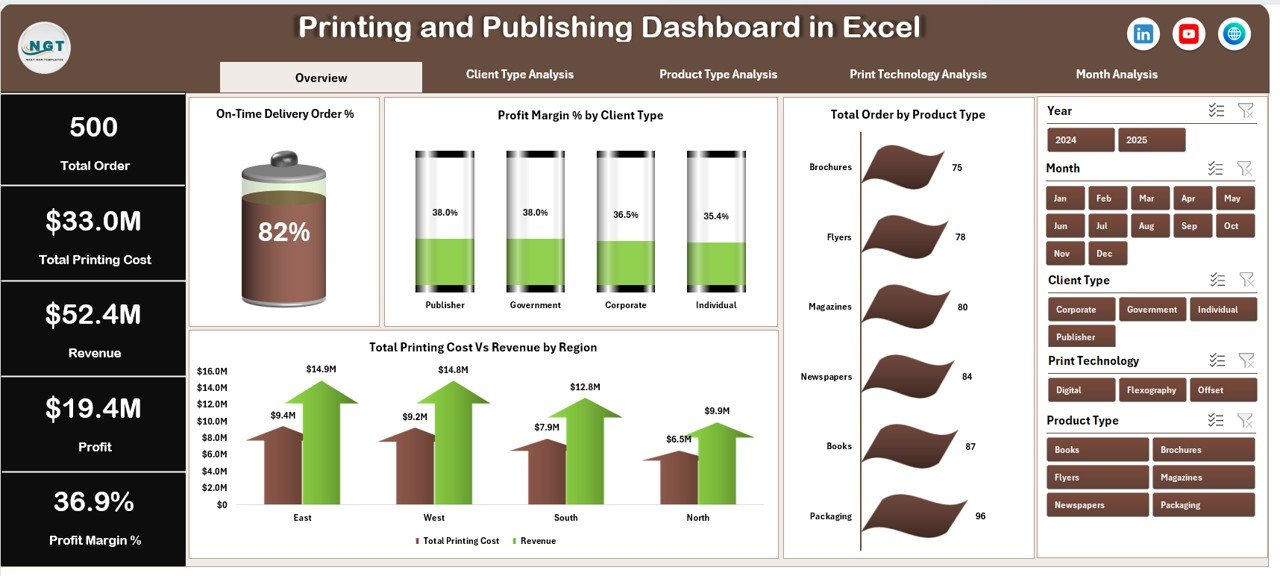
1️⃣ Overview Page – Business Snapshot
-
4 KPI Cards:
-
Total Orders
-
Total Revenue
-
Total Printing Cost
-
Profit Margin %
-
-
4 Dynamic Charts:
-
On-Time Delivery %
-
Profit Margin by Client Type
-
Total Orders by Product Type
-
Printing Cost vs Revenue by Region
-
This page gives management an instant health check of the business.
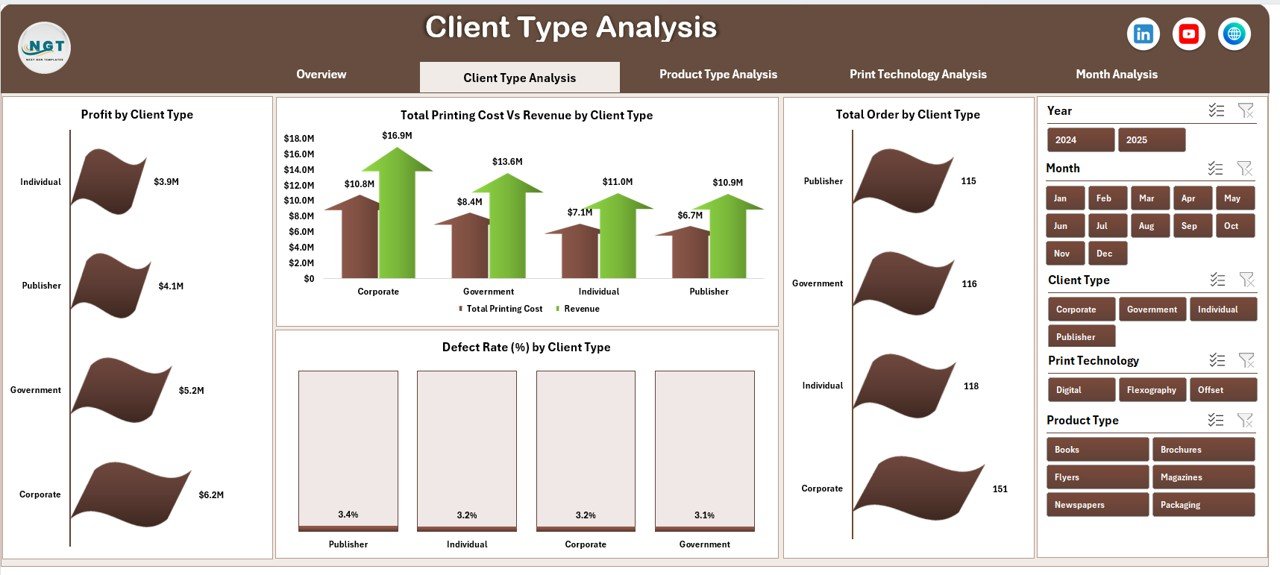
2️⃣ Client Type Analysis
-
Profit by Client Type
-
Total Orders by Client Type
-
Cost vs Revenue by Client Type
-
Defect Rate % by Client Type
Identify profitable segments and optimize pricing strategies.
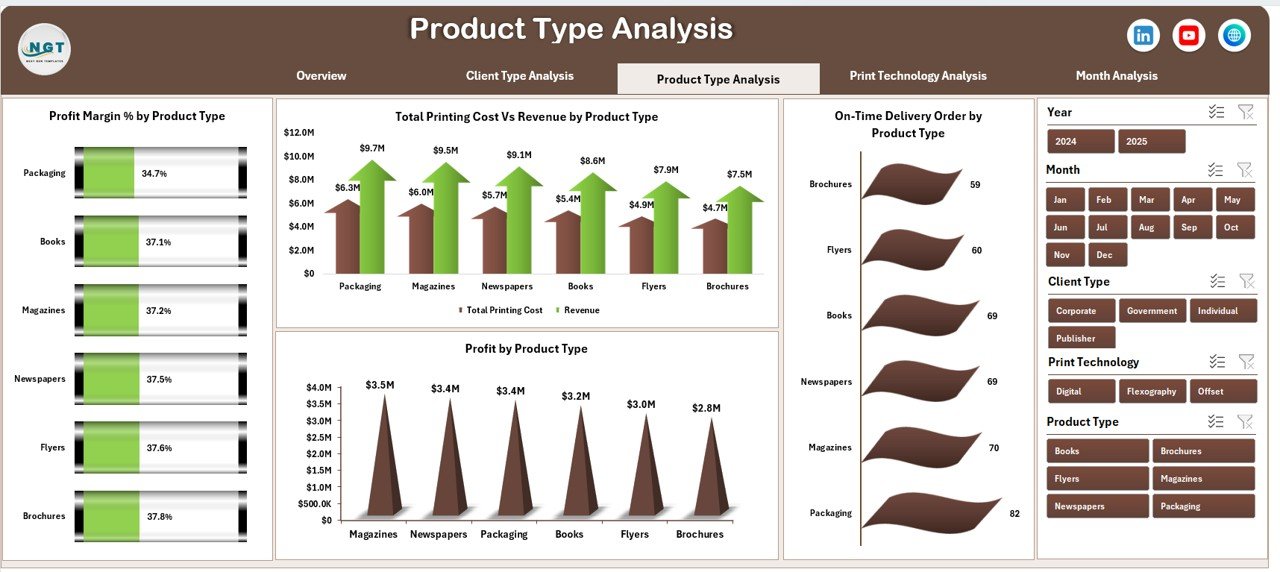
3️⃣ Product Type Analysis
-
Profit by Product Type
-
On-Time Delivery % by Product Type
-
Cost vs Revenue by Product Type
-
Profit Margin % by Product Type
Focus on high-margin products and eliminate low-performing categories.
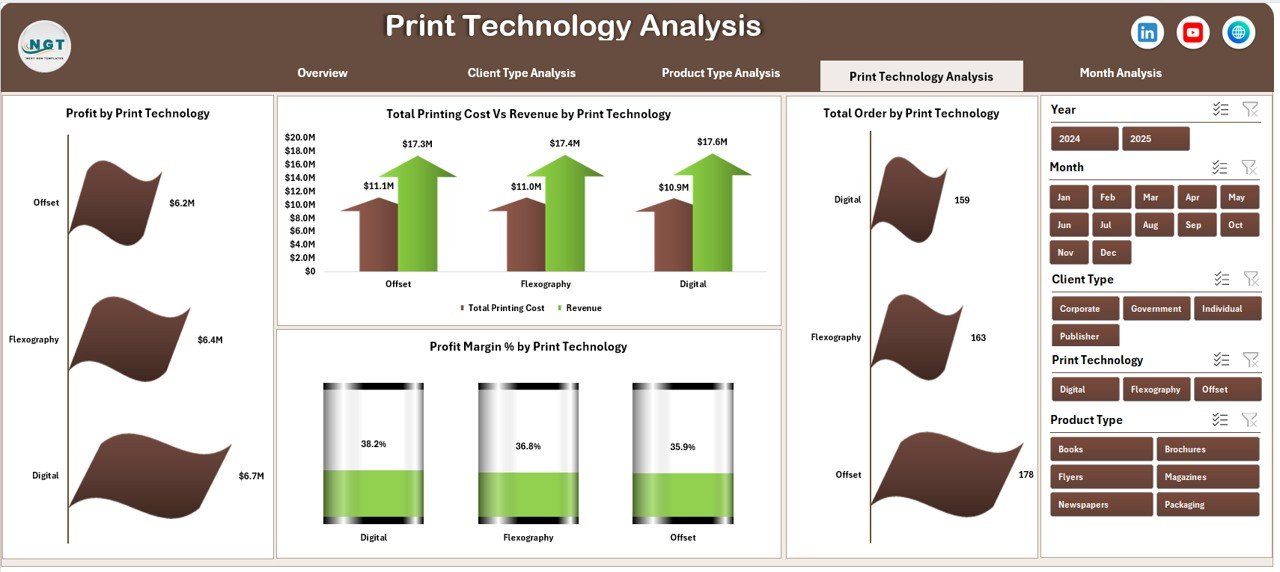
4️⃣ Print Technology Analysis
-
Profit by Print Technology
-
Total Orders by Technology
-
Cost vs Revenue by Technology
-
Profit Margin % by Technology
Make smarter machine investment and utilization decisions.
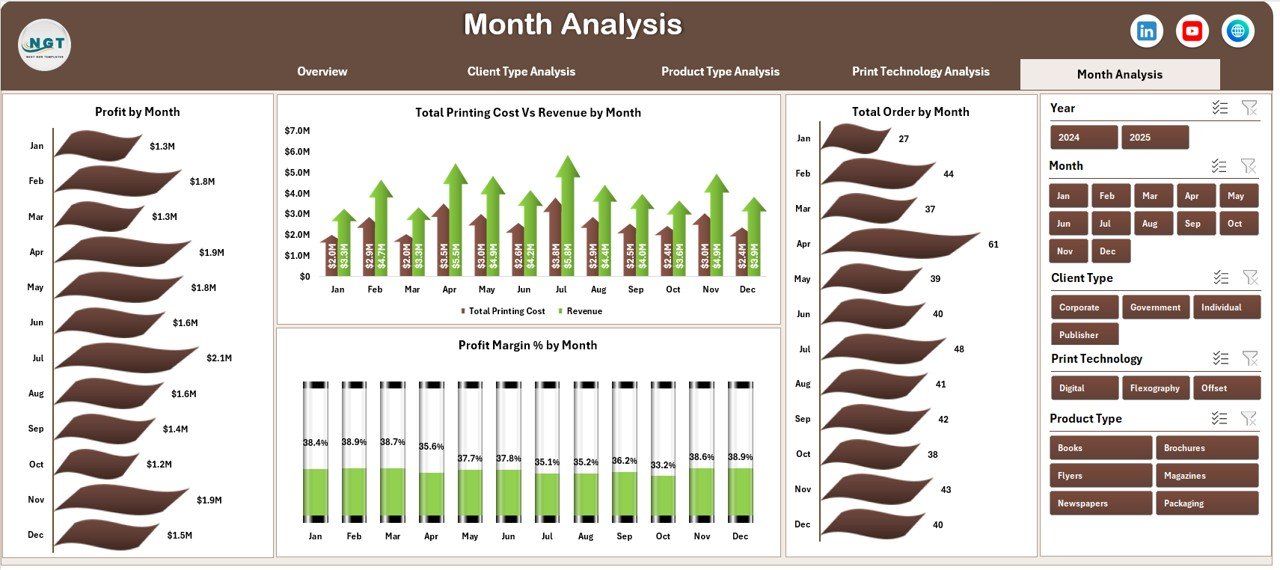
5️⃣ Month Analysis
-
Profit by Month
-
Orders by Month
-
Cost vs Revenue by Month
-
Profit Margin % by Month
Prepare for seasonal demand and improve forecasting accuracy.
🛠 How to Use the Printing and Publishing Dashboard in Excel
Using the dashboard is simple:
1️⃣ Enter order data into the structured Data Sheet.
2️⃣ Maintain consistent product, client, and technology names.
3️⃣ Refresh pivot tables (if required).
4️⃣ Use slicers to filter by region, client type, product type, or month.
5️⃣ Analyze KPI cards and charts for decision-making.
Because the backend support sheet handles calculations automatically, reporting remains fast and error-free.
👥 Who Can Benefit from This Printing and Publishing Dashboard in Excel
✔ Printing Company Owners
✔ Publishing Houses
✔ Commercial Print Shops
✔ Packaging Printing Companies
✔ Operations Managers
✔ Finance Managers
✔ Production Supervisors
Whether you run a small print shop or a multi-location printing company, this dashboard provides structured visibility into your operations.
Why This Dashboard Can Transform Your Printing Business
Instead of guessing which clients generate profits, you see it clearly.
Instead of manually calculating margins, you compare cost vs revenue instantly.
Instead of reacting to declining delivery performance, you monitor trends proactively.
From books and magazines to packaging and brochures — every product category becomes measurable. Every technology investment becomes accountable. Every client segment becomes analyzable.
If you want to increase profit margins, reduce waste, improve delivery performance, and make faster data-driven decisions, this dashboard becomes your competitive advantage.
Click here to read the Detailed blog post
Visit our YouTube channel to learn step-by-step video tutorials
👉 YouTube Channel – PKAnExcelExpert