Innovation labs are the engines of growth in modern organizations. They experiment with bold ideas, develop prototypes, test emerging technologies, and convert concepts into real business value. However, when innovation is not measured properly, progress becomes unclear and decision-making turns into guesswork.
That is exactly where the Innovation Labs KPI Dashboard in Excel delivers powerful value.
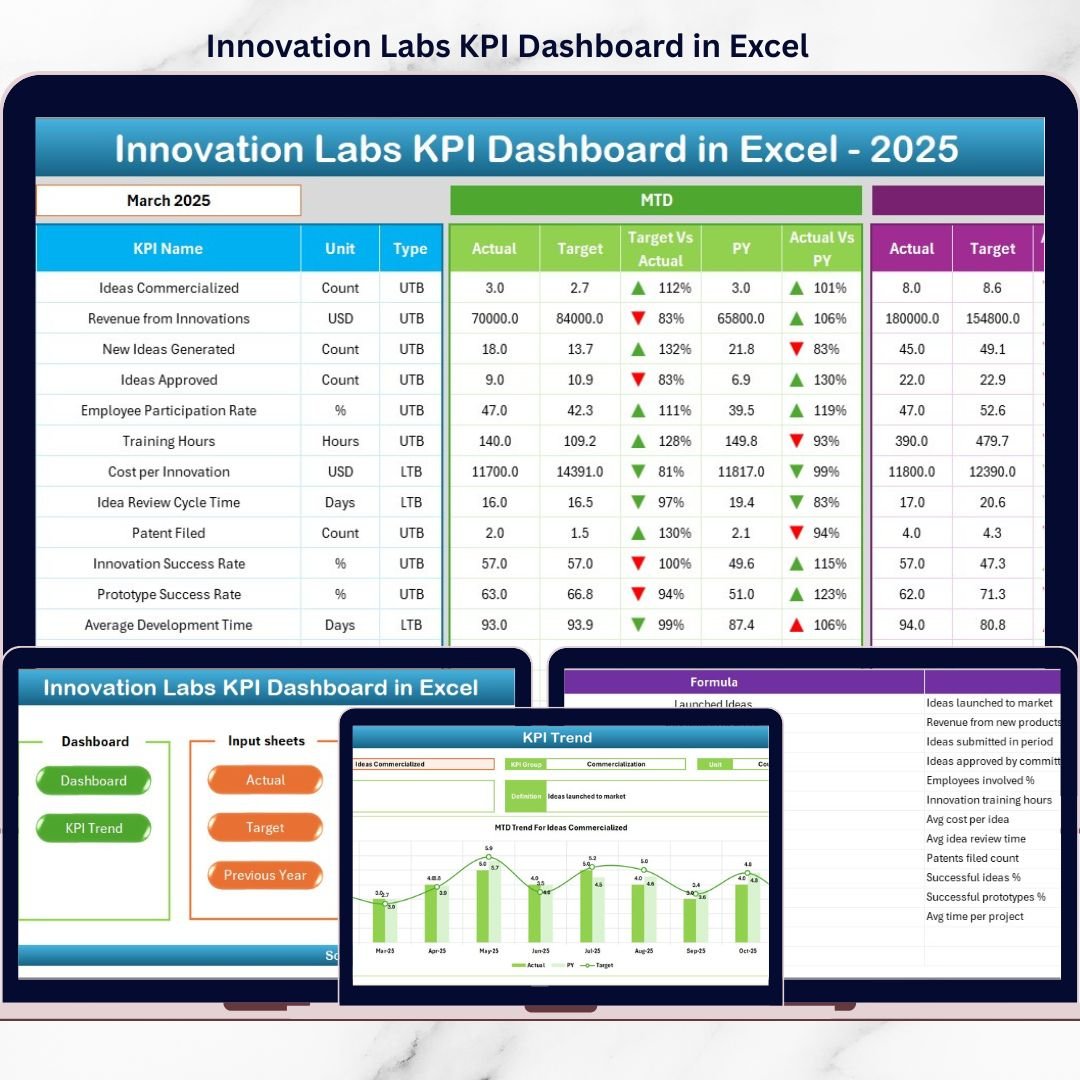
This ready-to-use Excel dashboard helps innovation teams track performance, monitor progress, and align innovation initiatives with strategic business goals. Instead of juggling multiple spreadsheets or manual reports, this dashboard brings all innovation KPIs into one structured, automated, and easy-to-use Excel file.
Designed for innovation managers, R&D leaders, and executives, this dashboard transforms innovation tracking from intuition-driven to data-driven—without complexity or expensive BI tools.
## Key Features of Innovation Labs KPI Dashboard in Excel 🚀
✨ Centralized Innovation KPI Tracking
Track all innovation-related KPIs in one professional Excel dashboard.
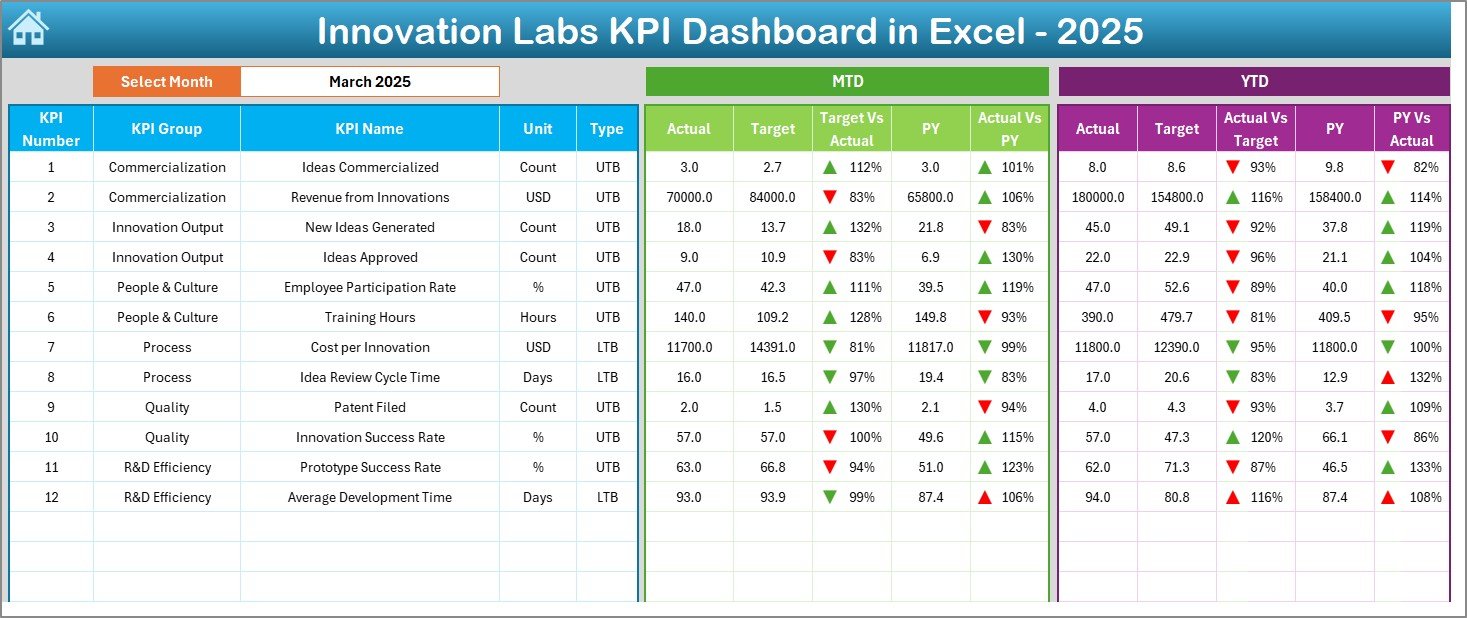
📊 MTD & YTD Performance Monitoring
View Month-to-Date and Year-to-Date actuals, targets, and previous-year values instantly.
🎯 Target vs Actual Analysis
Identify performance gaps quickly and take corrective action with confidence.
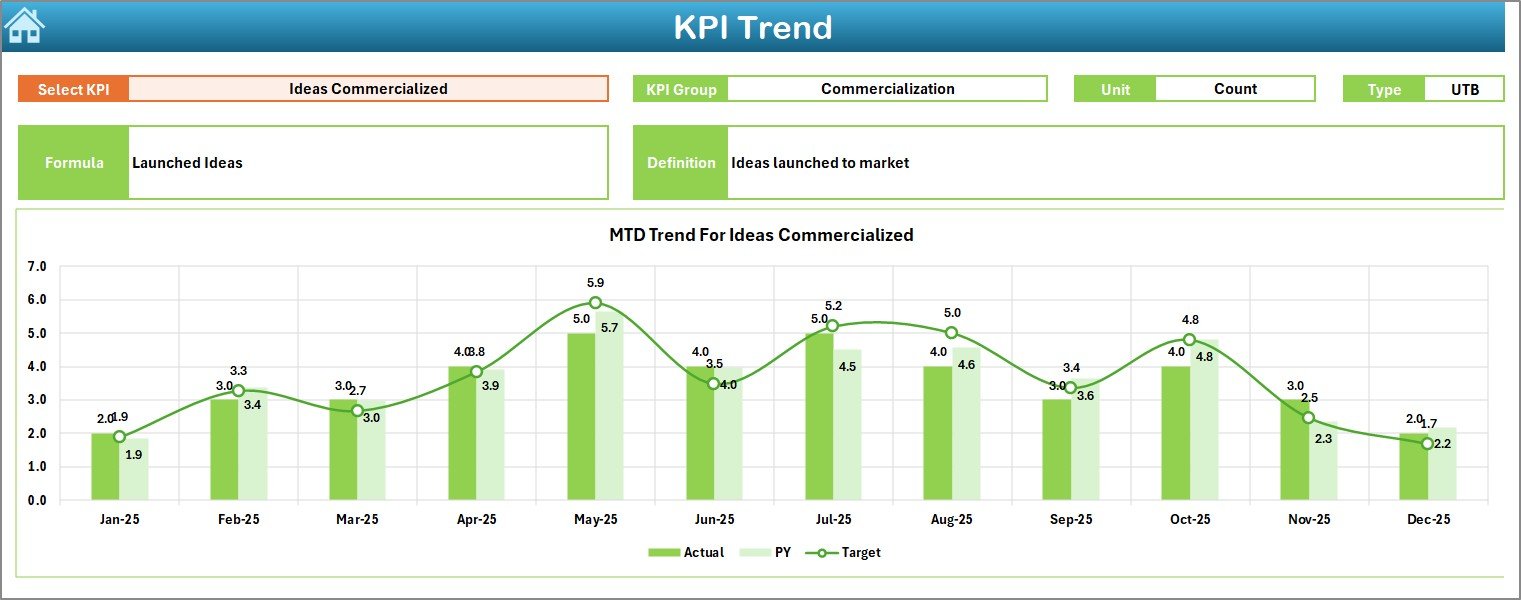
📈 Trend Analysis with Visuals
Analyze KPI trends over time to detect improvement, stagnation, or decline.
🔄 Automated Calculations
Built-in Excel formulas update metrics automatically when data changes.
🧭 Easy Navigation System
Quick-access buttons allow smooth movement across all dashboard sheets.
🎨 Conditional Formatting Indicators
Up/down arrows and visuals make performance interpretation fast and intuitive.
## What’s Inside the Innovation Labs KPI Dashboard in Excel 📂
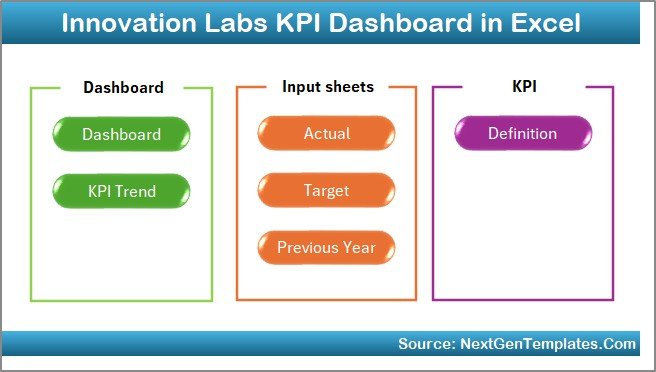
This dashboard includes 7 professionally designed worksheets, each serving a specific purpose:
📌 Summary Page – Acts as a navigation hub with 6 buttons for quick access
📌 Dashboard Sheet – Displays all KPIs with MTD, YTD, targets, and YoY comparisons
📌 Trend Sheet – Shows KPI-level MTD and YTD trends with dynamic charts
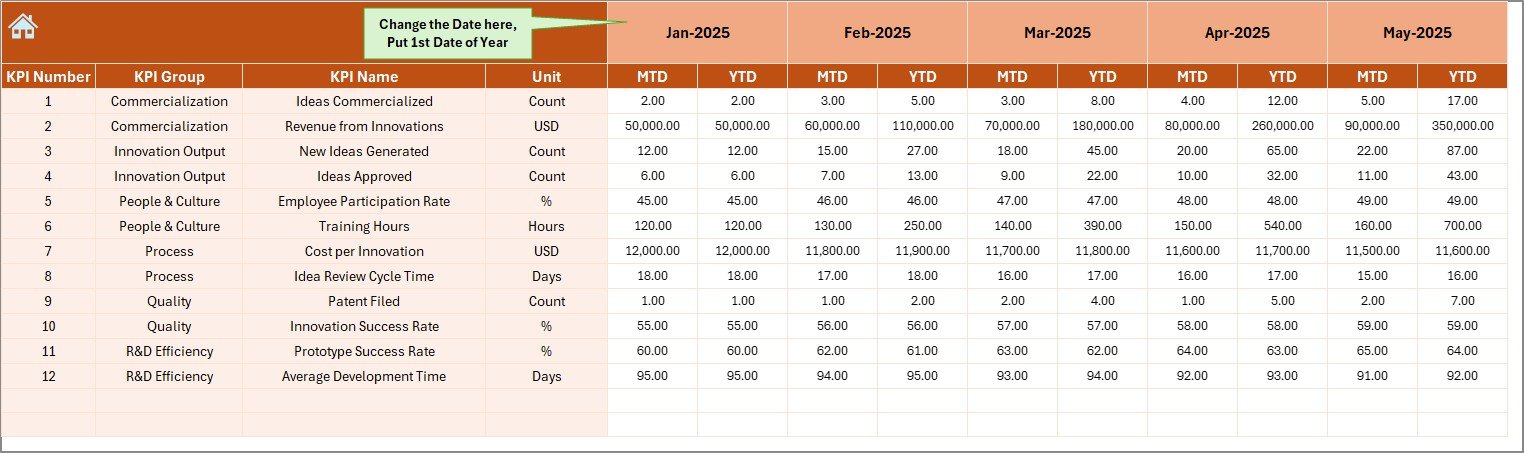
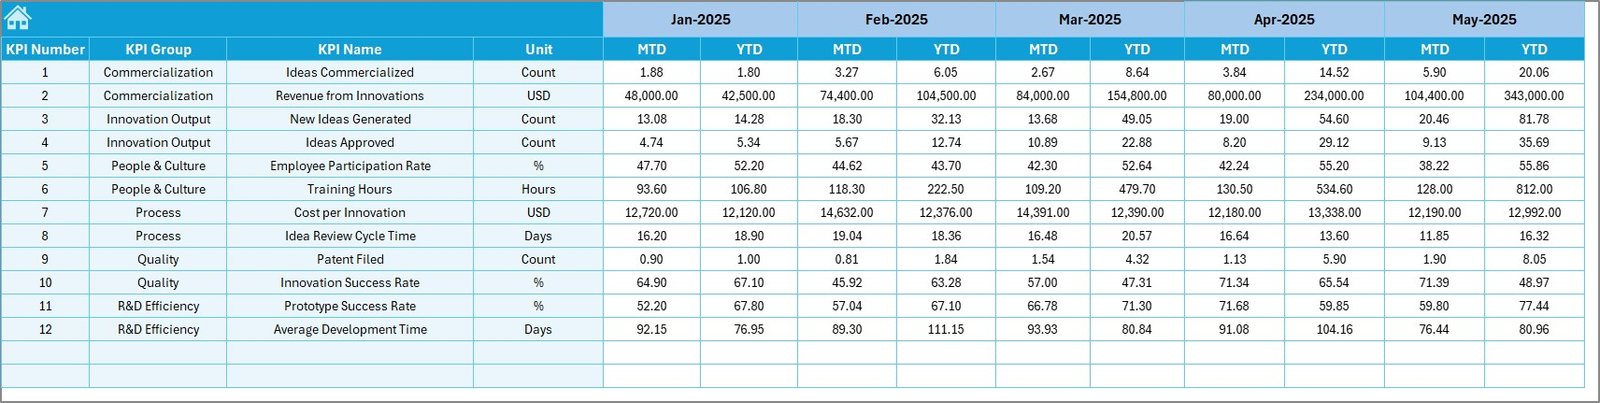
📌 Actual Numbers Input Sheet – Capture real innovation performance data
📌 Target Sheet – Define MTD and YTD targets aligned with strategy
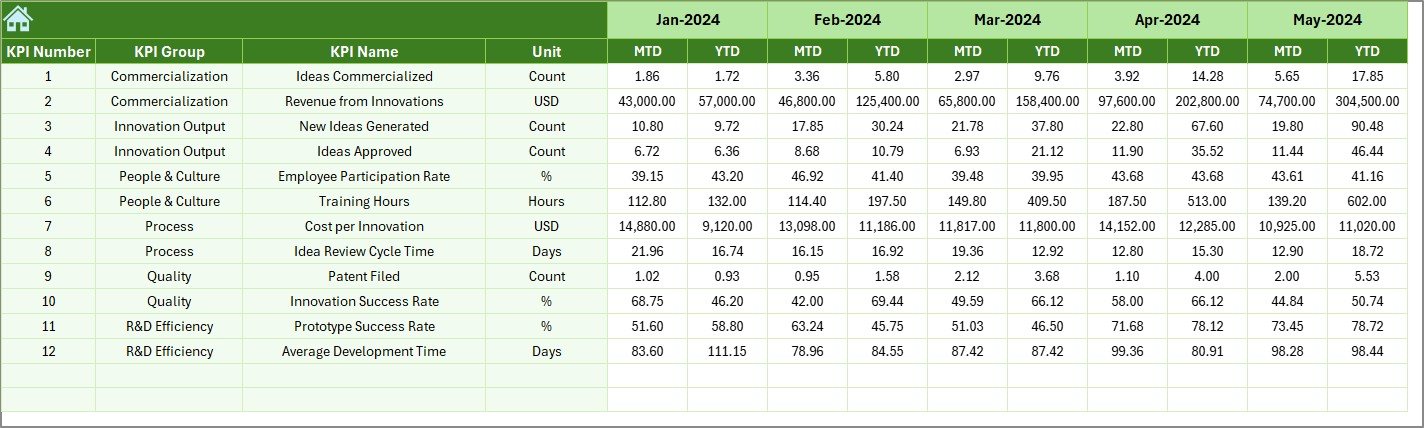
📌 Previous Year Numbers Sheet – Enable accurate year-over-year analysis
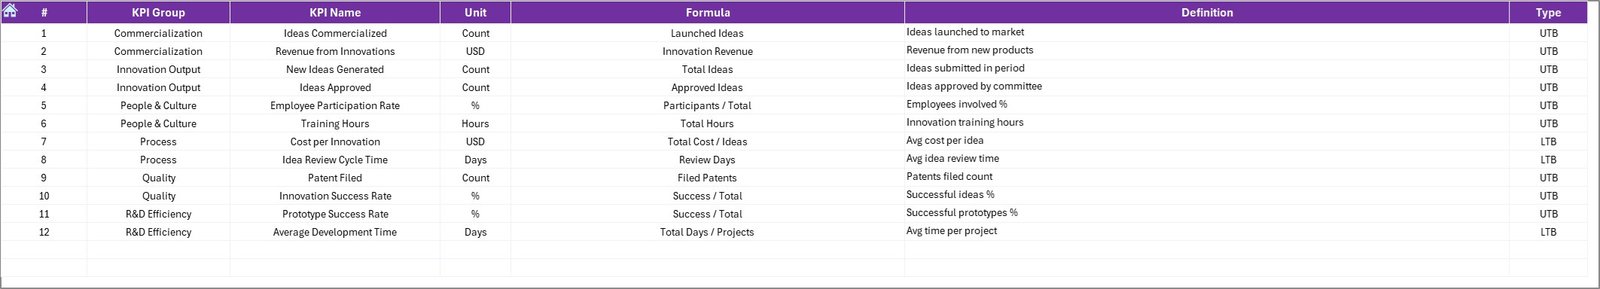
📌 KPI Definition Sheet – Maintain KPI clarity with definitions, formulas, and units
Together, these sheets create a complete innovation performance measurement system.
## How to Use the Innovation Labs KPI Dashboard in Excel 🛠️
Using this dashboard is simple and intuitive:
1️⃣ Enter actual performance data in the Actual Numbers Input Sheet
2️⃣ Define innovation goals in the Target Sheet
3️⃣ Add last year’s values in the Previous Year Numbers Sheet
4️⃣ Select the desired month using dropdown controls
5️⃣ Instantly review insights on the Dashboard and Trend sheets
No advanced Excel skills are required. The dashboard handles calculations and visuals automatically.
## Who Can Benefit from This Innovation Labs KPI Dashboard in Excel 👥
This dashboard is ideal for:
✅ Innovation Managers & Innovation Lab Heads
✅ R&D and Product Development Teams
✅ Strategy & Transformation Teams
✅ Startup Founders & CXOs
✅ Corporate Innovation Offices
If your organization invests in innovation, this dashboard ensures those investments deliver measurable results.
Click here to read the Detailed blog post
Watch the step-by-step video tutorial:


Reviews
There are no reviews yet.