Managing private equity investments requires precision, speed, and transparency. However, many private equity firms still depend on scattered Excel files, manual MIS reports, and time-consuming reconciliations. As a result, tracking fund performance, valuations, ownership, and returns becomes inefficient and error-prone.
That is exactly where the Private Equity Dashboard in Excel delivers real value.
This ready-to-use Excel dashboard transforms raw private equity data into clear, interactive, and actionable insights. It allows fund managers, analysts, and investment teams to monitor IRR, MOIC, valuation, ownership, exit status, and investment trends across funds, industries, regions, stages, and time periods—all in one place.
🚀 Key Features of Private Equity Dashboard in Excel
💼 Centralized Portfolio Visibility
Track all private equity investments from a single Excel dashboard.
📈 Core PE Metrics at a Glance
Monitor Invested Amount, Current Valuation, IRR, MOIC, Ownership %, and Exit Status.
🧭 Page Navigator for Seamless Navigation
Quickly switch between analysis pages using a left-side page navigator.
🎛️ Dynamic Slicers for Interactive Analysis
Filter data by Fund, Industry, Region, Investment Stage, and Month.
📊 Multiple Analysis Pages
Analyze performance from strategic, sectoral, geographic, and time-based perspectives.
⚡ Automatic Updates
Update the Data Sheet once and refresh insights instantly.
💰 Cost-Effective & Excel-Native
No BI tools required—fully built using standard Excel features.
📄 Dashboard Pages Included
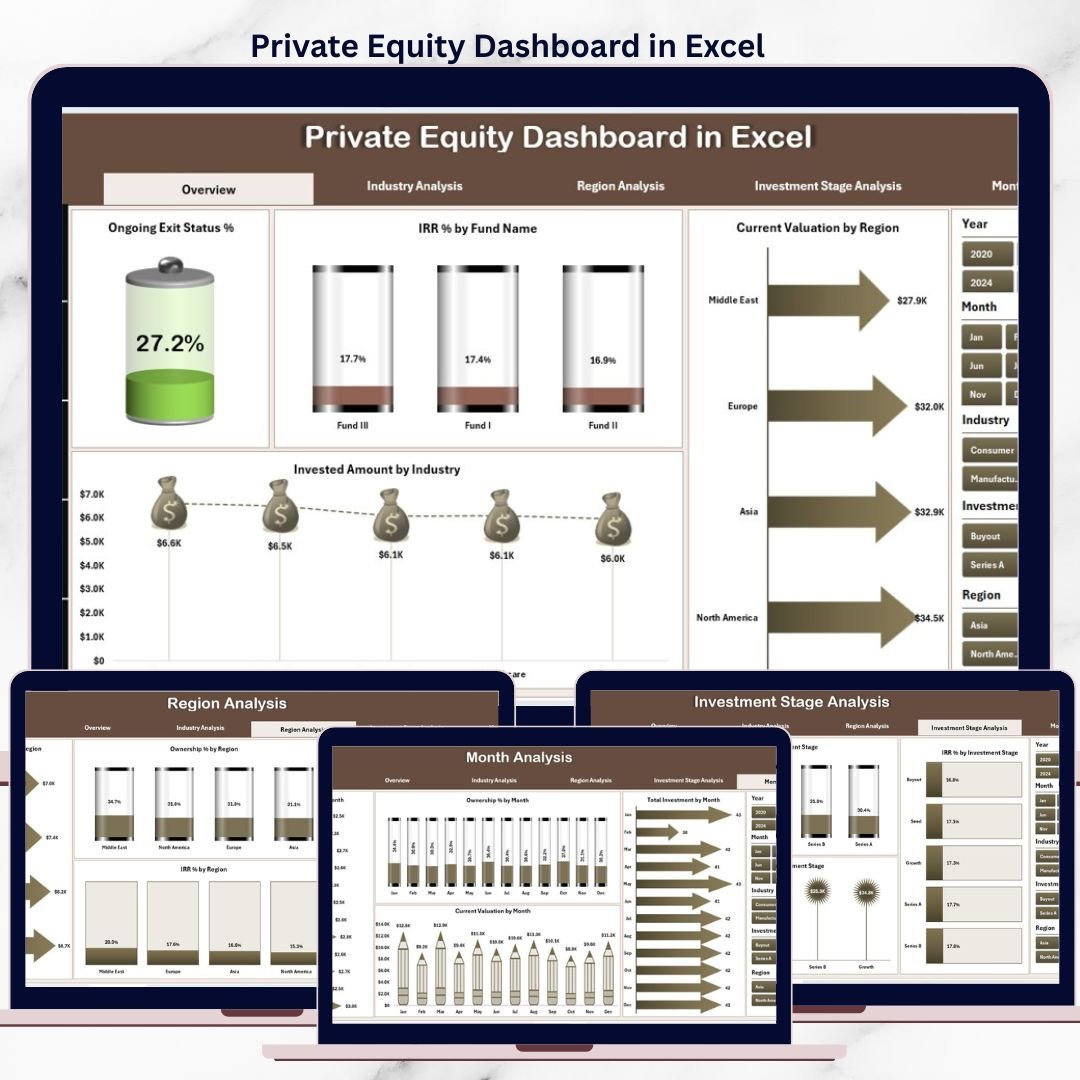
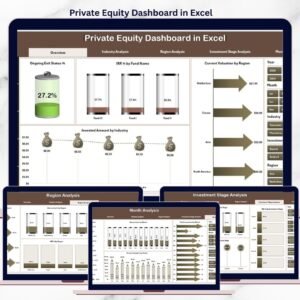
1️⃣ Overview Page – Portfolio Snapshot
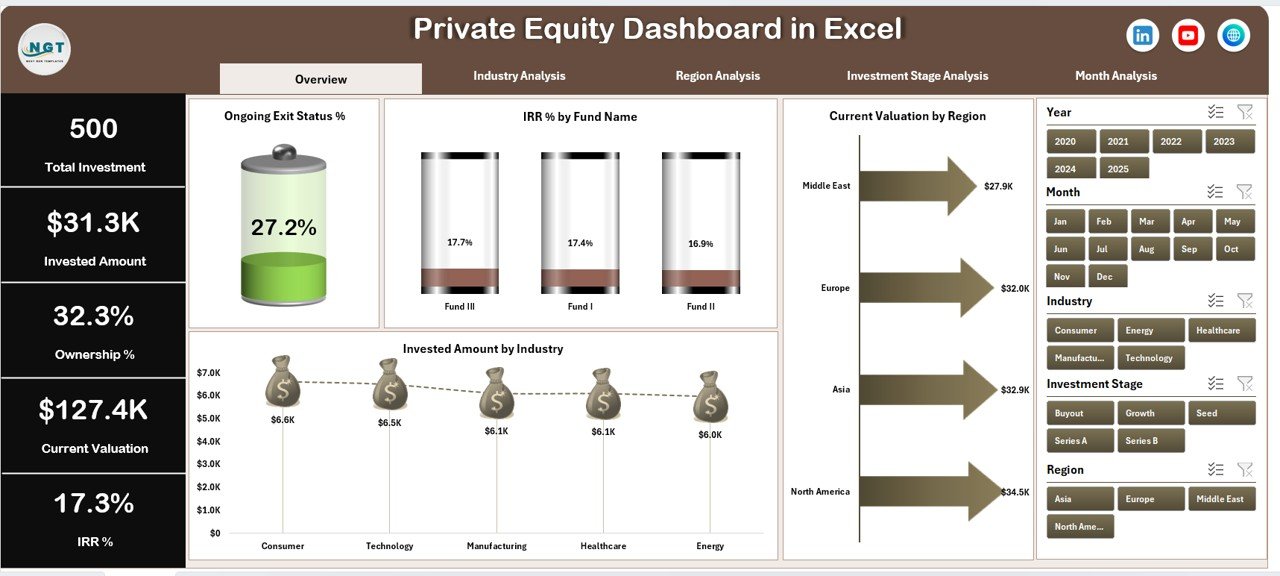
The Overview Page provides a high-level summary of private equity performance.
Key Visuals Included:
-
Ongoing Exit Status %
-
IRR % by Fund Name
-
Current Valuation by Region
-
Invested Amount by Industry
This page helps decision-makers quickly assess portfolio health before diving deeper.
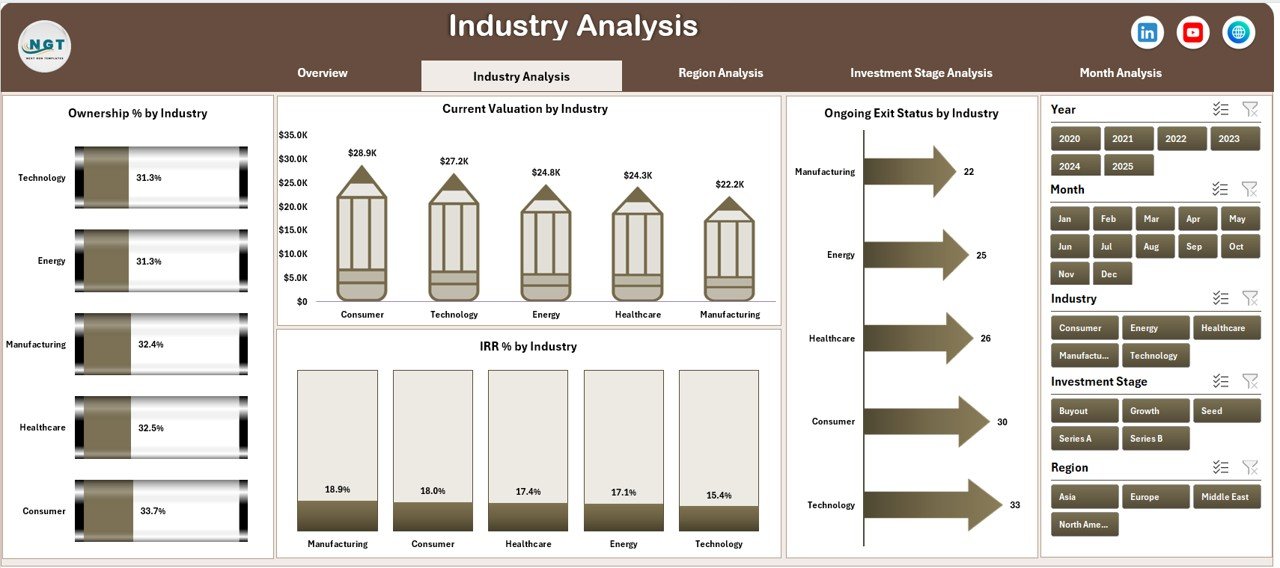
2️⃣ Industry Analysis Page – Sector Performance
Analyze investment performance across industries.
Charts Included:
-
Ownership % by Industry
-
Current Valuation by Industry
-
Ongoing Exit Status by Industry
-
IRR % by Industry
This page highlights which sectors drive returns and which need attention.
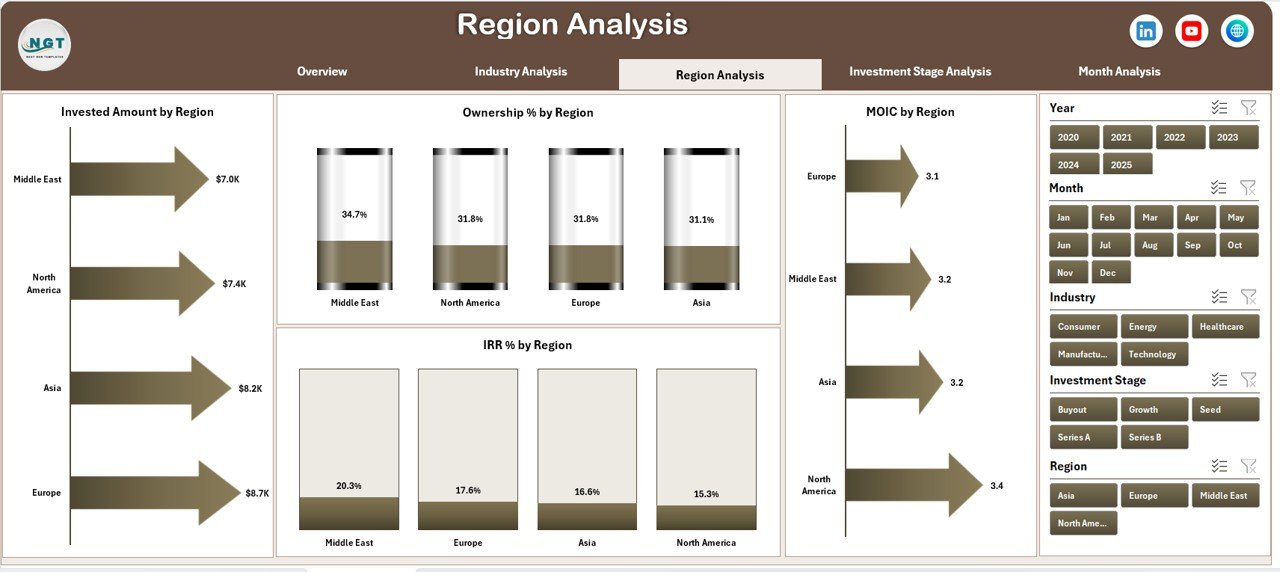
3️⃣ Region Analysis Page – Geographic Exposure
Understand performance across regions.
Charts Included:
-
Invested Amount by Region
-
Ownership % by Region
-
MOIC by Region
-
IRR % by Region
Helps firms manage geographic risk and identify high-performing regions.
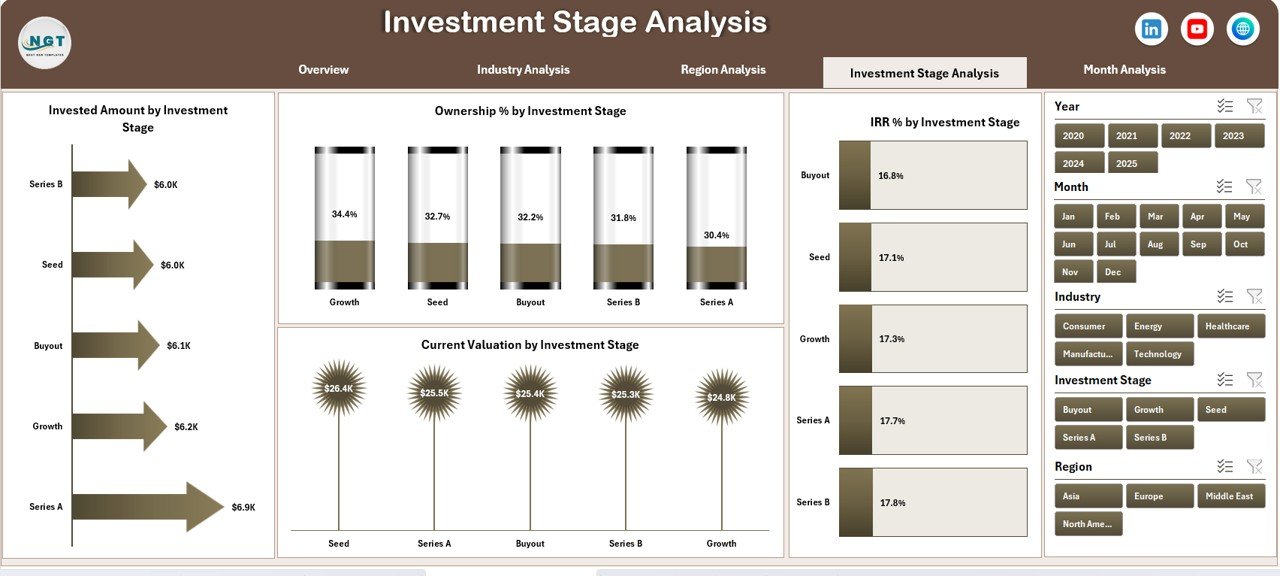
4️⃣ Investment Stage Analysis Page – Stage-Wise Returns
Evaluate returns across investment stages.
Charts Included:
-
Invested Amount by Investment Stage
-
Ownership % by Investment Stage
-
Current Valuation by Investment Stage
-
IRR % by Investment Stage
Supports smarter capital allocation decisions.
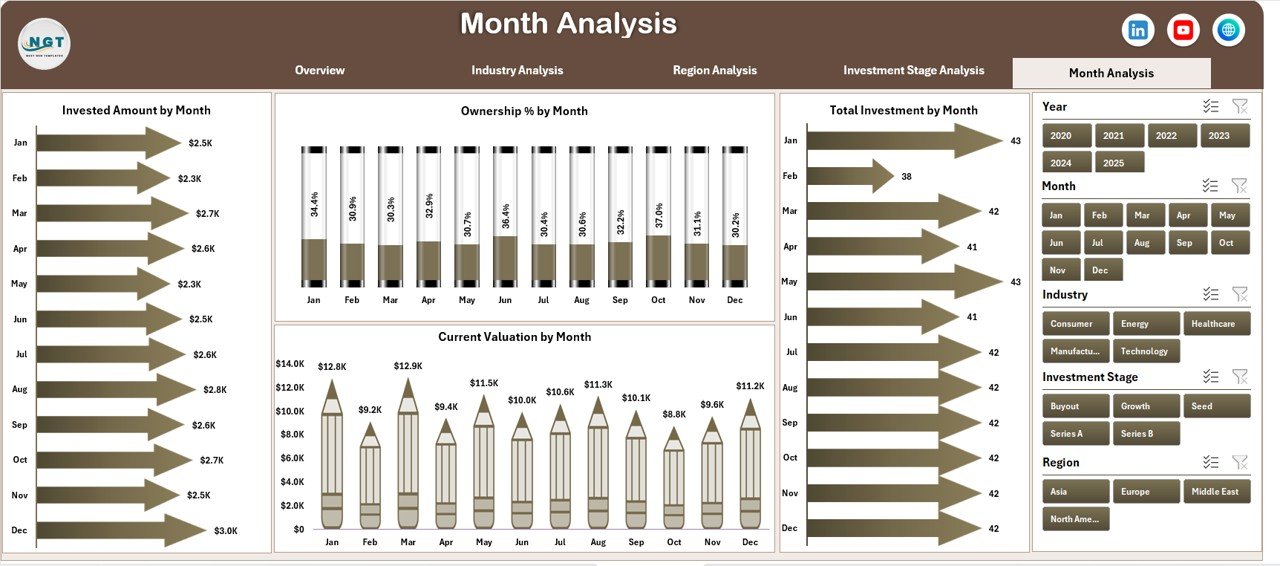
5️⃣ Month Analysis Page – Time-Based Trends
Track how investments evolve over time.
Charts Included:
-
Invested Amount by Month
-
Ownership % by Month
-
Current Valuation by Month
-
Total Investment by Month
This page reveals seasonality and timing patterns.
🗂️ Supporting Sheets Included
📌 Data Sheet
-
Stores all raw private equity data
-
Structured, clean, and pivot-ready
-
Acts as the backbone of the dashboard
⚙️ Support Sheet
-
Contains helper tables and calculations
-
Ensures slicers and charts work smoothly
-
Recommended to keep protected
📌 KPIs Tracked in the Dashboard
-
Invested Amount
-
Current Valuation
-
Ownership Percentage
-
Internal Rate of Return (IRR)
-
Multiple on Invested Capital (MOIC)
-
Exit Status
-
Fund-wise Performance
-
Industry-wise Performance
-
Region-wise Performance
-
Stage-wise Performance
✅ Advantages of Private Equity Dashboard in Excel
✔ Centralized investment tracking
✔ Faster and more confident decision-making
✔ Reduced manual reporting effort
✔ Improved data accuracy
✔ Interactive and flexible analysis
✔ Easy customization and scalability
✔ No expensive BI tools required
👥 Who Should Use This Dashboard?
-
Private Equity Fund Managers
-
Investment & Portfolio Analysts
-
Finance & Reporting Teams
-
CFOs and Investment Committees
-
Boutique PE Firms and Large Funds
If you manage private equity investments, this dashboard fits perfectly into your workflow.
🧠 Best Practices for Using the Dashboard
-
Maintain clean and structured data in the Data Sheet
-
Avoid hard-coding values in calculations
-
Use consistent definitions for IRR and MOIC
-
Refresh data regularly
-
Protect Support and calculation sheets
-
Use slicers for focused analysis
🎯 Conclusion
The Private Equity Dashboard in Excel converts complex investment data into clear, visual, and actionable insights. It improves transparency, accelerates decision-making, and significantly reduces reporting effort—while remaining flexible and cost-effective.
If you want clarity without complexity, this dashboard is the ideal solution for private equity performance tracking.
🎥 Learn step-by-step usage on our YouTube channel
👉 https://www.youtube.com/@PKAnExcelExpert


Reviews
There are no reviews yet.