



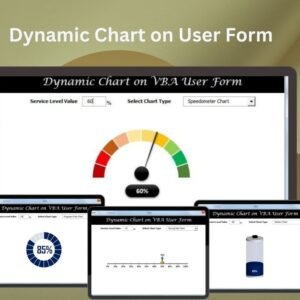
The Dynamic Chart on User Form in Excel is a ready-made VBA tool that shows dynamic, interactive charts directly inside an Excel UserForm. It is built for analysts, sales teams, managers and dashboard creators who want users to explore data and key metrics without editing the Excel sheet itself. Users adjust inputs on the form and the chart updates in real time.
You can use it for sales performance charts, project progress tracking or financial metrics. Users work with the form, change parameters and see their data change instantly, which makes data visualization more accessible and engaging.

Key Features of the VBA Dynamic Chart on User Form
- Dynamic charts: Create and display real-time charts that update based on user inputs or selections within the UserForm.
- User interactivity: Users work with the data through dropdowns, sliders or text boxes to update the chart dynamically.
- Customizable charts: Tailor chart types, colors and data series to match your data visualization needs.
- Real-time chart updates: Chart changes appear instantly as users adjust inputs or data ranges.
- Easy-to-use interface: A simple, intuitive UserForm lets people interact with the chart without advanced Excel skills.
- Versatile chart types: Present data as bar charts, line charts or pie charts.
Why You Will Love It
- Interactive data visualization: Interactive charts let users explore different data points and trends.
- Faster decisions: Users see the effect of their input on the chart straight away.
- Easy customization: Change chart types, colors and data series to suit your needs.
- User-friendly: No advanced Excel or VBA knowledge is needed to interact with the dynamic charts.
- Good for dashboards: Use it to build dashboards for quick analysis and presentation of data.
What’s Inside the Template
| Component | What it does |
|---|---|
| Excel UserForm with VBA code | A pre-built form that hosts the dynamic chart and runs the charting logic. |
| Dynamic data visualization | Interactive charts that change based on user inputs within the form. |
| Custom controls | Drop-down menus, sliders or text boxes that change chart data and update it in real time. |
| Chart customization options | Adjust chart appearance, data ranges and labels to create meaningful visualizations. |
| User-friendly interface | An intuitive form that anyone can use without advanced Excel skills. |
| Real-time chart updates | Updates appear instantly as the user changes parameters or inputs. |
Who It’s For
- Data analysts who want users to explore trends without touching the source sheet
- Sales teams tracking sales performance charts
- Business owners reviewing key metrics at a glance
- Project managers tracking project progress
- Financial analysts displaying financial metrics
- Dashboard creators building interactive reports
- Excel users looking for interactive charts inside an Excel UserForm
How to Use the Dynamic Chart on User Form
- Download the template: Get the pre-built Excel UserForm with VBA code for dynamic charting. After downloading and unzipping the file, make sure macros are enabled before use.
- Customize the chart data: Change the chart’s data series, types and appearance to fit your needs.
- Set up user inputs: Configure interactive controls such as drop-downs or sliders so users can input data.
- Run the VBA code: Start the dynamic charting with a simple click.
- Interact with the chart: Users adjust inputs and see the chart update in real time.
For step-by-step instructions on enabling macros, see our tutorial: https://www.pk-anexcelexpert.com/4-easy-ways-to-enable-macros-in-excel-vba/
Read the Detailed Guide
Click here to read the detailed blog post.
Watch the Step-by-Step Video Tutorial
Visit our YouTube channel for step-by-step video tutorials: Youtube.com/@PKAnExcelExpert
Frequently Asked Questions
What is the Dynamic Chart on User Form in Excel?
It is a VBA tool that shows dynamic, interactive charts inside an Excel UserForm. The charts respond to user inputs, so people can view and analyze data without changing the worksheet itself.
Do I need VBA skills to use it?
No. Users do not need advanced Excel or VBA knowledge to interact with the charts. Some familiarity with Excel helps if you want to customize the data series, chart types or controls.
Which chart types can I show?
You can present data as bar charts, line charts and pie charts. You can also customize colors, data series, data ranges and labels.
How do users change the chart?
Users work with controls on the form, such as drop-downs, sliders or text boxes. The chart then shows real-time chart updates as inputs or parameters change.
Do I need to enable macros?
Yes. After downloading and unzipping the file, enable macros before use. The macros tutorial linked above explains how, step by step.
Can I use it for dashboards?
Yes. The VBA dynamic chart works well for dashboards and reports where users need quick analysis and presentation of data such as sales, project progress or financial metrics.
Also check our Small Business KPI Dashboard
Last updated: October 2026
Compatibility and Requirements
- Built with Excel and VBA. It needs Microsoft Excel desktop on Windows with macros enabled.
- It does not run in Excel for the web, Google Sheets or Excel mobile apps, because the UserForm uses VBA.
- Microsoft explains how to turn macros on in Enable or disable macros in Microsoft 365 files.
Related VBA UserForm and Chart Templates
- Multilevel dependent drop-down in User Form: dependent dropdowns inside a UserForm
- Ultimate Progress Bar Control in VBA User form: show progress inside a form
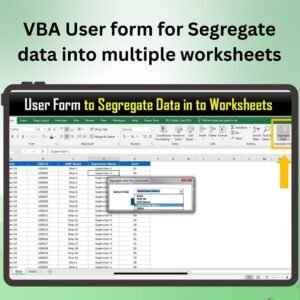
- VBA User form for Segregate data into multiple worksheets: split data from a form
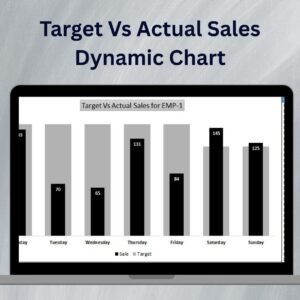
- Dynamic Chart with Form Control Scrollbar: a dynamic chart on the sheet itself
- Data Analyst’s Chart and Visualization Pack: a bundle of chart templates
Browse all Excel VBA tools or the Excel charts and visualization templates.












Reviews
There are no reviews yet.