Corporate Universities Dashboard has moved far beyond attendance sheets and static training reports. Today, organizations must clearly understand training effectiveness, learner engagement, program costs, and ROI to ensure learning initiatives truly support business goals. However, when data sits across LMS exports, Excel files, and manual reports, leadership lacks clarity.
That is exactly why the Corporate Universities Dashboard in Power BI becomes a strategic learning intelligence solution.
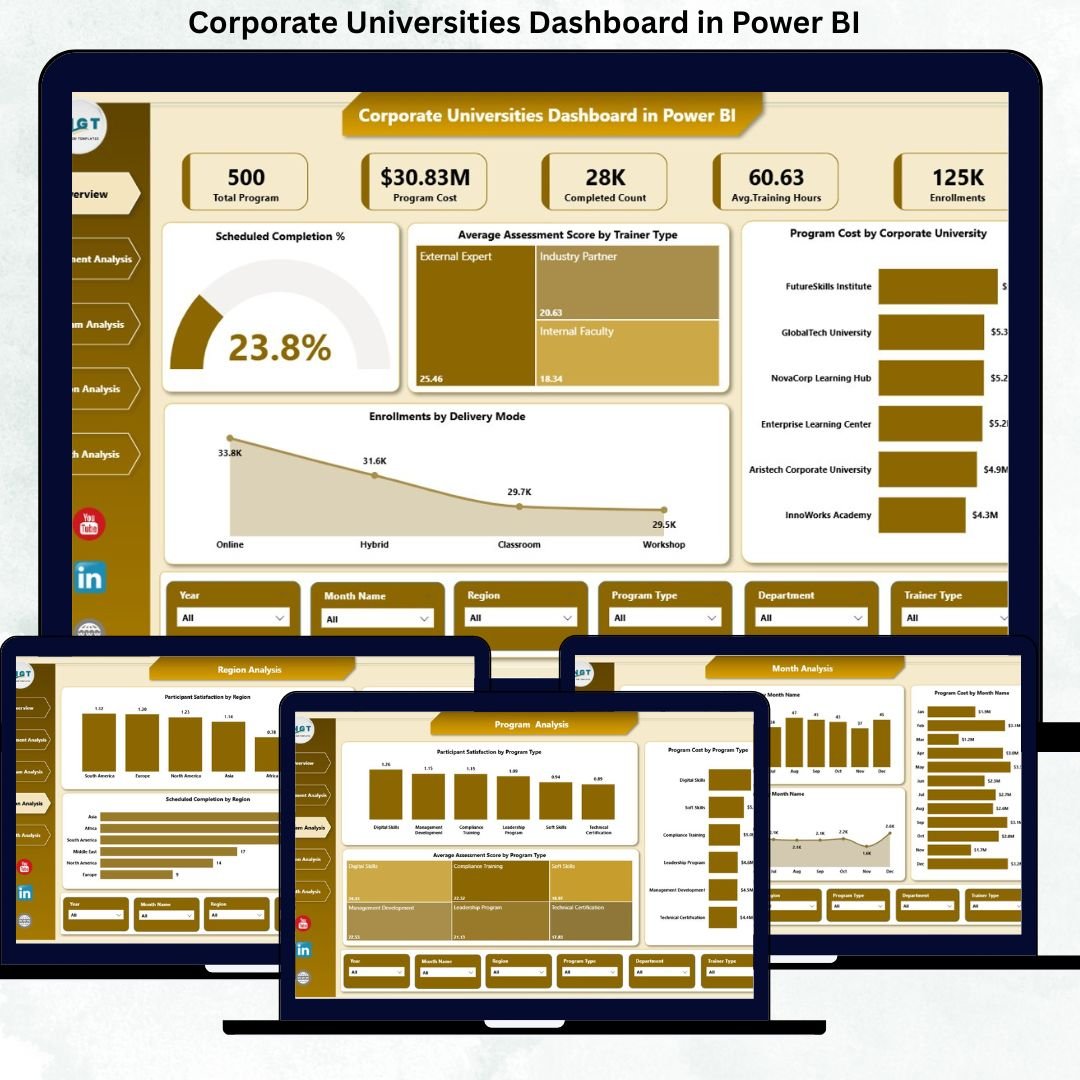
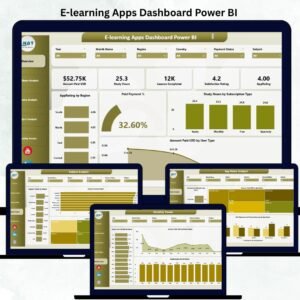
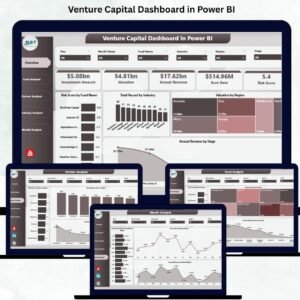
This ready-to-use, interactive Power BI dashboard transforms raw learning and development data into clear KPIs, visual insights, and actionable trends—all in one centralized platform. Instead of guessing training impact, organizations gain real-time visibility into participation, completion, assessment performance, and cost efficiency.
Designed for modern corporate universities and L&D teams, this dashboard enables data-driven learning decisions, stronger alignment with business objectives, and measurable learning ROI—without analytical complexity.
🔑 Key Features of Corporate Universities Dashboard in Power BI
📊 Centralized Learning Analytics
Track all corporate training KPIs from a single Power BI dashboard.
🎯 Training Completion & Engagement Tracking
Monitor scheduled completion %, enrollment, and completed counts instantly.
📈 Learning Effectiveness Measurement
Analyze average assessment scores across trainers, programs, departments, and regions.
💰 Program Cost & Budget Visibility
Track training spend by corporate university, department, program type, and region.
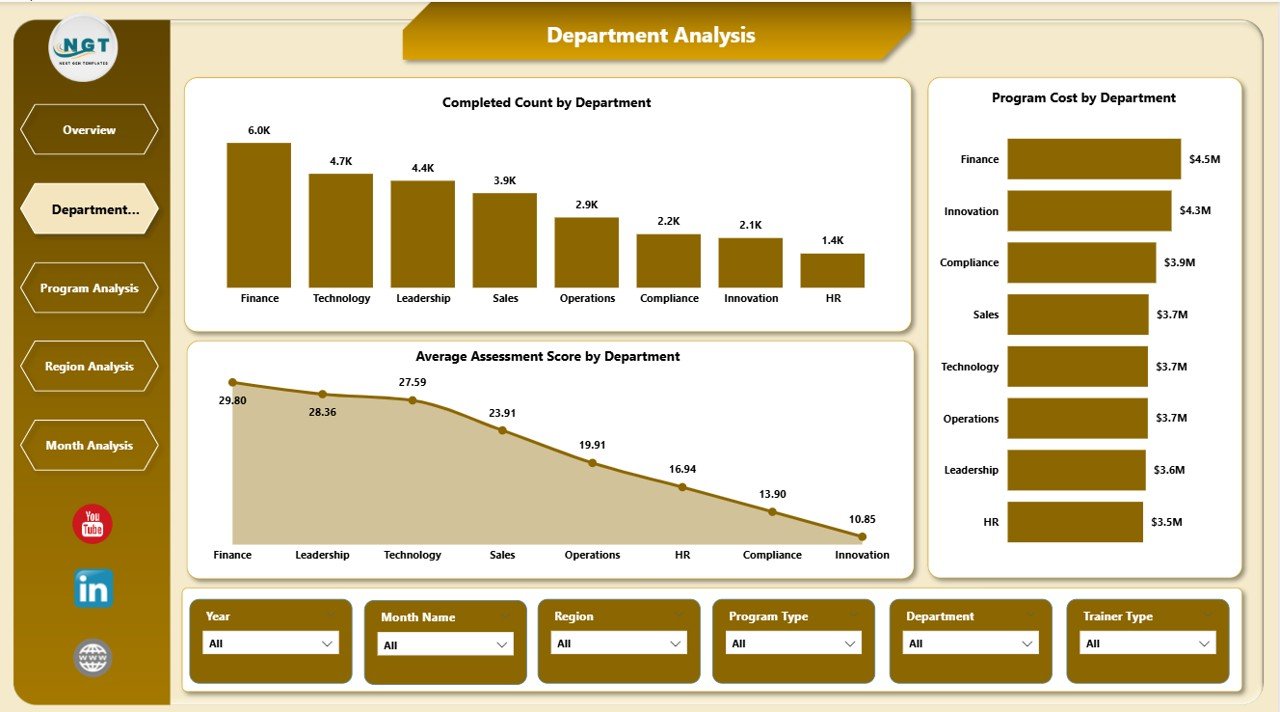
🏢 Department & Program-Level Analysis
Compare learning performance and investment effectiveness across teams and programs.
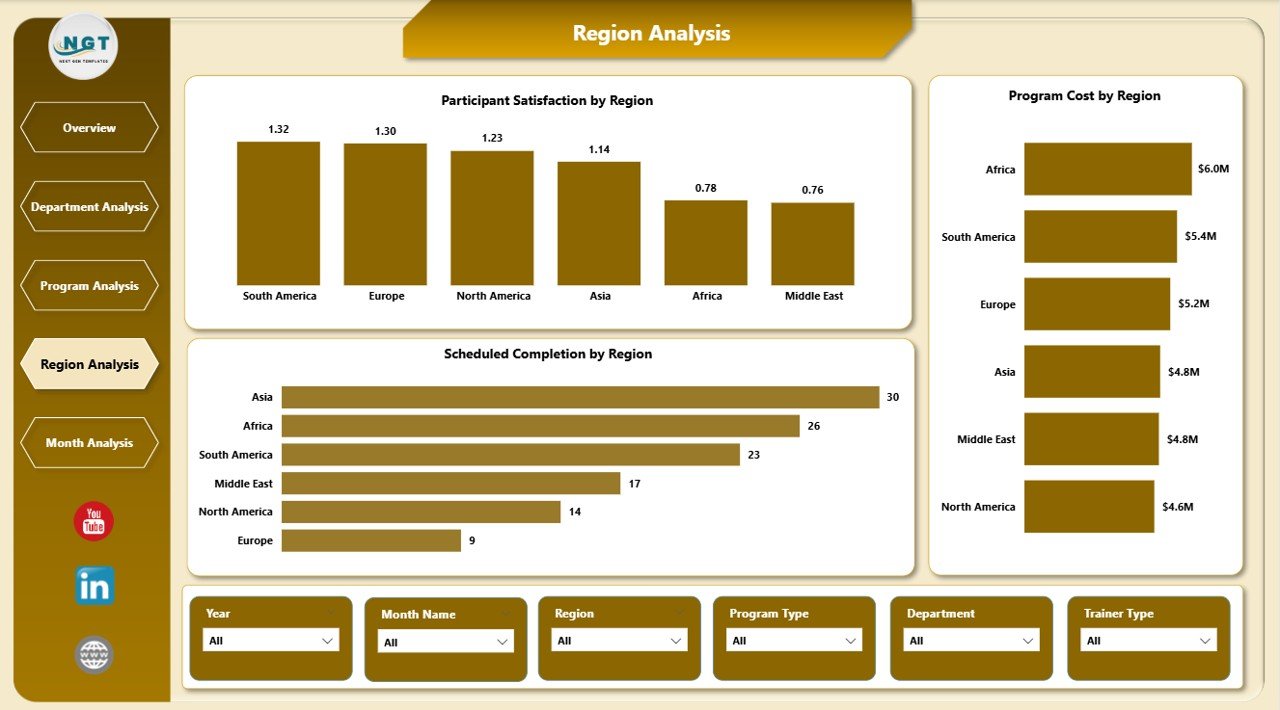
🌍 Region-Wise Learning Insights
Understand global training performance and regional learning gaps.
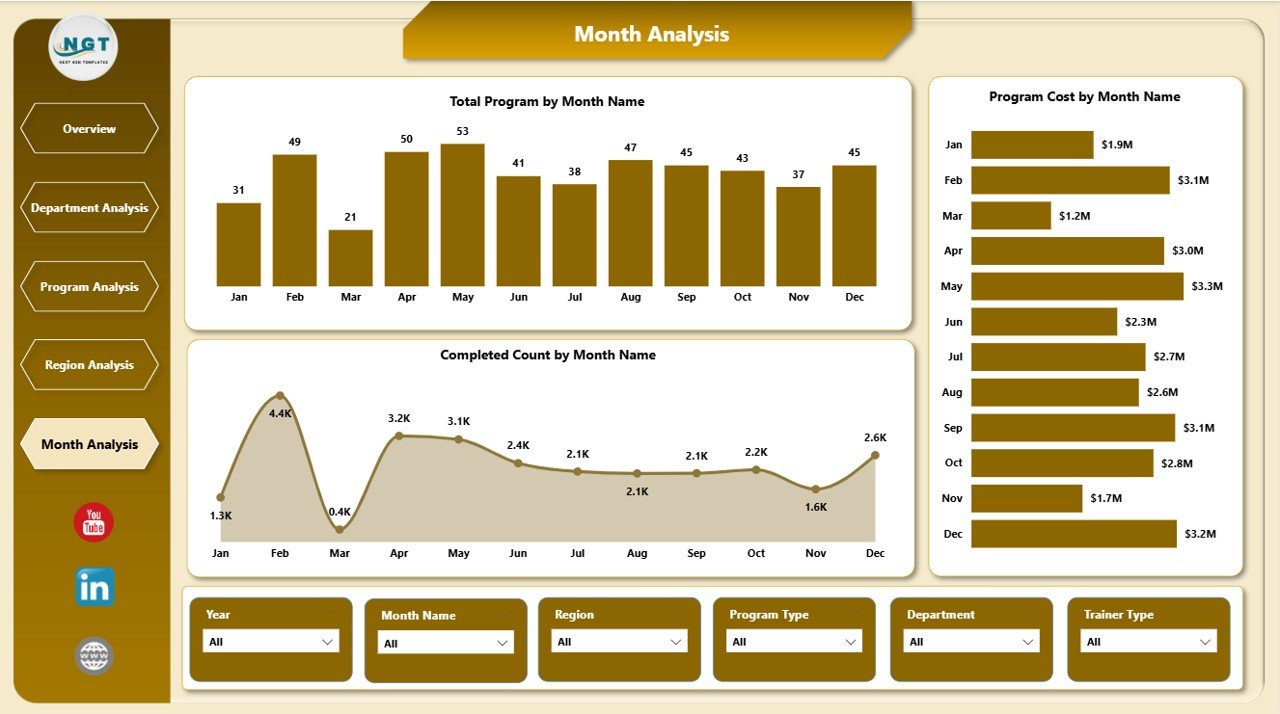
📅 Monthly Trend Analysis
Identify seasonal training patterns and budget usage trends over time.
⚡ Interactive Power BI Visuals & Slicers
Explore insights dynamically without technical skills.
📂 What’s Inside the Corporate Universities Dashboard in Power BI
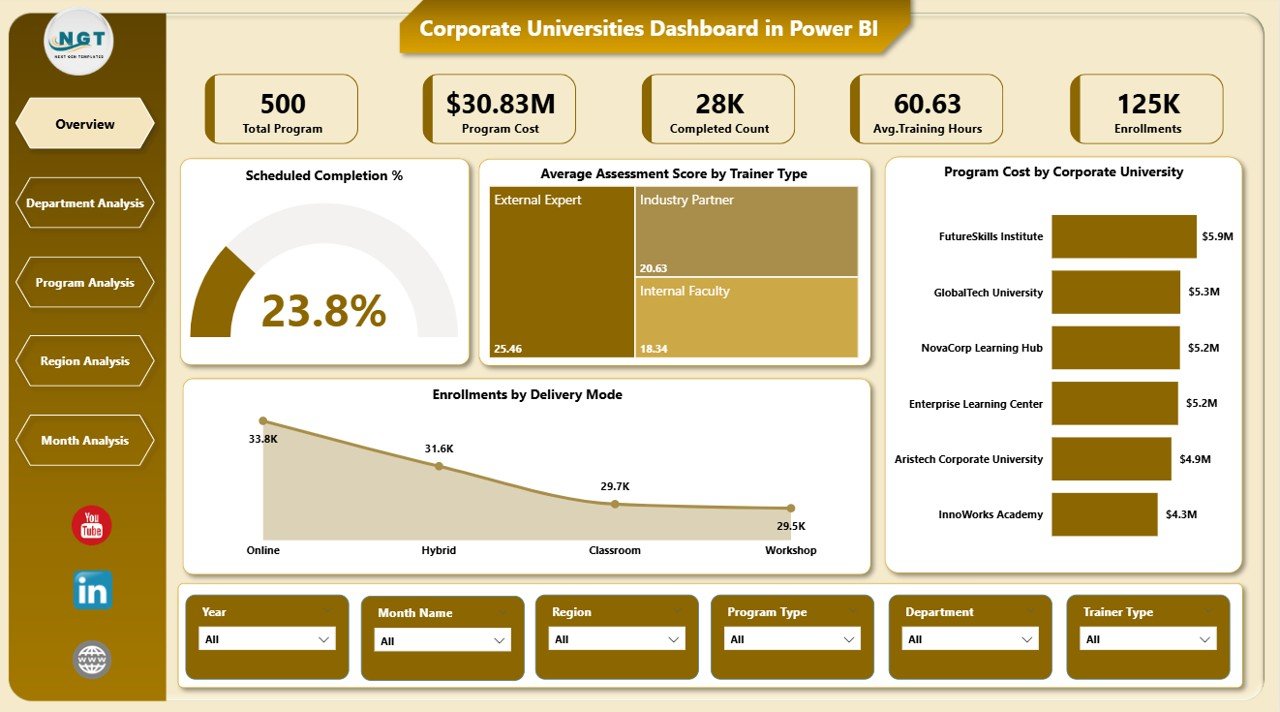
📁 Overview Page – High-level snapshot with KPI cards and core learning charts
📁 Department Analysis Page – Training performance and cost by department
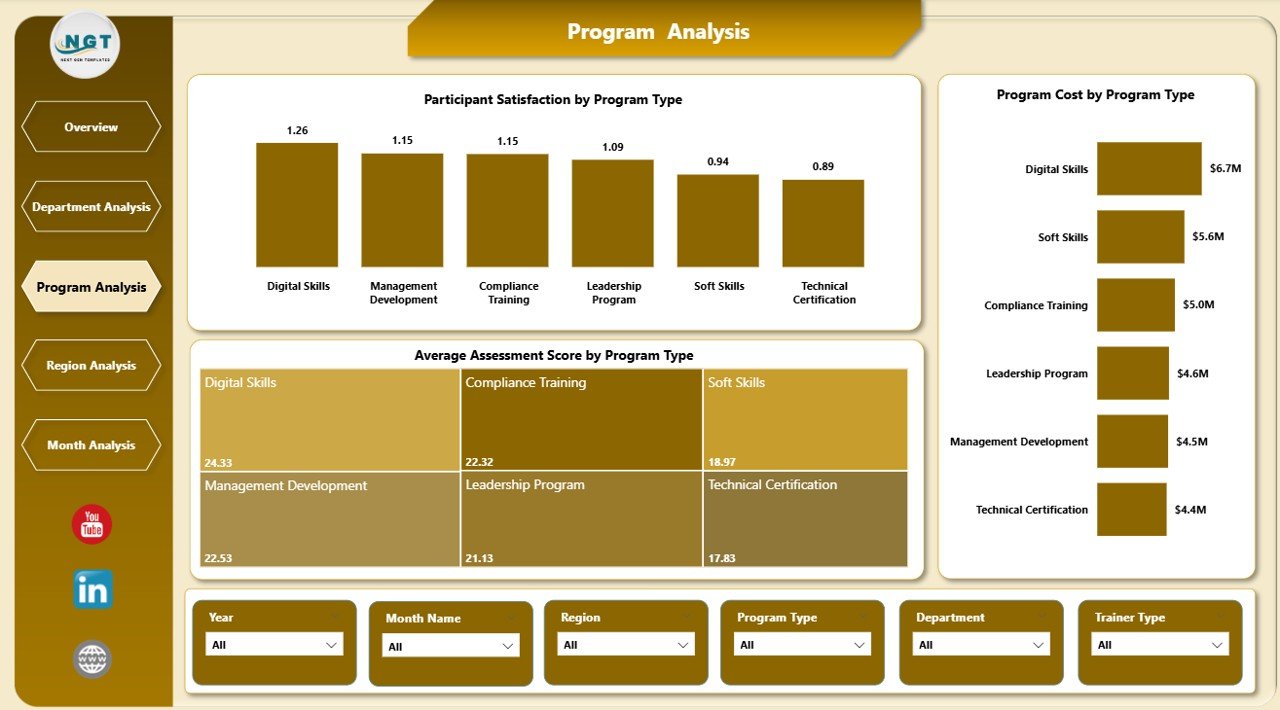
📁 Program Analysis Page – Program effectiveness, satisfaction, and cost insights
📁 Region Analysis Page – Regional learning performance comparison
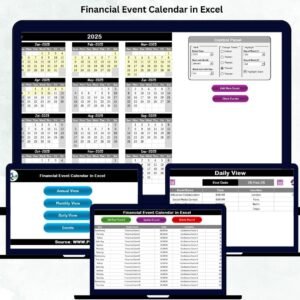
📁 Monthly Trends Page – Time-based trends for programs, costs, and completions
Together, these pages deliver a complete corporate learning performance system.
🛠️ How to Use the Corporate Universities Dashboard in Power BI
1️⃣ Prepare learning data in Excel, LMS exports, or structured files
2️⃣ Load or refresh the data in Power BI
3️⃣ Use slicers to filter by department, program, region, or time period
4️⃣ Review KPI cards for quick learning performance checks
5️⃣ Analyze charts to identify high-impact and low-performing programs
6️⃣ Use trend analysis for planning budgets and future training initiatives
The dashboard is intuitive and user-friendly, requiring no advanced Power BI expertise.
👥 Who Can Benefit from This Corporate Universities Dashboard in Power BI
🎓 Learning & Development managers
👥 HR leadership teams
🏫 Corporate university administrators
📊 Training coordinators
🏢 Business unit heads
📈 Executive leadership
If your organization invests in structured learning and talent development, this dashboard delivers immediate value.
📘 Click here to read the Detailed blog post
🎥 Visit our YouTube channel to learn step-by-step video tutorials
👉 YouTube Channel


Reviews
There are no reviews yet.