Managing procurement in port operations is never simple. With multiple vendors, strict compliance requirements, high-value purchases, and constant operational pressure, even a small mistake can lead to cost overruns and inefficiencies.
That’s exactly why the Port Procurement KPI Dashboard in Power BI is a game-changer.
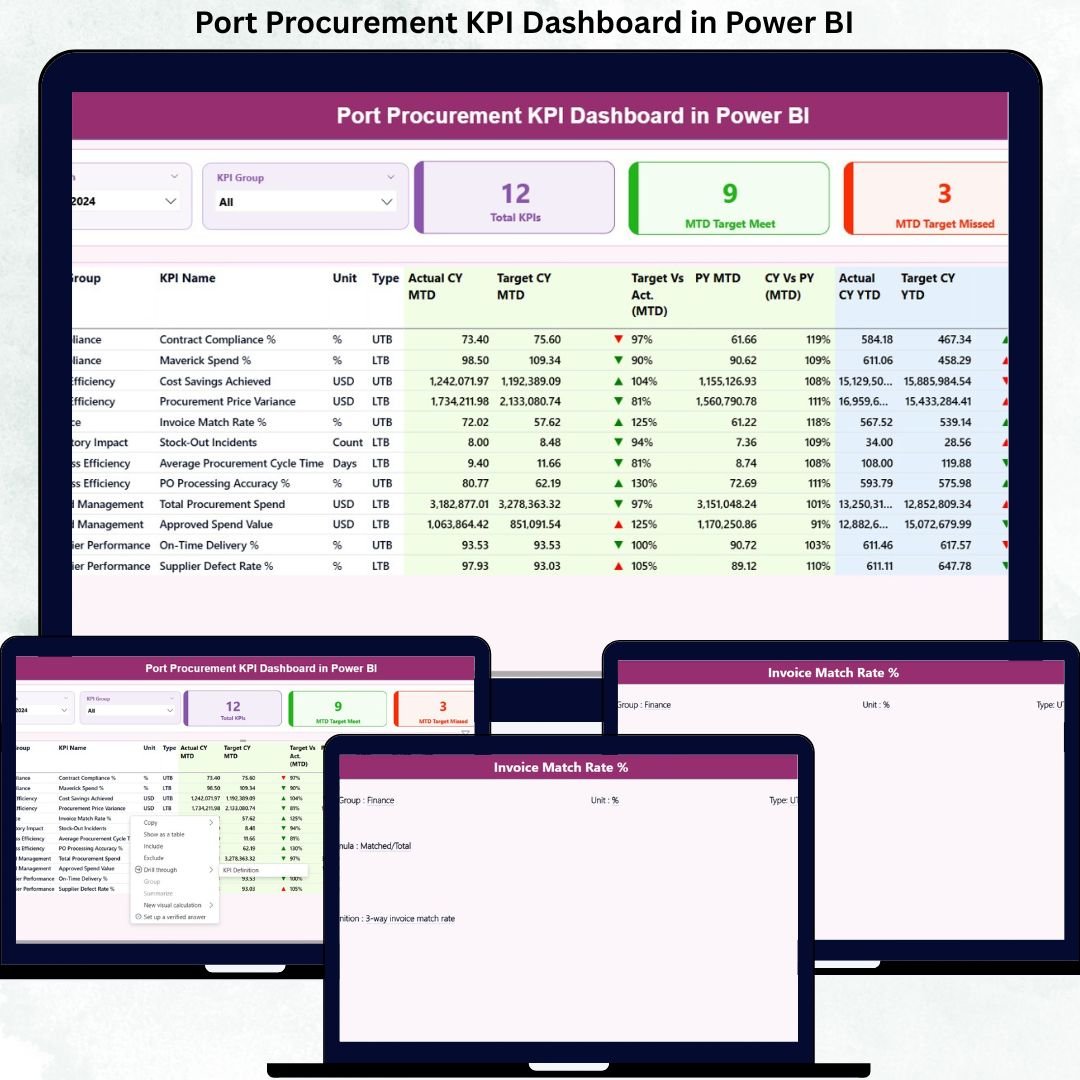
This powerful, ready-to-use dashboard helps port authorities and procurement teams monitor performance, track KPIs, and make smarter decisions using real-time data visualization. Designed with clarity and usability in mind, it transforms complex procurement data into actionable insights within seconds.
Whether you want to track targets, analyze trends, or improve procurement efficiency, this dashboard gives you complete control — all in one place.
🚀 Key Features of Port Procurement KPI Dashboard
✔️ Interactive Power BI Dashboard for procurement performance tracking
✔️ Excel-based data input – easy to update, no technical skills required
✔️ MTD & YTD performance analysis
✔️ Target vs Actual comparison with visual indicators
✔️ KPI-wise filtering and analysis
✔️ Automatic calculations and trend analysis
✔️ Clean and professional layout for management reporting
✔️ Supports decision-making with real-time insights
📊 What’s Inside the Port Procurement KPI Dashboard
This dashboard is built with a well-structured layout to ensure easy understanding and fast analysis.
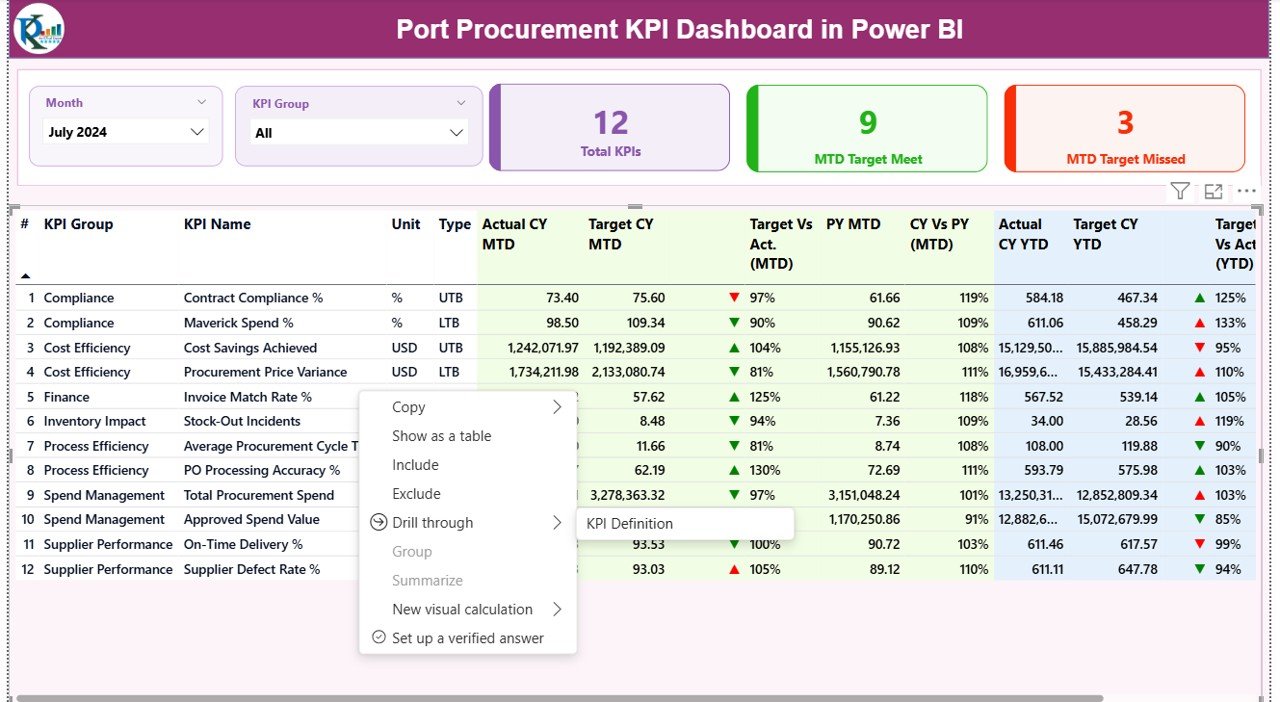
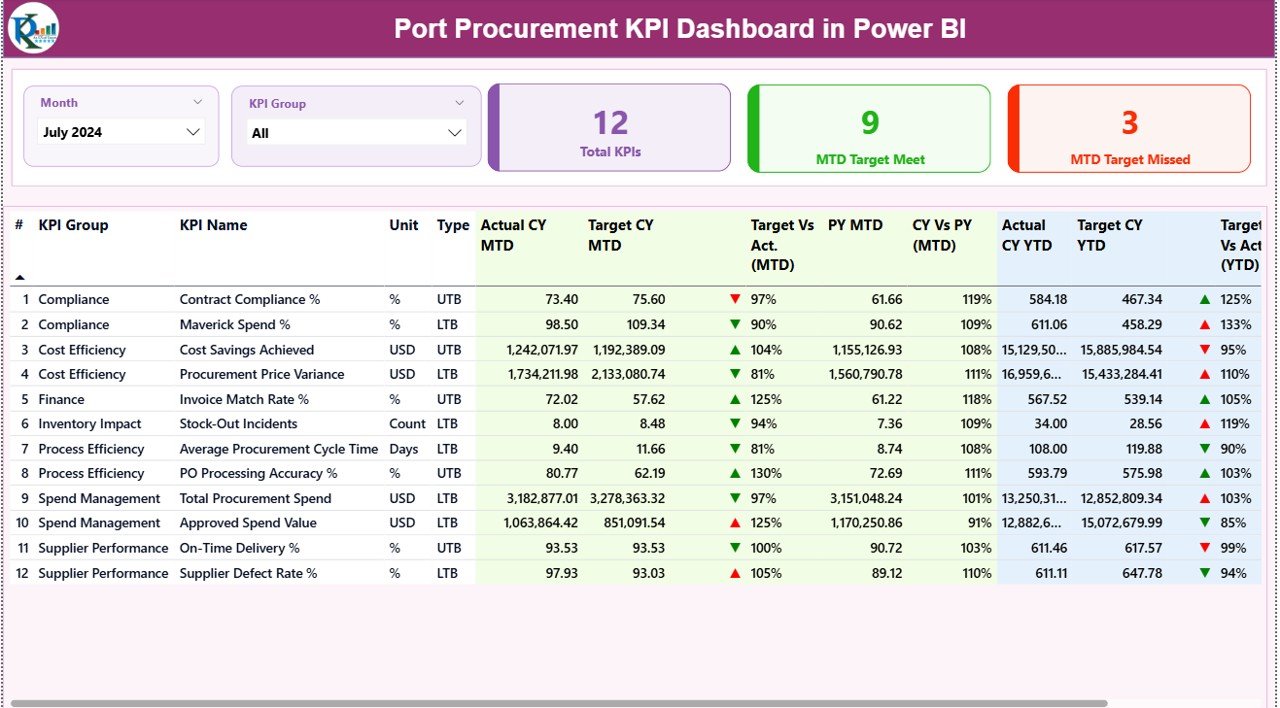
🔹 1. Summary Page
The Summary Page provides a complete overview of procurement performance.
Key Highlights:
-
Month and KPI Group slicers for quick filtering
-
KPI Cards showing:
-
Total KPIs
-
MTD Target Met
-
MTD Target Missed
-
-
Detailed KPI table including:
-
KPI Number
-
KPI Group
-
KPI Name
-
Unit
-
KPI Type (LTB / UTB)
-
-
Performance indicators with color icons
-
Actual vs Target comparison
-
Previous Year vs Current Year performance
This page helps management quickly identify problem areas and strong performers.
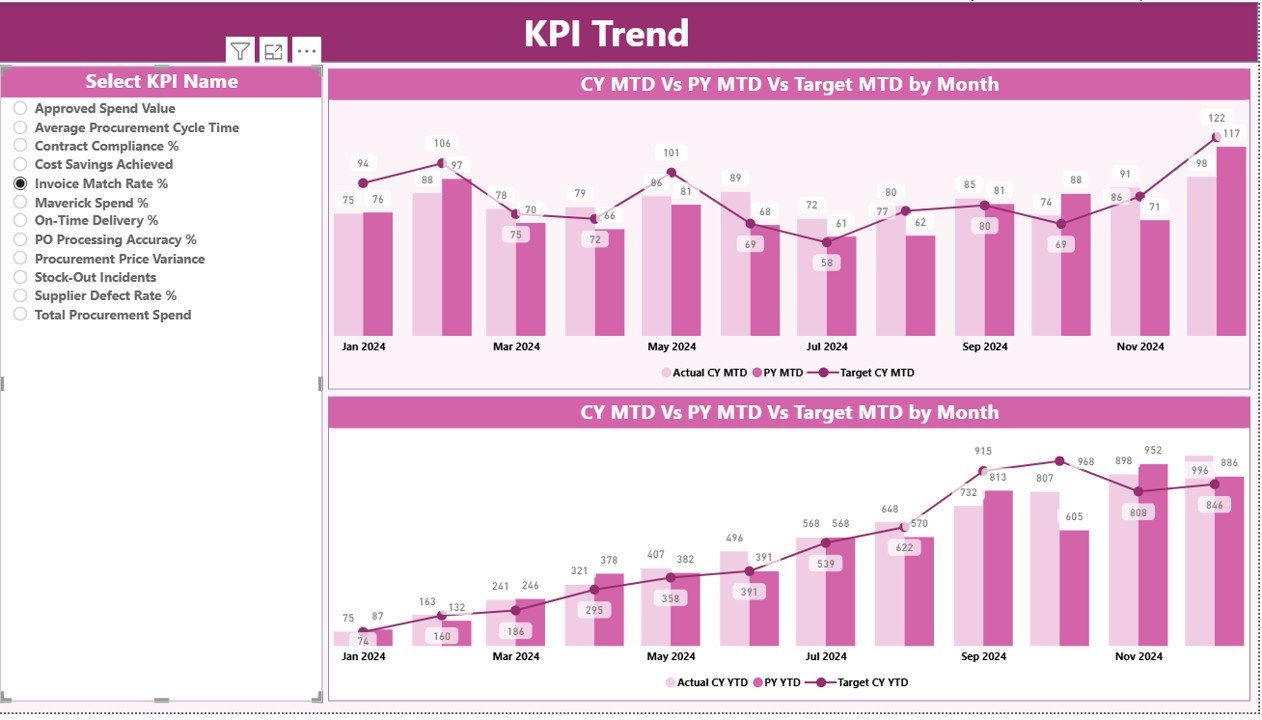
🔹 2. KPI Trend Page
This page helps analyze how KPIs perform over time.
Features include:
-
MTD and YTD trend analysis
-
Comparison of Actual, Target, and Previous Year values
-
Interactive KPI selection
-
Dynamic charts for better visibility
It helps users understand trends, patterns, and performance movement clearly.
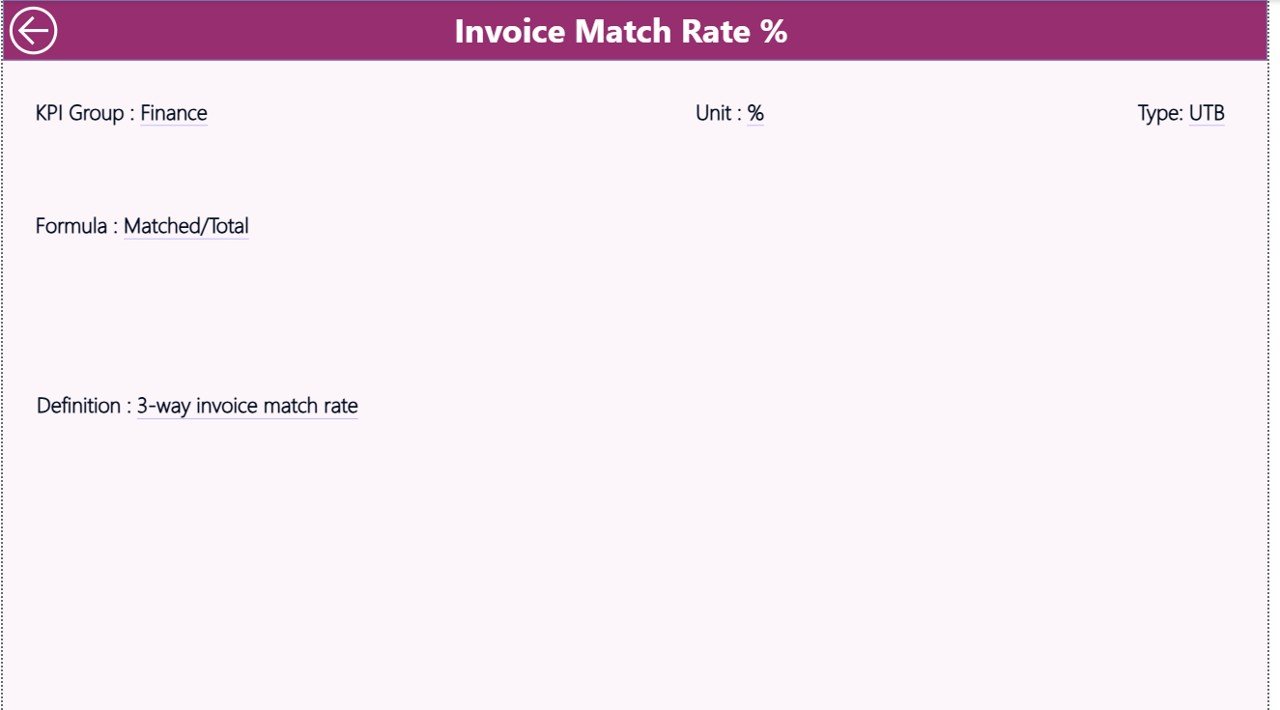
🔹 3. KPI Definition Page
This page ensures transparency and clarity for every KPI.
It displays:
-
KPI Name & Group
-
KPI Definition
-
Calculation Formula
-
KPI Type (LTB / UTB)
This section helps new users understand the logic behind every KPI.
⚙️ How to Use the Port Procurement KPI Dashboard
Using this dashboard is simple and user-friendly:
1️⃣ Enter actual values in the Input_Actual Excel sheet
2️⃣ Add target values in the Input_Target sheet
3️⃣ Define KPIs in the KPI Definition sheet
4️⃣ Refresh Power BI
5️⃣ Analyze performance using visuals and slicers
No coding. No complex setup. Just update data and analyze instantly.
👥 Who Can Benefit from This Dashboard?
✅ Port Authorities
✅ Procurement Managers
✅ Supply Chain Teams
✅ Finance & Cost Control Teams
✅ Operations Managers
✅ Performance Analysts
✅ Logistics & Port Operations Teams
Anyone responsible for procurement performance and reporting will find this dashboard extremely useful.
🎯 Why Choose This Dashboard?
✔ Saves time on manual reporting
✔ Improves procurement visibility
✔ Helps reduce cost overruns
✔ Supports data-driven decisions
✔ Easy to customize
✔ Professional and management-ready
Click here to read the Detailed blog post
Watch the step-by-step video tutorial:


Reviews
There are no reviews yet.