


Managing refinery contracts is complex, high-risk, and value-intensive. Refineries deal with long-term agreements, high-value transactions, multiple vendors, and strict compliance requirements. When contract data is scattered across Excel files, emails, and manual trackers, teams lose visibility. As a result, renewals get missed, risks increase, and financial control weakens.
That is exactly why the Refinery Contract Management Dashboard in Excel is a powerful and practical solution. 🚀
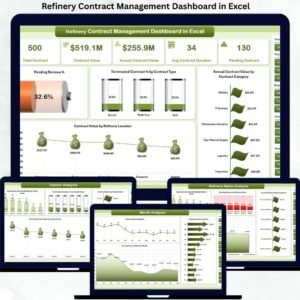
This professionally designed Excel dashboard transforms raw contract data into interactive KPIs, visual insights, and actionable trends—helping refinery teams manage contracts, vendors, renewals, and values from one centralized platform.
Built entirely in Microsoft Excel, this dashboard requires no coding, no BI tools, and no complex setup, making it ideal for real-world refinery operations.
Key Features of Refinery Contract Management Dashboard in Excel 🔑
📊 Centralized Contract Visibility
Track all refinery contracts, values, statuses, renewals, and vendors from a single dashboard.
📈 Interactive KPI Cards
Quickly monitor pending revenue %, terminated contract %, and high-value contract exposure.
🧭 Dynamic Slicers & Filters
Analyze contracts by department, vendor, refinery location, contract type, and month.
📉 Department & Vendor Performance Insights
Identify departments and vendors with high contract value, long durations, or termination risks.
📅 Time-Based Trend Analysis
Understand monthly and annual contract value trends for better forecasting.
⚡ Faster Decision-Making
Instantly spot renewal risks, delayed contracts, and cost concentration areas.
💼 Management-Ready Reporting
Perfect for leadership reviews, audits, compliance checks, and strategic planning.
What’s Inside the Refinery Contract Management Dashboard in Excel 📁
This ready-to-use Excel solution includes five structured analytical pages, along with a data sheet and support sheet:
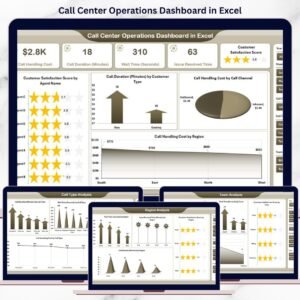
📄 Overview Page

High-level snapshot with charts such as Pending Revenue %, Terminated Contract % by Contract Type, Annual Contract Value by Category, and Contract Value by Refinery Location.
📄 Department Analysis Page
Analyze Average Contract Duration, Pending Contracts, Annual Contract Value, and Contract Value by Department.
📄 Vendor Analysis Page
Evaluate vendor-wise contract duration, termination rate, annual contract value, and total contract value.
📄 Refinery Name Analysis Page
Compare contract duration, renewal risk, and contract value across refinery locations.
📄 Month Analysis Page
Track Total Contracts, Contract Value, and Annual Contract Value trends month by month.
📄 Data & Support Sheets
Structured contract data, dropdown lists, slicer support, and helper calculations for smooth performance.
Each page is designed to answer real contract management questions faced by refinery leadership.
How to Use the Refinery Contract Management Dashboard in Excel 🛠️
1️⃣ Enter or update contract details in the Data Sheet
2️⃣ Use slicers to filter by department, vendor, refinery, or month
3️⃣ Instantly view updated KPIs and charts
4️⃣ Identify renewal risks and high-value contracts
5️⃣ Share insights with management for quick action
Only basic Excel knowledge is required. The dashboard handles calculations and visuals automatically.
Who Can Benefit from This Refinery Contract Management Dashboard 👥
🏭 Refinery Managers – Gain full visibility into contract exposure
📑 Contract Managers – Track renewals, durations, and contract status
📦 Procurement Teams – Monitor vendor contracts and values
💰 Finance Teams – Control contract spending and revenue risks
⚙️ Operations & Compliance Teams – Improve governance and accountability
Whether managing a single refinery or multiple locations, this dashboard scales with your needs.


Reviews
There are no reviews yet.