In today’s volatile financial environment, managing Treasury Operations Dashboard in Excel using disconnected spreadsheets and manual reports is no longer sustainable. Cash positions change daily, interest income and expenses fluctuate across entities and regions, and liquidity risks continue to rise due to market uncertainty. Without a structured system, finance teams struggle to maintain visibility and control. That is exactly why the Treasury Operations Dashboard in Excel is an essential digital product for modern finance and treasury teams.
This ready-to-use Excel dashboard transforms raw treasury data into a clear, interactive, and visual reporting system. Instead of maintaining multiple files for cash flow, liquidity, interest income, expenses, and counterparty exposure, this dashboard consolidates everything into one centralized Excel solution. As a result, treasury managers, CFOs, and finance controllers gain faster insights, better control, and confident decision-making.
Because the dashboard is built entirely in Microsoft Excel, organizations do not need expensive treasury systems or complex IT support. It works seamlessly with existing Excel-based data and can be adopted quickly across teams.
🔑 Key Features of Treasury Operations Dashboard in Excel
💡 Centralized Treasury Visibility – Monitor cash inflows, outflows, liquidity position, interest income, and expenses in one dashboard.
💡 Interactive Slicers – Filter treasury performance by entity, region, counterparty, and time period instantly.
💡 Executive KPI Cards – View critical treasury metrics at a glance for faster decisions.
💡 Multi-Dimensional Analysis – Analyze performance across entities, regions, counterparties, and months.
💡 Automated Calculations – Reduce manual effort and errors with structured formulas and visuals.
📂 What’s Inside the Treasury Operations Dashboard in Excel
This professionally designed dashboard includes multiple structured worksheets, each focused on a specific treasury analysis area:
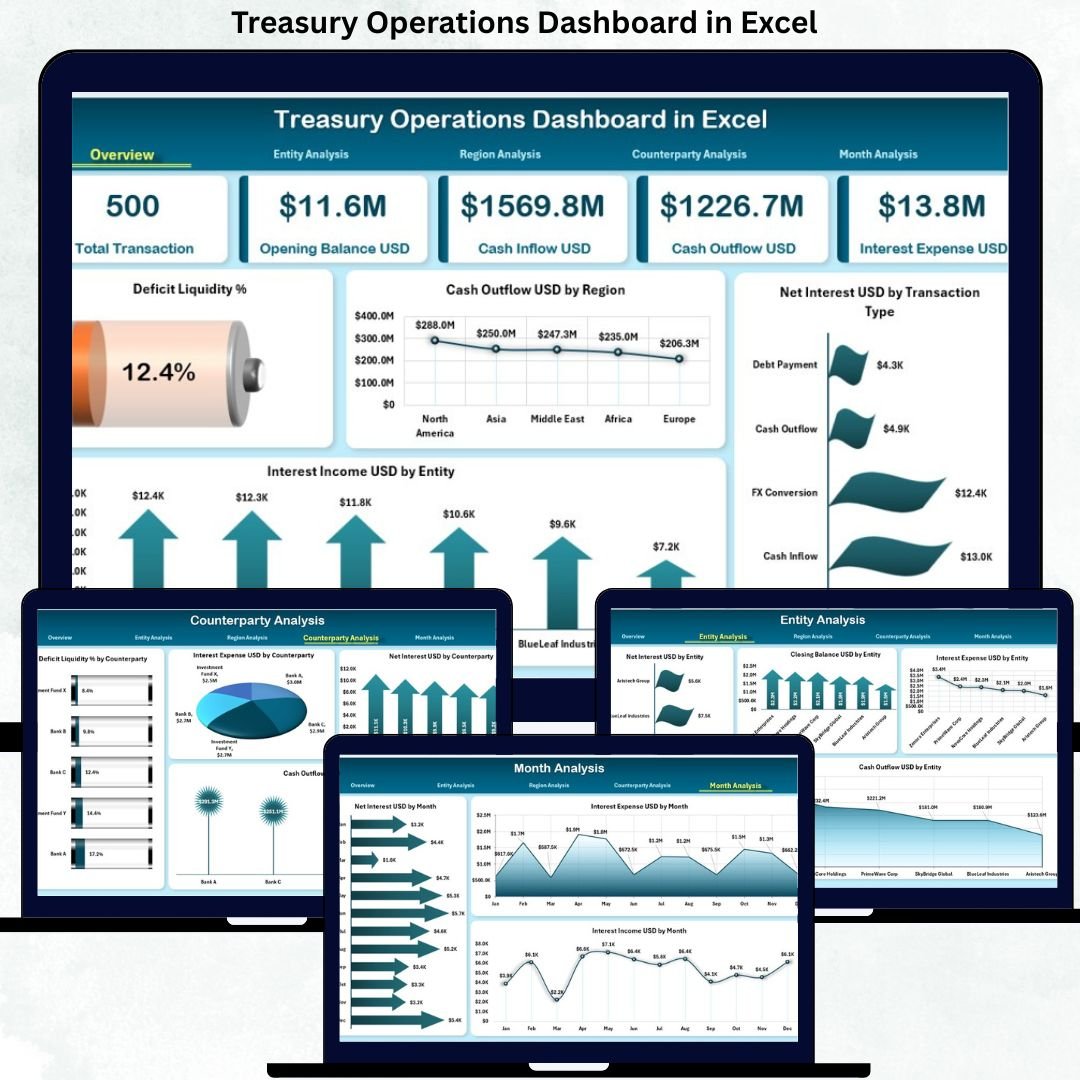
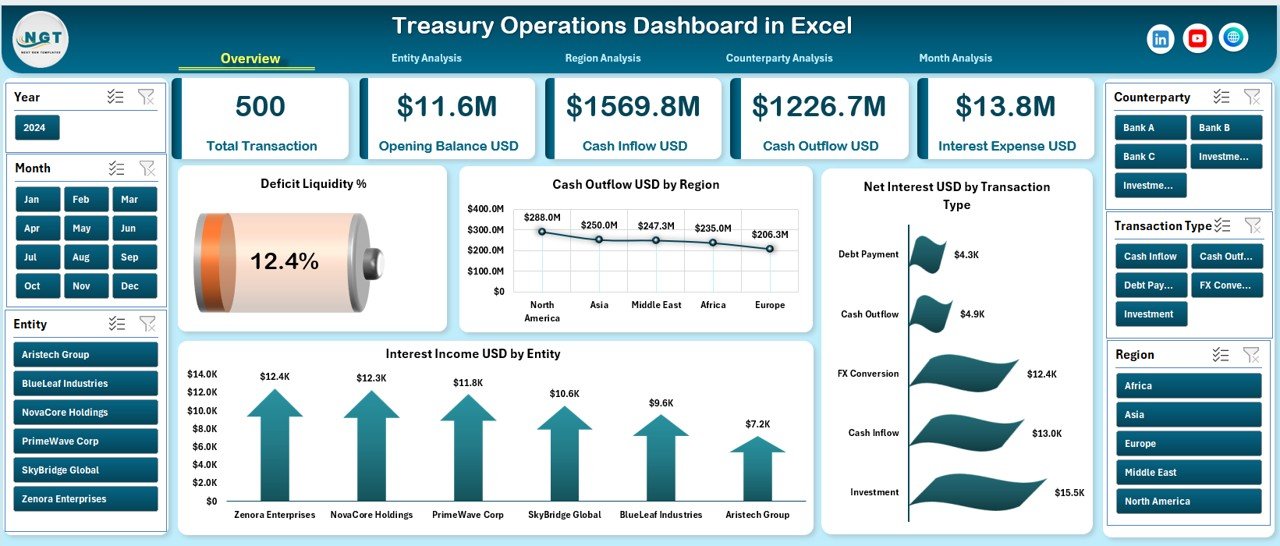
📊 Overview Page – Executive-level summary with KPI cards and charts such as Deficit Liquidity %, Cash Outflow by Region, Net Interest by Transaction, and Interest Income by Entity.
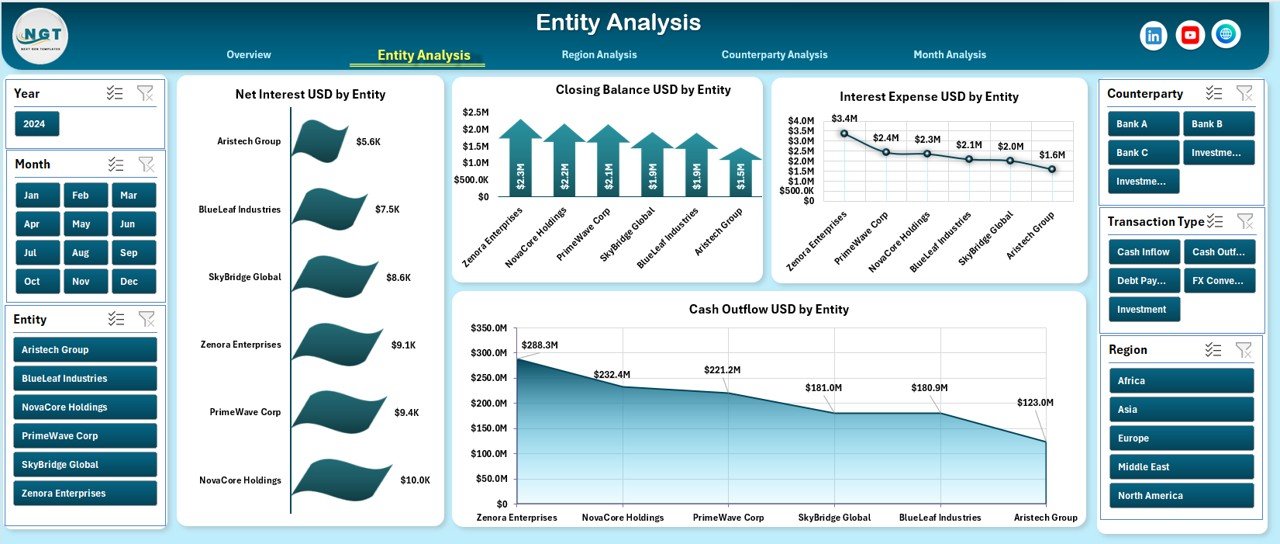
🏢 Entity Analysis Page – Compare Net Interest, Closing Balance, Interest Expenses, and Cash Outflow across entities.
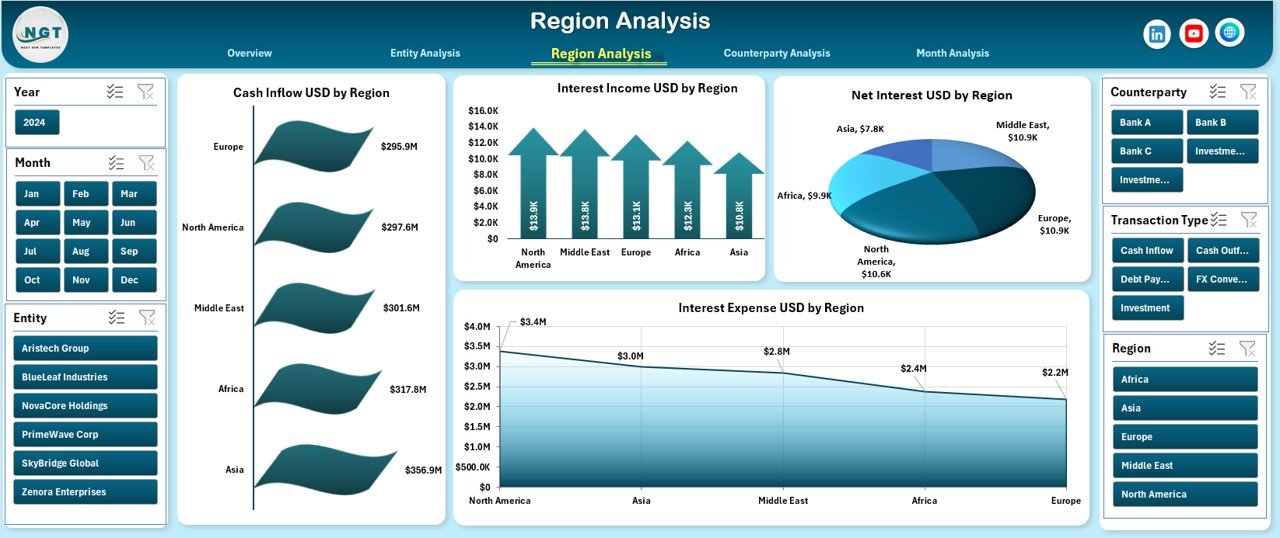
🌍 Region Analysis Page – Track Cash Inflow, Interest Income, Net Interest, and Interest Expenses region-wise.
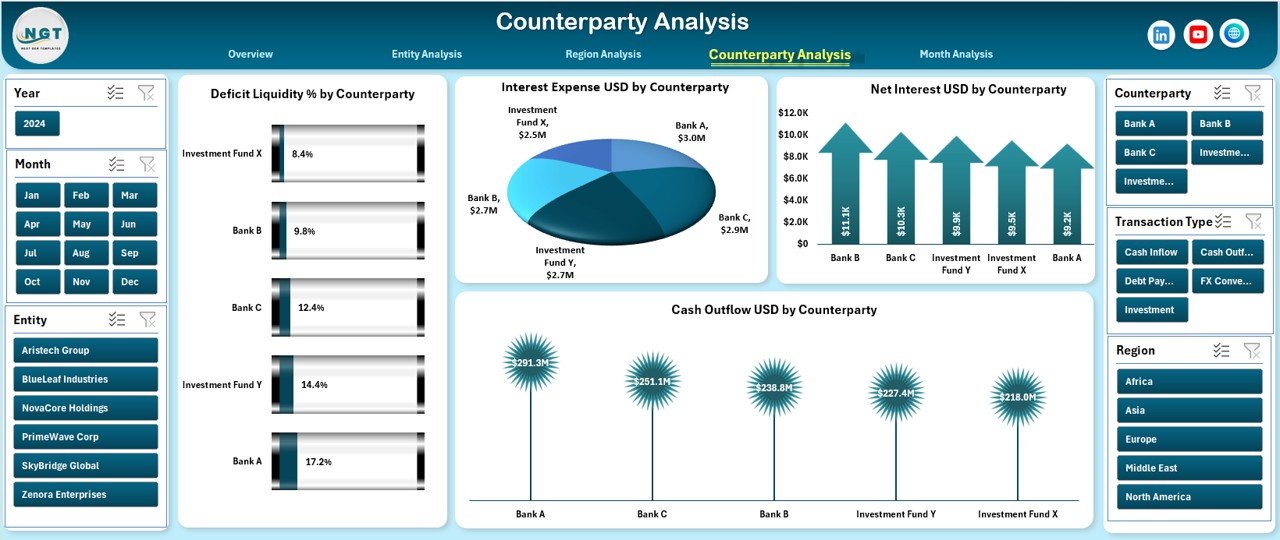
🤝 Counterparty Analysis Page – Monitor Deficit Liquidity %, Net Interest, Interest Expense, and Cash Outflow by counterparty to manage risk proactively.
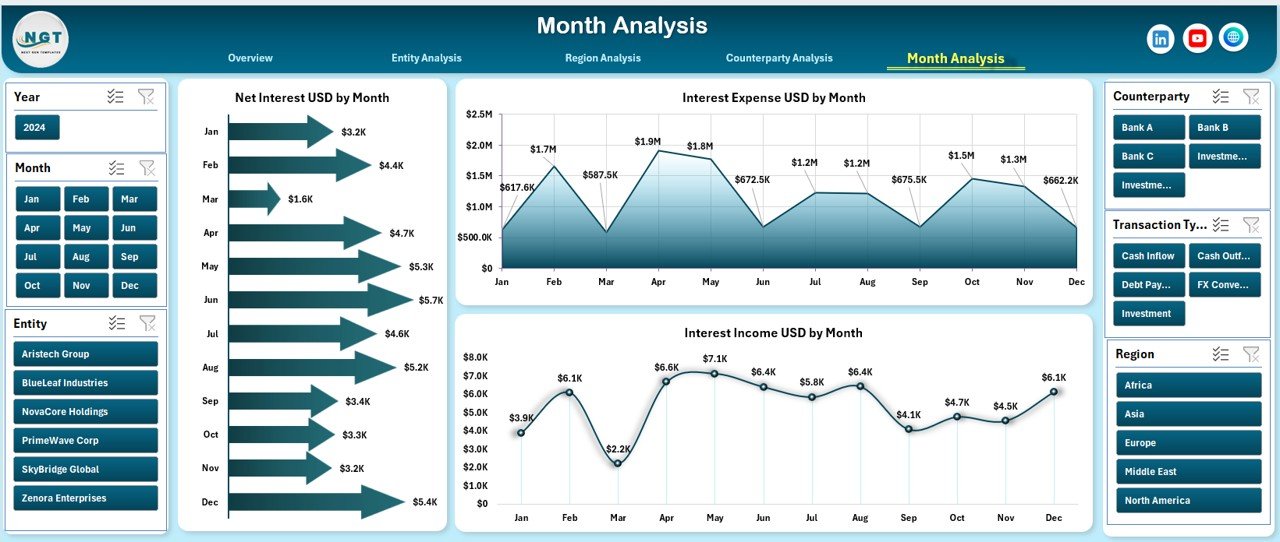
📅 Month Analysis Page – Identify trends using Net Interest, Interest Income, and Interest Expense by month.
📄 Data Sheet – Central repository for all raw treasury transactions and metrics.
⚙️ Support Sheet – Lookup tables and helper calculations to keep the dashboard accurate and scalable.
Each sheet is logically structured, easy to navigate, and designed for real-world treasury workflows.
▶️ How to Use the Treasury Operations Dashboard in Excel
Using this dashboard is straightforward and practical:
1️⃣ Enter or paste treasury data into the Data Sheet.
2️⃣ Review automated calculations and mappings from the Support Sheet.
3️⃣ Navigate between pages using the built-in page navigator.
4️⃣ Apply slicers to filter data by entity, region, counterparty, or month.
5️⃣ Analyze KPIs, charts, and trends to identify risks and opportunities.
No advanced Excel skills are required—basic Excel knowledge is enough to use this dashboard effectively.
👥 Who Can Benefit from This Treasury Operations Dashboard in Excel
This dashboard is ideal for:
💼 Treasury Managers
📊 Finance Controllers
🏦 CFOs & Finance Directors
⚠️ Risk Management Teams
📈 Corporate Finance Analysts
🔍 Internal Auditors
Each stakeholder gains better visibility, improved control, and actionable treasury insights.
### 👉 Click here to read the Detailed Blog Post
Visit our YouTube channel to learn step-by-step video tutorials.


Reviews
There are no reviews yet.