
Managing a sewage treatment plant requires accuracy, speed, and real-time performance tracking. From inflow volume to chemical consumption, every metric matters. Manual reporting often leads to delays, miscalculations, and poor visibility—making it difficult for managers to maintain compliance and operational efficiency. That’s why we created the Sewage Treatment KPI Dashboard in Excel, a ready-to-use, fully automated solution that transforms raw wastewater data into clean visuals, actionable insights, and instant KPI updates.
With just a single month selection from a dropdown, your entire dashboard refreshes automatically. This makes tracking MTD (Month-to-Date) and YTD (Year-to-Date) performance easier than ever. Whether you’re monitoring BOD removal efficiency, sludge output, downtime, or cost-related KPIs, this dashboard brings everything together in a structured and user-friendly format. It eliminates the need for multiple spreadsheets and provides a simple, powerful reporting system suitable for both small and large treatment plants.
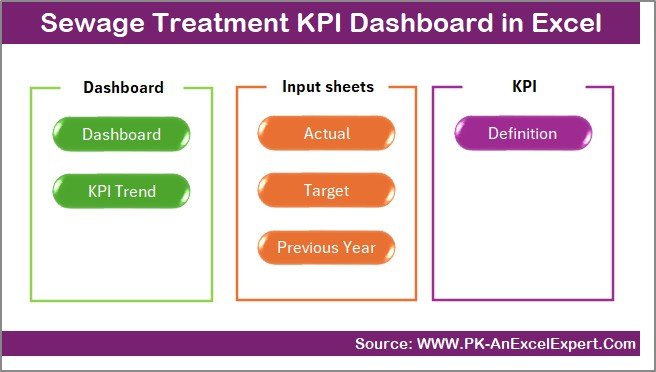
This dashboard includes 7 essential worksheets: Summary Page, Dashboard View, Trend Sheet, Actual Input Sheet, Target Sheet, Previous Year Data Sheet, and KPI Definition Sheet. Each is designed with automation, clarity, and accuracy in mind—ensuring smooth data entry, faster decisions, and complete operational visibility.
✨ Key Features of the Sewage Treatment KPI Dashboard in Excel
-
📊 Instant Monthly Refresh: Select a month and the entire dashboard updates automatically.
-
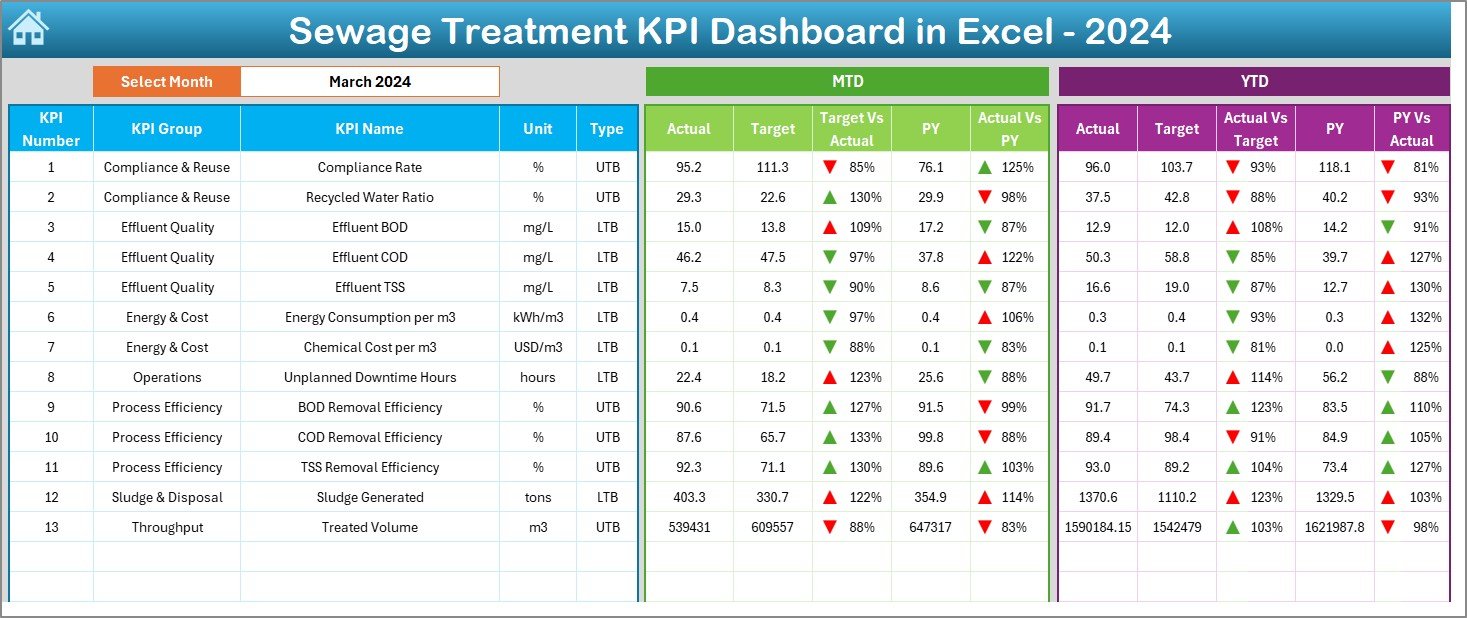
⚡ MTD & YTD Performance: Track present performance vs targets and previous-year values.
-
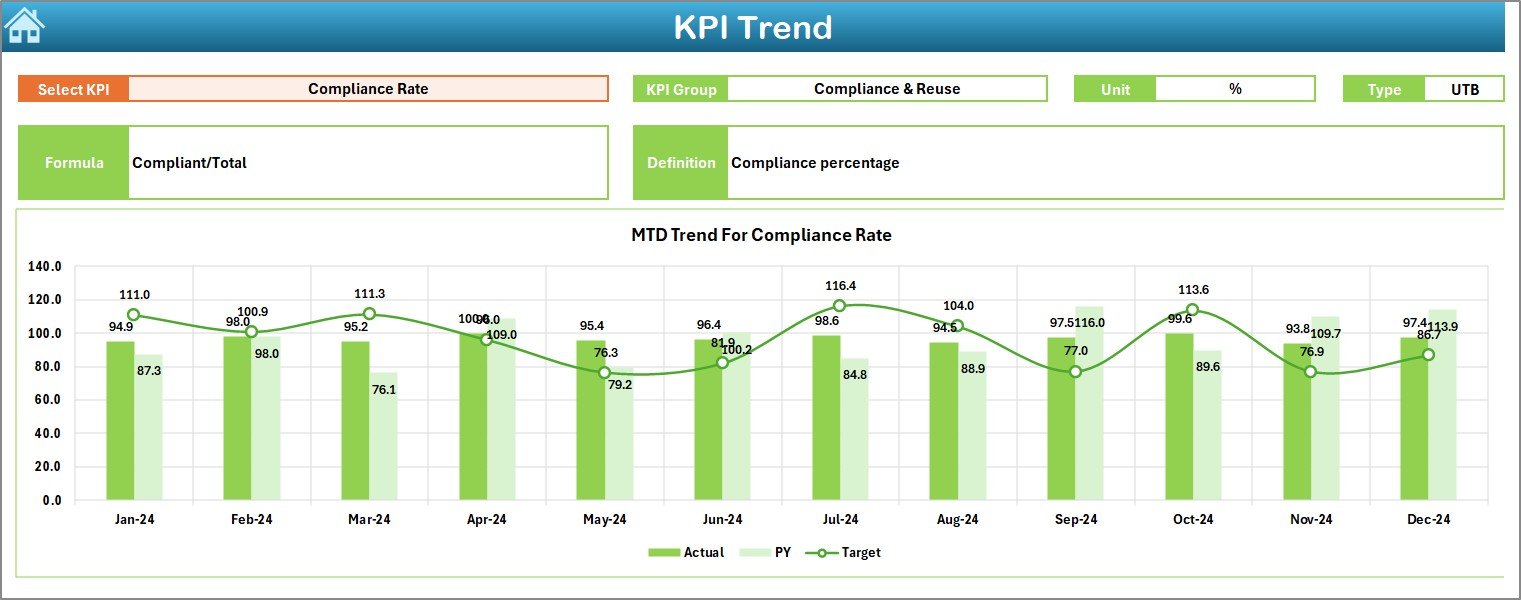
📈 Trend Analysis Charts: View improvements or issues across the entire year.
-
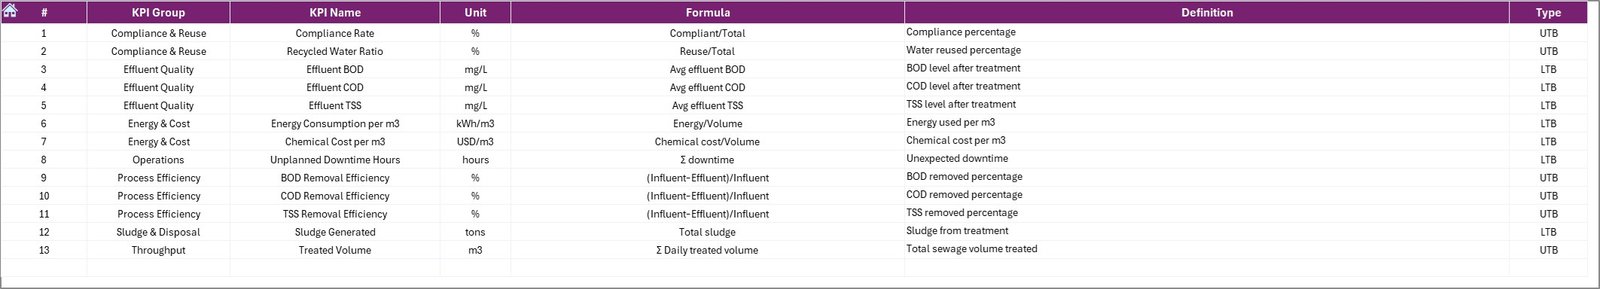
📘 KPI Dictionary Included: Every KPI is clearly defined with formulas and units.
-
🏭 Complete Plant-Level Overview: From inflow to treated output, track all essential KPIs.
-
🎯 Target Monitoring: Compare Actual vs Target with visual arrows for quick interpretation.
-
🔧 Smart Data Entry Sheets: Structured tables reduce errors and speed up monthly updates.
📦 What’s Inside the Sewage Treatment KPI Dashboard in Excel
-
Summary Page: Easy navigation using six dashboard shortcut buttons.
-
Dashboard Page: MTD & YTD cards, target comparisons, conditional formatting arrows.
-
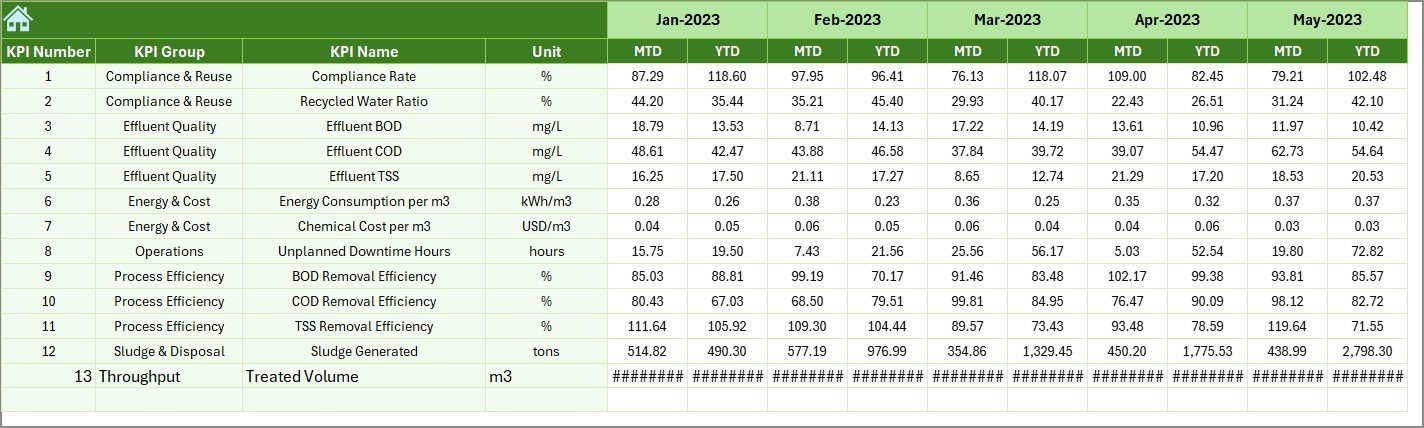
Trend Sheet: KPI-wise monthly charts with definitions, formula references, and type (UTB/LTB).
-
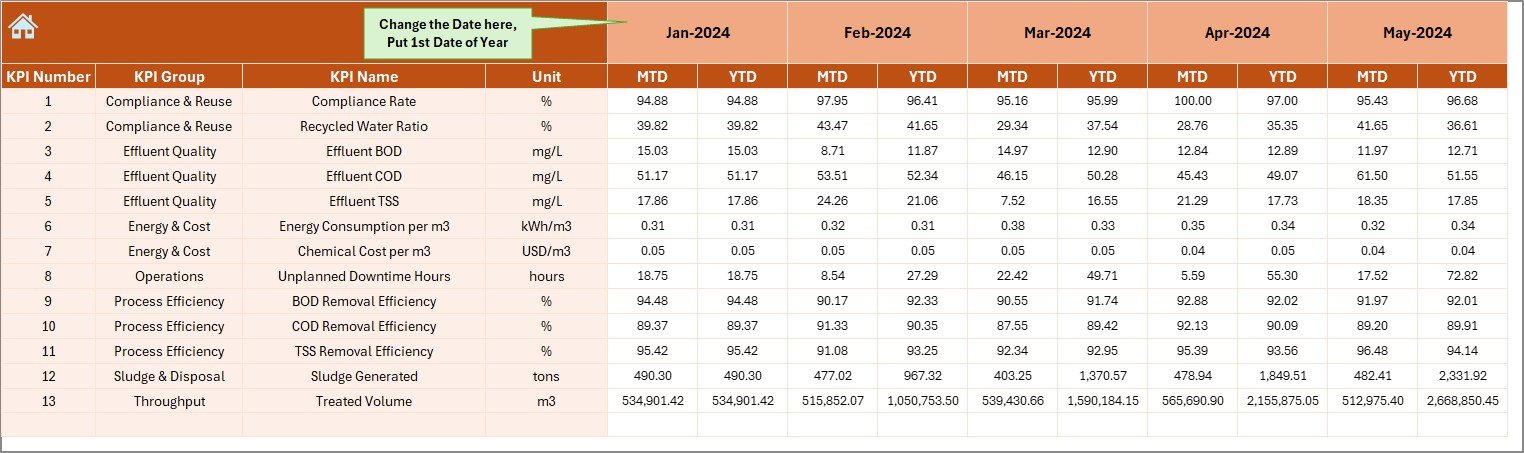
Actual Numbers Input Sheet: Enter monthly MTD & YTD values effortlessly.
-
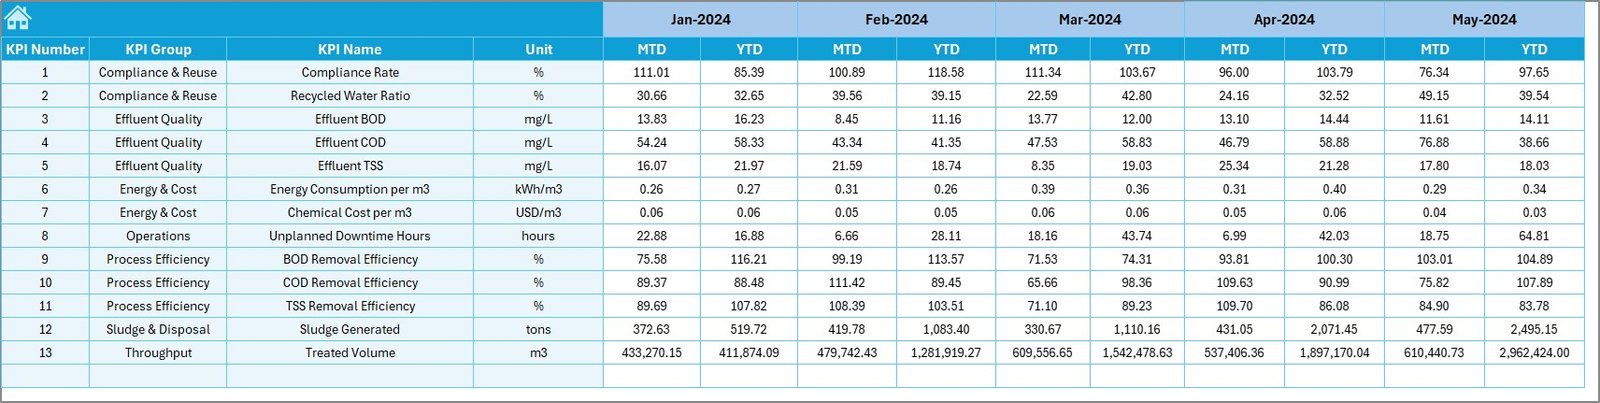
Target Sheet: Set departmental monthly performance targets.
-
Previous Year Sheet: Compare current performance with historical data.
-
KPI Definition Sheet: Your complete master list of KPIs for clarity and consistency.
These elements work together to create a powerful reporting system that saves time, enhances accuracy, and offers unmatched decision-making support for sewage treatment operations.
🛠️ How to Use the Sewage Treatment KPI Dashboard in Excel
-
Enter your monthly MTD & YTD values in the Actual Input Sheet.
-
Update targets on the Target Sheet based on your plant’s goals.
-
Fill previous-year data to enable complete comparisons.
-
Review KPI definitions for clarity and consistency.
-
Select a month on the Dashboard page to refresh all visuals.
-
Analyze trends monthly using the Trend Sheet’s charts and KPI details.
Because everything is automated, you only update the input sheets—everything else updates instantly.
👥 Who Can Benefit from This Sewage Treatment KPI Dashboard in Excel
-
🏭 Operations Teams: Monitor plant inflow, output, and real-time process quality.
-
🔧 Maintenance Teams: Track equipment breakdowns, downtime, and preventive actions.
-
🧪 Quality Control Teams: Manage BOD, COD, turbidity, and treated water quality.
-
📊 Management & Leadership: Get plant-wide visibility for better compliance and decision-making.
-
📈 Consultants & Analysts: Use ready-to-analyze KPIs for performance improvement studies.
-
🧑🏫 Training & Skill Development Teams: Teach KPI monitoring using real dashboards.
This dashboard is designed for anyone looking for clarity, speed, efficiency, and reliable data-driven decision-making.
### Click here to read the detailed blog post
Watch the step-by-step video tutorial:


Reviews
There are no reviews yet.