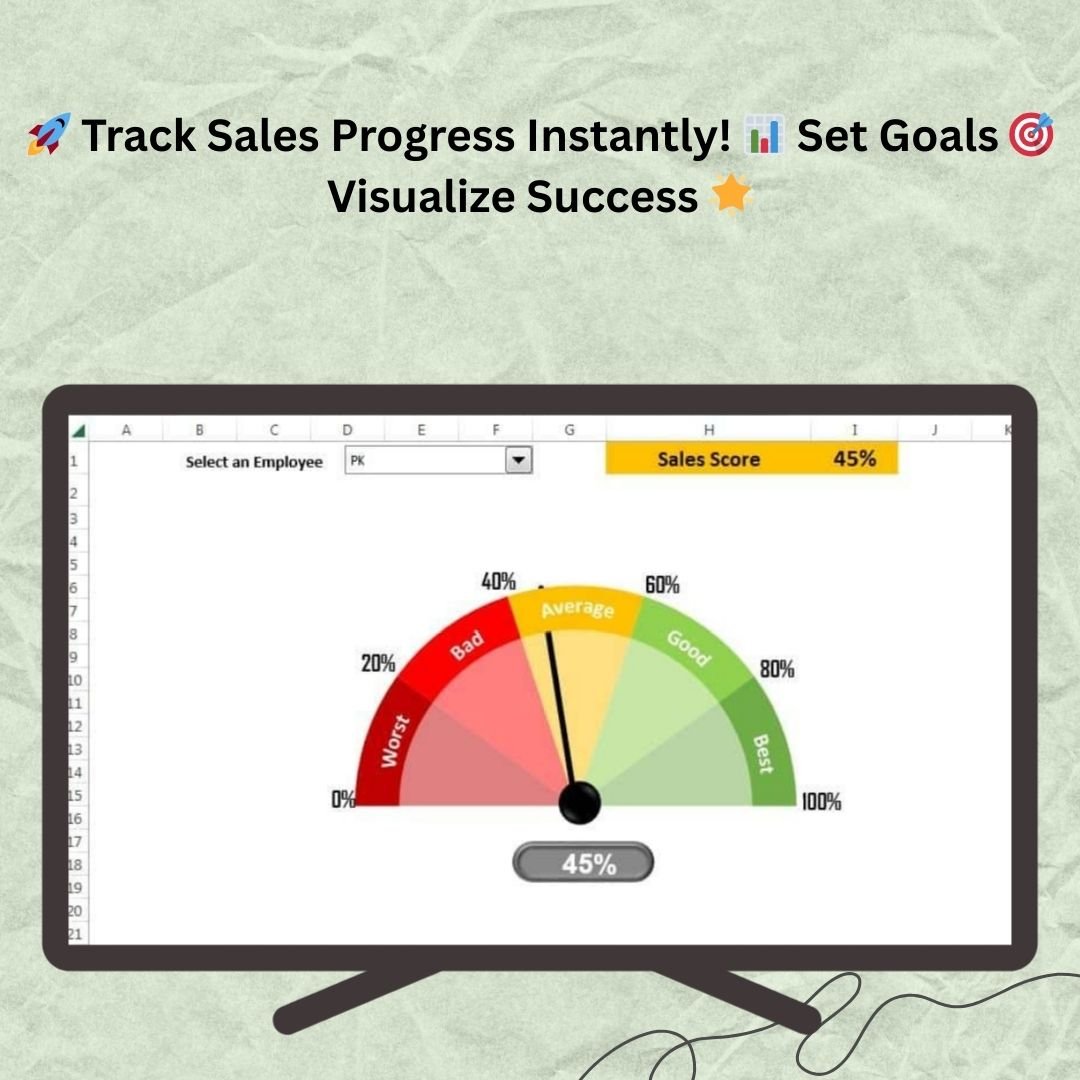
The Dynamic Sales Score Meter Chart in Excel is a visually stunning and interactive tool designed to track your sales performance in real-time. Whether you’re managing a sales team, running a business, or working on your own sales strategy, this Excel-based score meter chart helps you visualize and monitor your sales progress in an intuitive and dynamic way.
This dynamic tool allows you to set custom targets, monitor actual sales data, and visualize progress using a gauge-style chart. Perfect for sales managers, business owners, and marketing
teams, the chart will provide key insights into how well your sales are performing relative to your goals.
Key Features of the Dynamic Sales Score Meter Chart in Excel
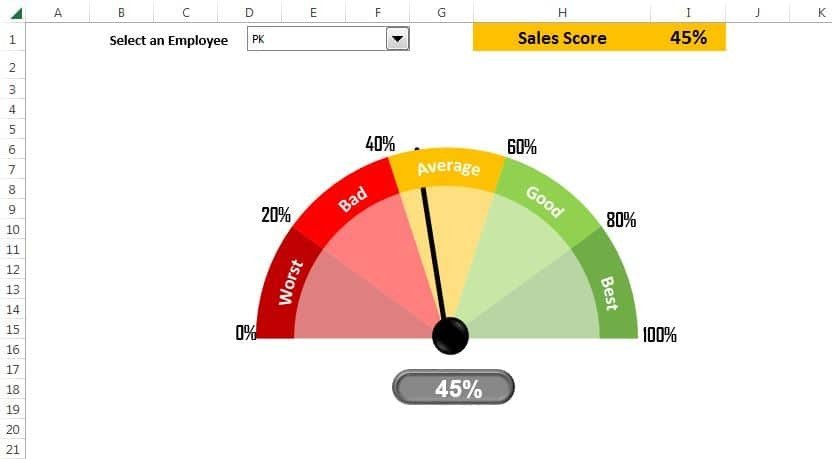
📊 Dynamic Gauge Chart: Display your sales data in an interactive gauge meter format, providing an at-a-glance view of your performance.
⚙️ Customizable Targets: Set custom sales targets and compare actual sales performance against those targets.
📈 Real-Time Data Tracking: Input actual sales numbers to dynamically update the chart and track progress instantly.
📉 Sales Progress Visualization: Clearly visualize how close you are to meeting your sales goals, with color-coded indicators to show progress.
💡 Performance Indicators: Use visual markers to track different stages of sales progress (e.g., poor, average, excellent).
📅 Goal and Deadline Tracking: Track your sales goals over specified time frames (monthly, quarterly, yearly).
🧑💼 User-Friendly Interface: Easy to navigate and update, ensuring you can manage and monitor sales performance with minimal effort.
Why You’ll Love This Dynamic Sales Score Meter Chart
✅ Interactive and Engaging: The dynamic gauge chart provides an engaging and visually appealing way to track and monitor sales.
✅ Customizable for Your Business: Adjust targets and input data specific to your business needs, whether you’re a small business or a large enterprise.
✅ Instant Performance Feedback: Get immediate visual feedback on your sales progress, helping you stay motivated and focused.
✅ Improves Accountability: Easily track sales performance against targets, ensuring better accountability for sales teams.
✅ Suitable for Any Sales Team: Perfect for individual business owners, marketing teams, or large sales departments.
What’s Inside the Dynamic Sales Score Meter Chart?
📊 Gauge Chart Representation: See your sales performance in a clean, visually appealing meter-style chart.
⚙️ Customizable Sales Targets: Set your own sales targets and measure progress dynamically.
📈 Real-Time Sales Data: Input actual sales numbers and instantly see progress toward your goals.
📉 Sales Performance Tracking: Track progress with visual indicators for each stage of sales performance.
📅 Time-Based Goal Tracking: Set specific time frames to track and compare sales performance over different periods.
How to Use the Dynamic Sales Score Meter Chart
1️⃣ Download the Template – Get the Excel file immediately upon purchase.
2️⃣ Set Your Sales Targets – Enter your target sales numbers and set goals for different time periods.
3️⃣ Input Actual Sales Data – Track actual sales numbers and watch the chart update dynamically.
4️⃣ Monitor Sales Progress – Check your performance against targets and visualize sales progress.
5️⃣ Adjust Goals as Needed – Use the tool to adjust targets based on performance and market conditions.
Who Can Benefit from the Dynamic Sales Score Meter Chart?
🔹 Sales Managers
🔹 Business Owners
🔹 Sales Teams
🔹 Marketers
🔹 Entrepreneurs
🔹 Small and Medium Businesses (SMBs)
Track, analyze, and visualize your sales performance like never before with this dynamic and interactive sales score meter chart in Excel.
Click here to read the detailed blog
Visit our YouTube channel to learn step-by-step video tutorials


Reviews
There are no reviews yet.