Academic publishing involves multiple steps—submission, review, editing, proofs, acceptance, and final publication. Academic Publishing KPI Dashboard in Excel Each step carries important deadlines and measurable indicators. When teams work with scattered spreadsheets and manually updated reports, delays become unavoidable. Editors struggle to track workloads, reviewers lose visibility, and publication managers find it difficult to measure month-wise and year-wise improvements.
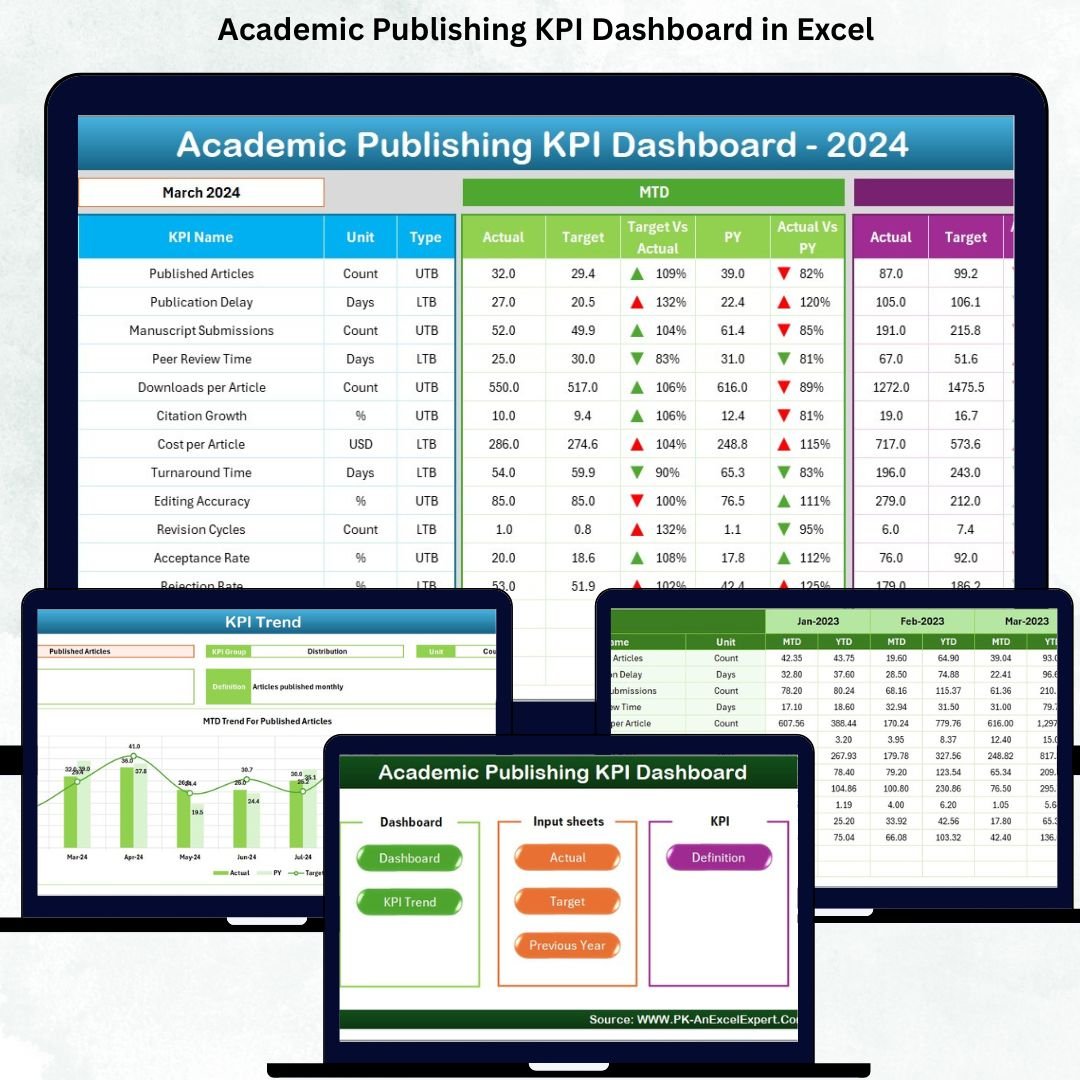
To solve these challenges, we created the Academic Publishing KPI Dashboard in Excel—a powerful, smart, and easy-to-use reporting system designed specifically for academic journals, editorial teams, and research publication departments. It brings all KPIs into one place, helps teams compare performance, and offers complete transparency across the publishing lifecycle.
Since the dashboard works entirely inside Excel, you don’t need Power BI, coding, or technical knowledge. Academic Publishing KPI Dashboard in Excel Simply update your Actual, Target, and Previous Year numbers—Excel auto-refreshes the entire dashboard using prebuilt formulas, dropdowns, and dynamic charts. Academic Publishing KPI Dashboard in Excel This makes the dashboard ideal for editors, publishers, reviewers, university departments, and research teams who want fast and accurate insights.
Let’s explore the complete features and benefits of this powerful template 👇
✨ Key Features of the Academic Publishing KPI Dashboard in Excel
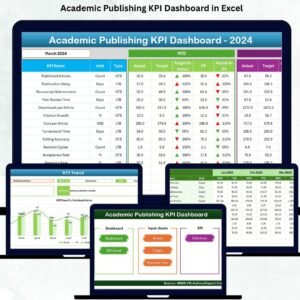
📘 Tracks All Major Publishing KPIs in One Place
Monitor submission volume, acceptance rate, review turnaround time, proofreading quality, editor workload, publication delays, and more.
📅 Dynamic Month Selection
Choose any month from the dropdown—MTD and YTD numbers update instantly.
🟢🔴 Performance Icons for Quick Interpretation
Green ▲ = Good performance
Red ▼ = Needs attention
These conditional arrows help you identify strengths and gaps at a glance.
📈 MTD & YTD Comparison
Instantly compare Actual vs Target vs Previous Year for both month-to-date and year-to-date performance.
📊 Trend Charts for Deeper Insights
Two trend charts display MTD and YTD behavior across months—perfect for review meetings.
🧭 Navigation Buttons for Easy Access
The Home Sheet lets you move between dashboard pages with one click.
📝 Fully Editable KPI Definition Sheet
View and customize KPI formulas, definitions, units, and types (UTB/LTB) anytime.
🧮 Excel-Based Workflow—No Technical Skills Needed
Just update Actual, Target, and PY sheets → Dashboard updates automatically.
📦 What’s Inside the Academic Publishing KPI Dashboard in Excel
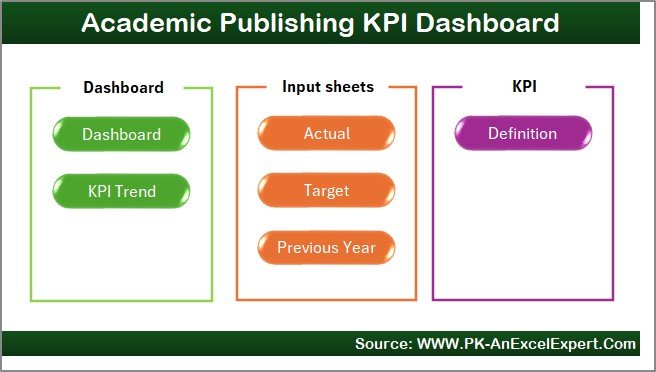
This digital product contains 7 structured worksheets; each designed for clarity and smooth reporting:
✔ Home Sheet – Quick Navigation
Six buttons let you jump to Dashboard, Trends, Actual, Target, PY, and Definition sheets instantly.
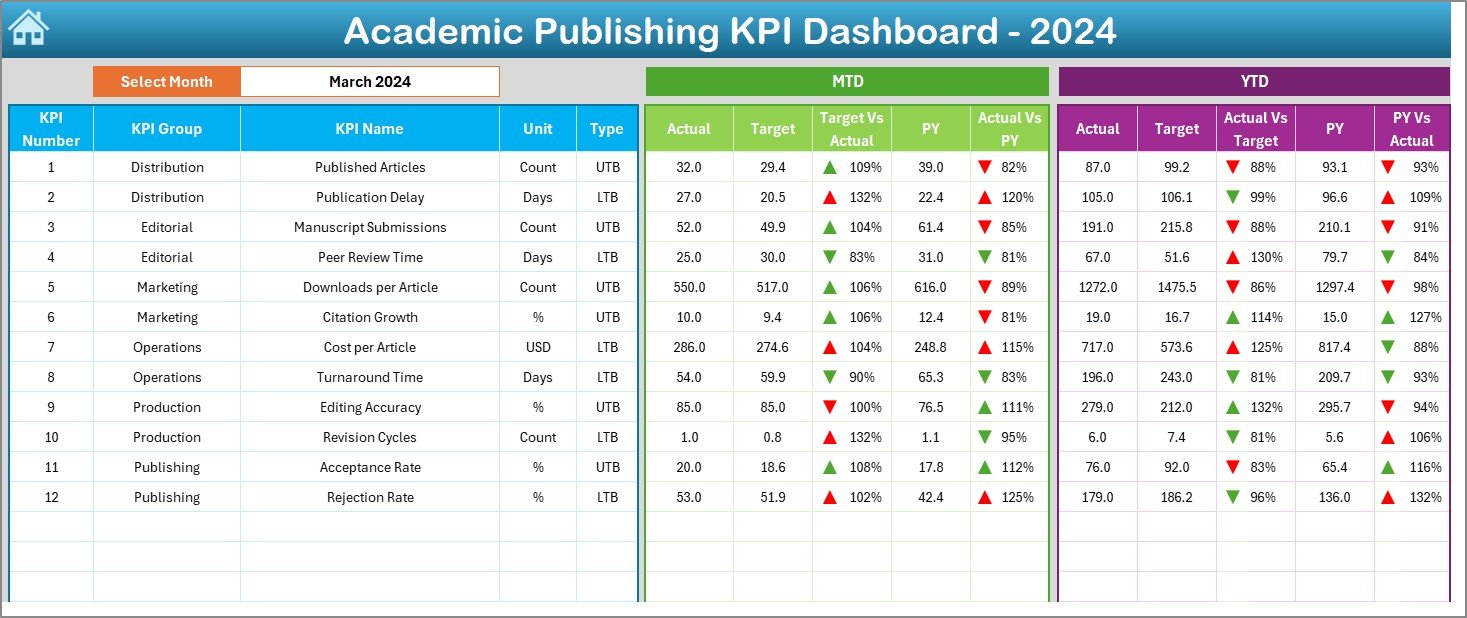
✔ Dashboard Sheet – Core Performance View
Shows:
-
MTD Actual, Target, PY
-
Target vs Actual %
-
CY vs PY %
-
YTD Actual, YTD Target, PY YTD
-
Conditional arrows & performance insights
This is the central hub for all KPI monitoring.
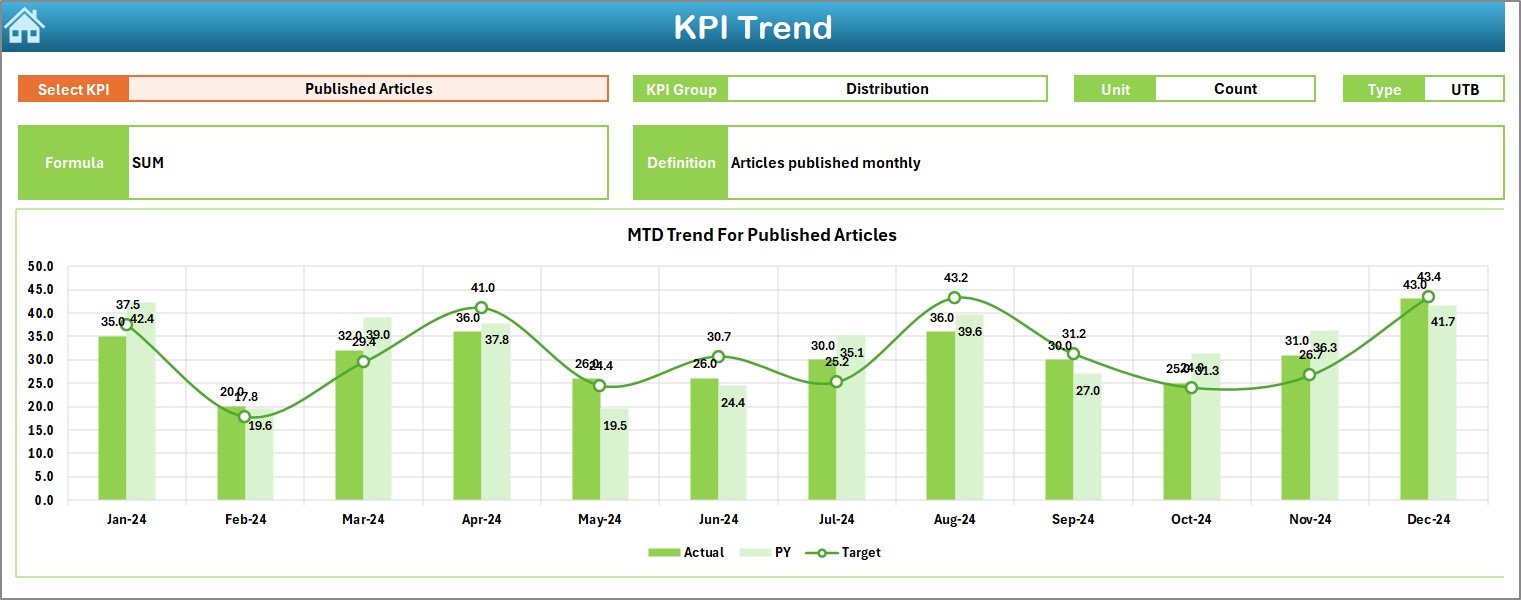
✔ KPI Trend Sheet – Month wise & Year wise Charts
Choose a KPI name and view:
-
KPI Group
-
KPI Type
-
Unit
-
Formula
-
Definition
-
MTD Trend Chart
-
YTD Trend Chart
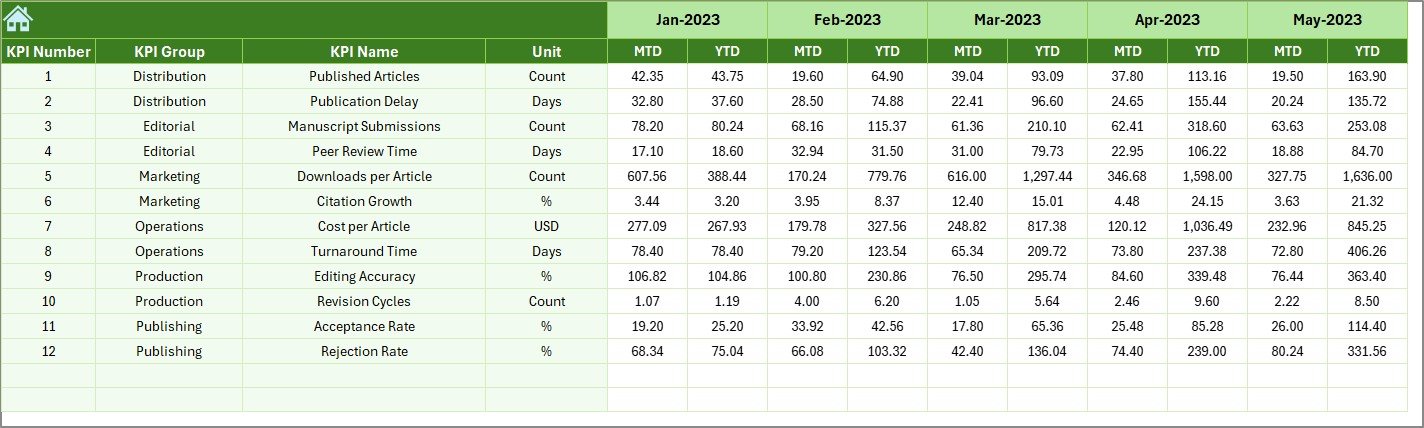
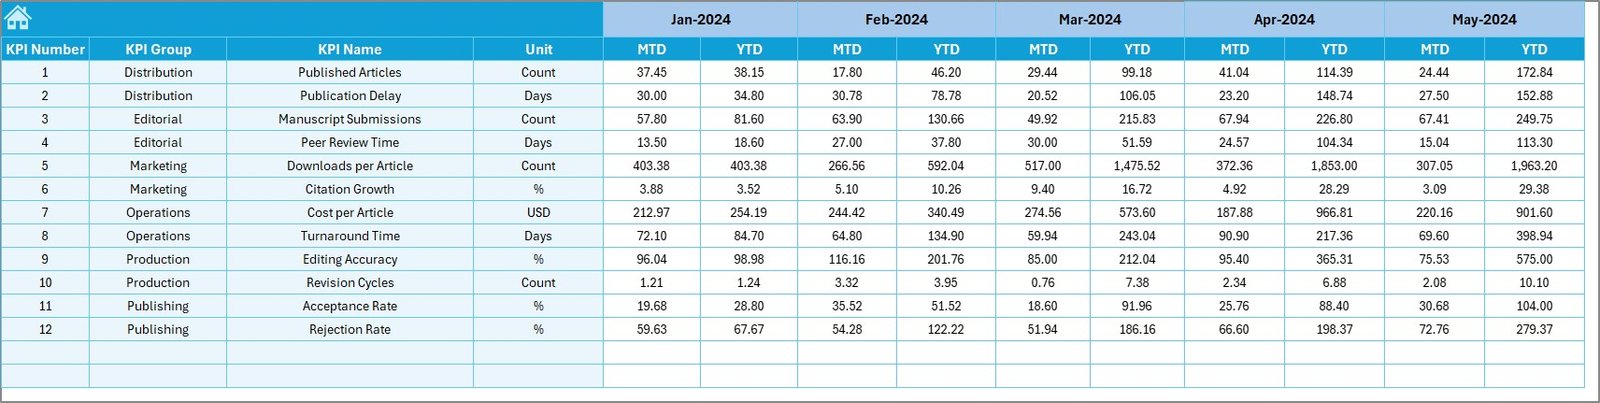
✔ Actual Numbers Input Sheet – Enter Actual Values
Input MTD & YTD values for each KPI.
Update the first month in cell E1 to shift the financial/calendar year.
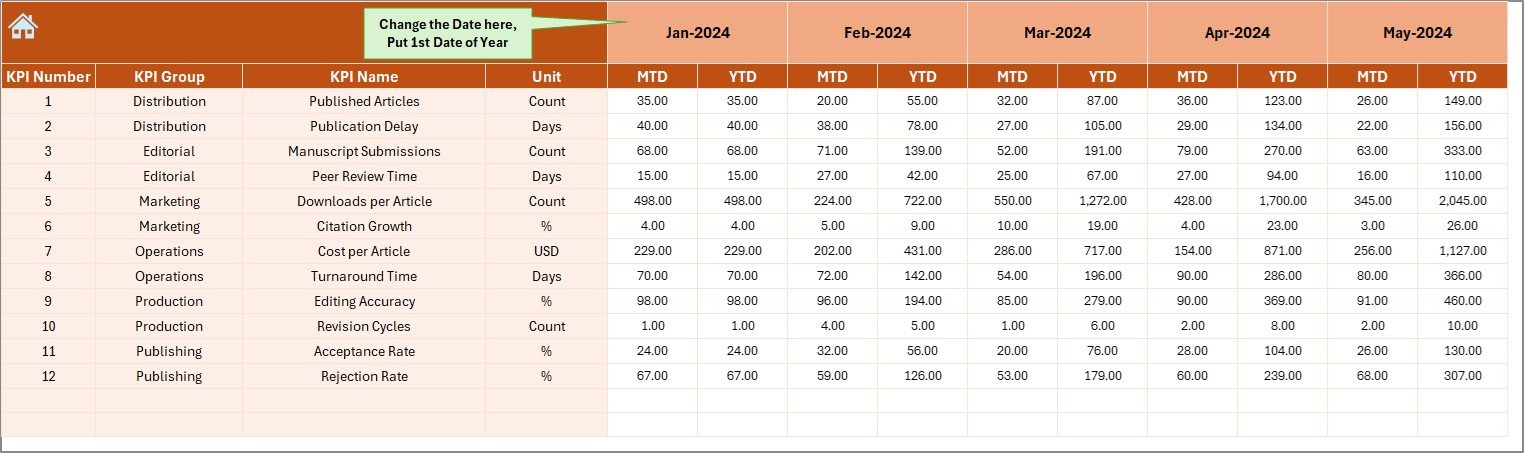
✔ Target Sheet – Set Publishing Goals
Enter monthly MTD and YTD targets for each KPI.
✔ Previous Year Sheet – Essential for CY vs PY Comparison
Stores last year’s MTD and YTD values to help analyze growth and performance improvements.
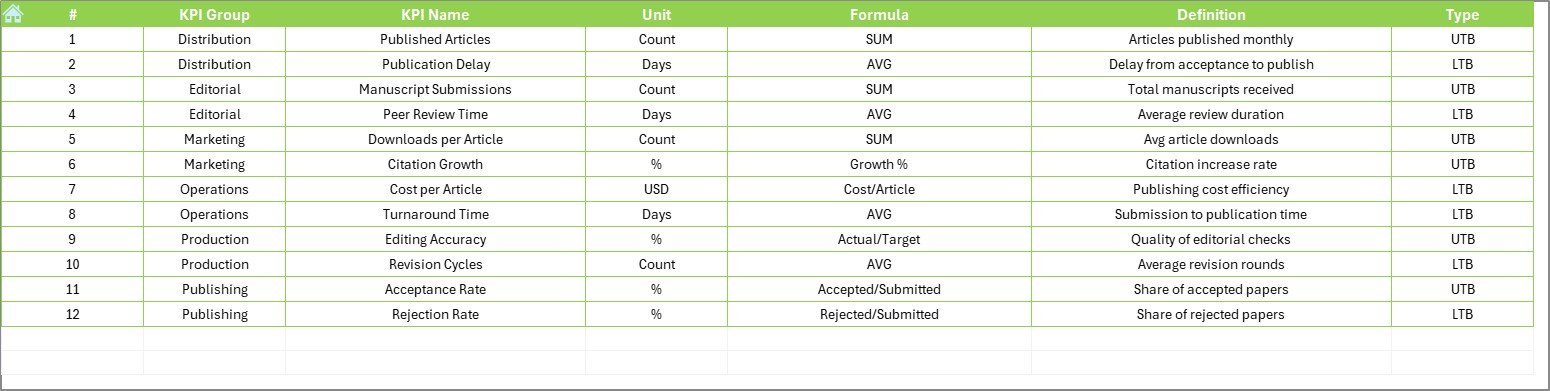
✔ KPI Definition Sheet – Complete KPI Documentation
Includes formulas, definitions, units, and types for all KPIs.
Easily add more KPIs as your publication process evolves.
🛠 How to Use the Academic Publishing KPI Dashboard in Excel
Using the dashboard is extremely simple:
➤ Step 1: Enter Actual data in the Actual Numbers sheet
(MTD & YTD values)
➤ Step 2: Enter Targets in the Target Sheet
➤ Step 3: Update Previous Year numbers in the PY Sheet
➤ Step 4: Go to the Dashboard Sheet
Choose the month → Review MTD & YTD performance
➤ Step 5: Open KPI Trend Sheet
Select KPI Name → View detailed trend charts
➤ Step 6: Use Definitions Sheet for clarity
Understand KPI calculation and purpose
This workflow reduces reporting time and improves accuracy.
👥 Who Can Benefit from This Academic Publishing KPI Dashboard
This dashboard is ideal for teams responsible for research publishing, editorial work, and academic performance tracking:
📘 Academic Journals & Publishers
Track submission cycles, quality, performance, and timelines.
📚 University Research Departments
Monitor article processing, review timelines, and publication output.
✍ Editors & Managing Editors
Manage workloads, deadlines, and quality indicators.
👩🏫 Researchers & Authors
Gain clarity on publishing timelines and performance.
📝 Peer Review Teams
Track review speed, reviewer workload, and efficiency.
📊 Publication Management & Operations Teams
Get real-time visibility into KPI performance.
If your academic publishing process needs structure, transparency, and smart reporting, this dashboard is the perfect solution.


Reviews
There are no reviews yet.