
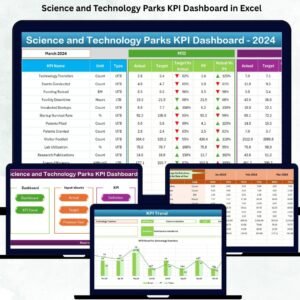
Science & Technology Parks (STPs) are the backbone of innovation, research, and technology-driven economic growth. Science and Technology Parks KPI Dashboard in Excel They support startups, incubators, advanced labs, technology transfer programs, community outreach, industry partnerships, and financial development initiatives. But with so many functions happening at the same time, tracking performance becomes extremely challenging—especially when data is scattered across multiple reports, emails, and Excel files.
To solve this, Science and Technology Parks KPI Dashboard in Excel we created the Science and Technology Parks KPI Dashboard in Excel — a complete performance monitoring system that converts complex data into clear insights. Science and Technology Parks KPI Dashboard in Excel This ready-to-use dashboard helps administrators, researchers, incubation teams, and management monitor MTD, YTD, target achievements, previous-year comparisons, and monthly trends, all in one place. Built entirely inside Excel, it requires zero technical skills and updates instantly as soon as you enter your data.
Science and Technology Parks KPI Dashboard in Excel Whether you manage research programs, incubation activities, facility operations, or industrial collaborations, this dashboard gives you the full picture in seconds. It brings transparency, accuracy, and clarity to STP performance tracking.
⭐ Key Features of the Science and Technology Parks KPI Dashboard in Excel
✨ MTD & YTD Tracking – Monitor monthly and yearly performance for every KPI.
📊 Smart Month Selector – Switch between months instantly and watch the dashboard auto-update.
📈 Trend Charts for Every KPI – Understand performance patterns for better planning.
📌 UP/DOWN Icons – Visual indicators clearly highlight achievements and deviations.
📁 User-Friendly Excel Input Sheets – Enter data easily without any complex formulas.
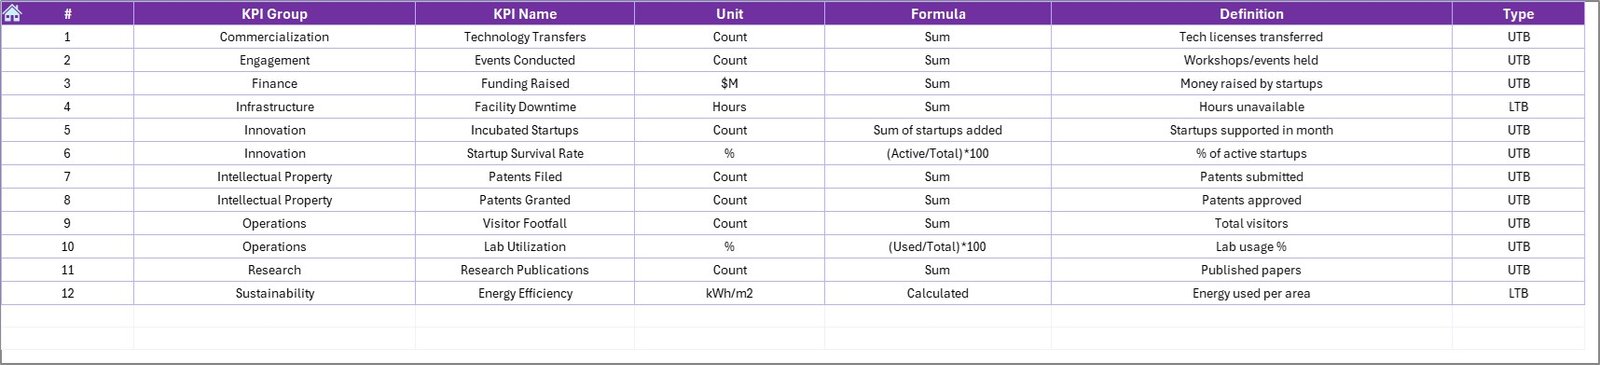
📑 Detailed KPI Definitions Page – Understand formula, type (UTB/LTB), and KPI meaning with clarity.
🧭 Home Navigation Sheet – Jump to Dashboard, Trend, or Input Sheets with one click.
With all these features combined, STPs get a powerful performance command center—right inside Excel.
⭐ What’s Inside the Dashboard?
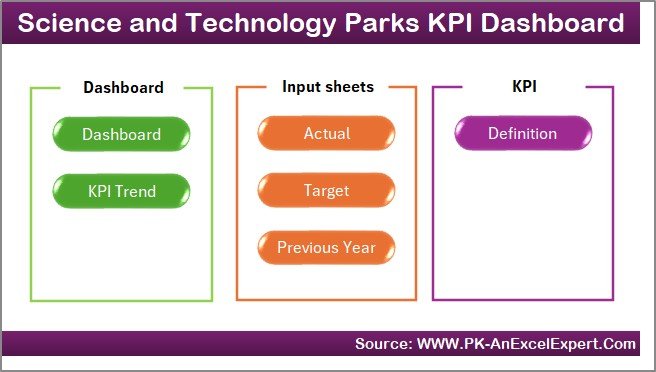
This dashboard includes seven professionally designed worksheets:
🟦 Home Sheet – A clean navigation center with buttons that take users directly to dashboard pages.

🟧 Dashboard Sheet – The heart of the system. It includes:
-
MTD Actual, MTD Target & PY MTD
-
YTD Actual, YTD Target & PY YTD
-
Conditional formatting indicators
-
Full breakdown of KPIs by group, unit, type, and category
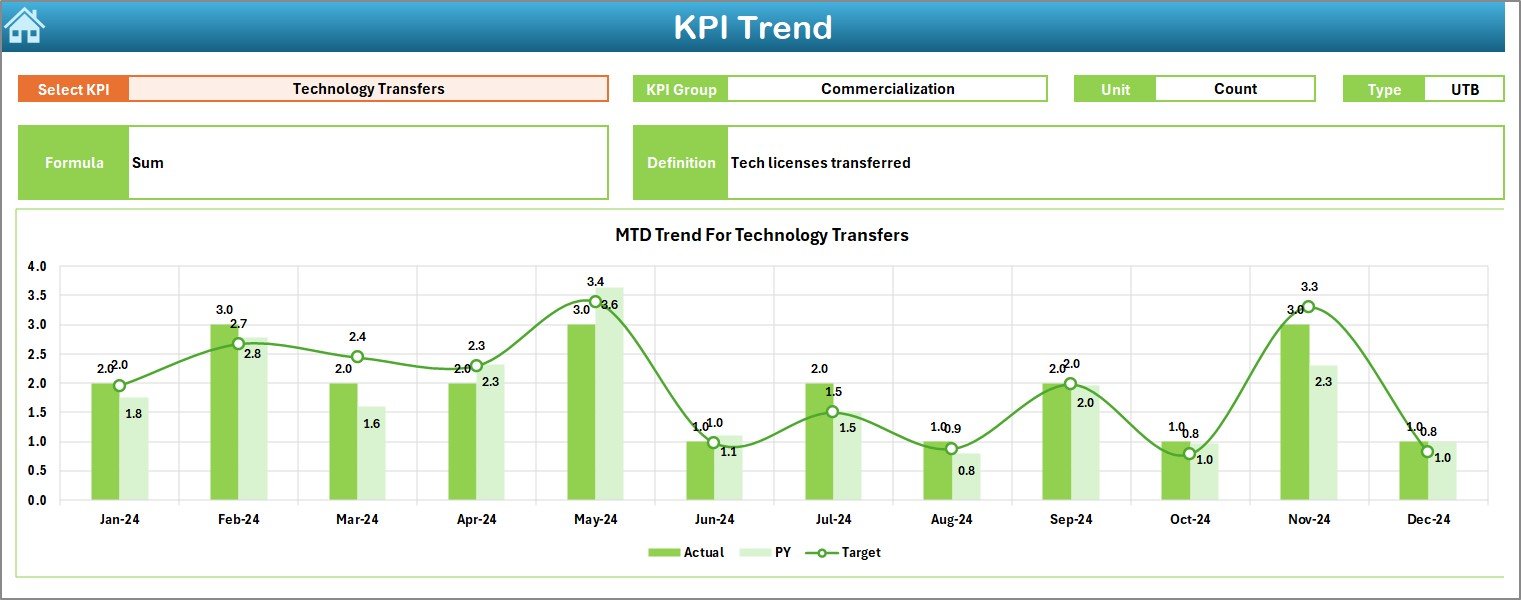
🟩 KPI Trend Sheet – View MTD & YTD trend charts for any KPI you select. Perfect for analyzing research output, incubation performance, facility usage, and financial progress.
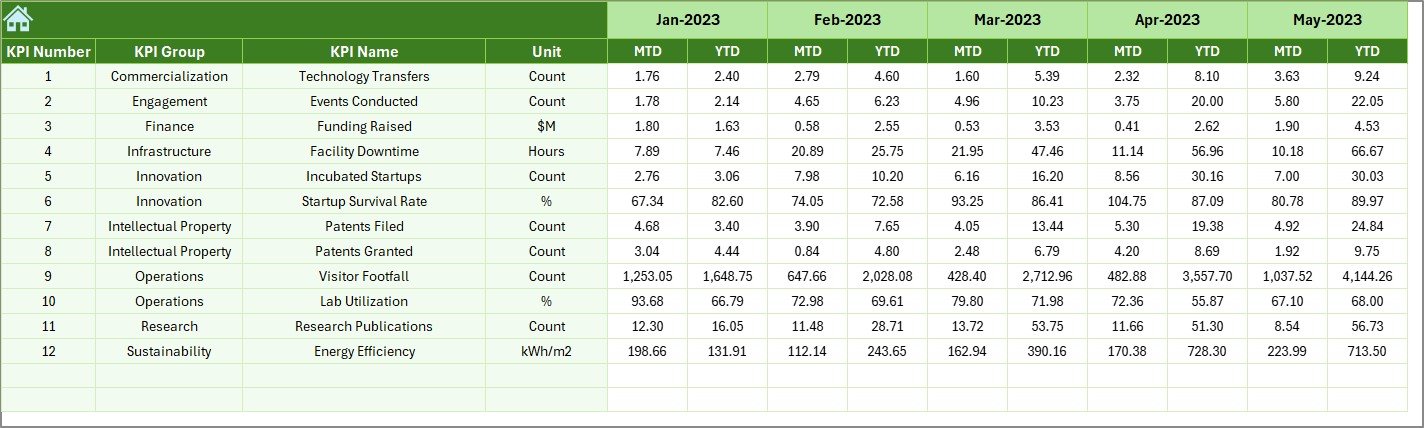
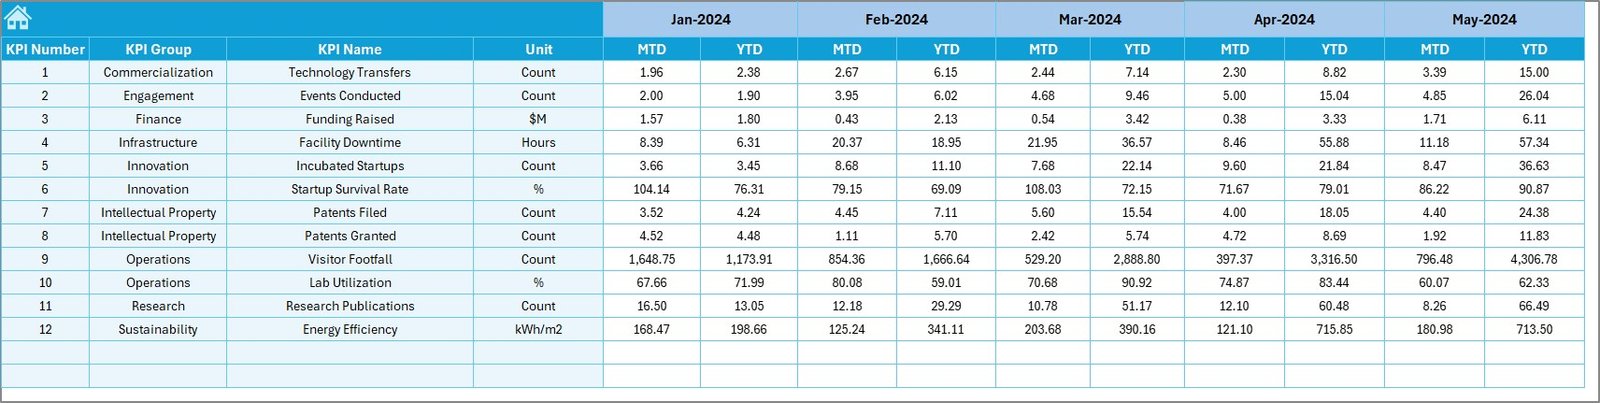
🟨 Actual Input Sheet – Enter MTD & YTD actual numbers for each KPI.
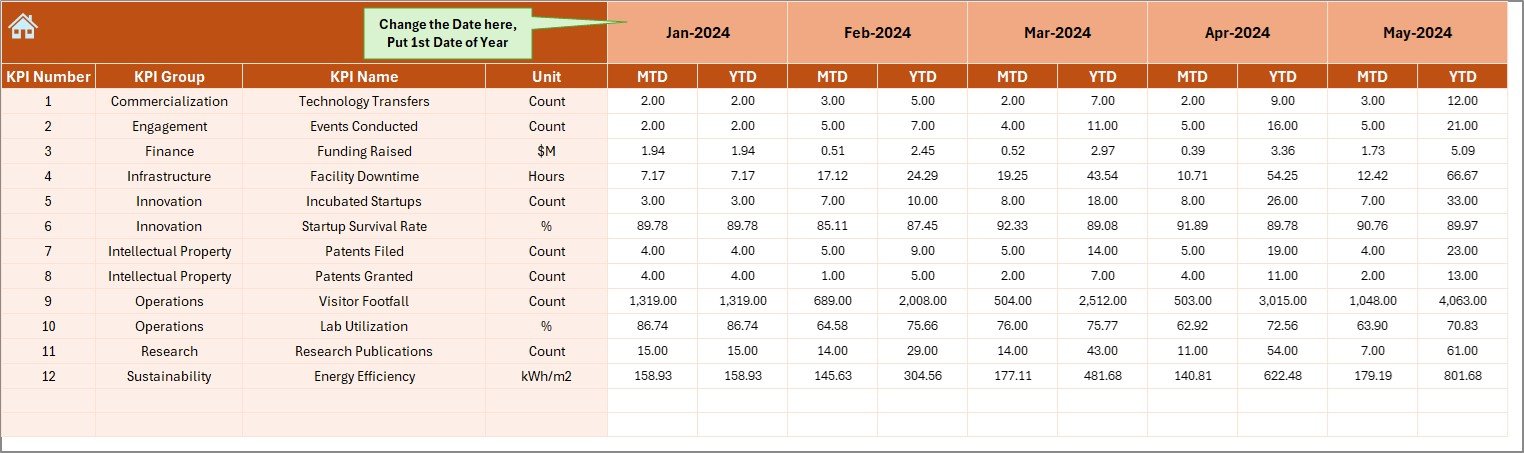
🟫 Target Sheet – Add monthly MTD and YTD target numbers.
⬜ Previous Year Numbers Sheet – Enter PY MTD/YTD values to support yearly comparison.
⬛ KPI Definition Sheet – Complete list of KPI formula, type, unit, and definition.
Everything updates automatically. No coding. No Power BI required. Just Excel.
⭐ How to Use the Science & Technology Parks KPI Dashboard
Using this dashboard is simple and beginner-friendly:
1️⃣ Enter Actual MTD & YTD numbers in the input sheet.
2️⃣ Fill MTD & YTD targets in the Target sheet.
3️⃣ Update previous-year values in the PY sheet.
4️⃣ Select the month from the drop-down on the Dashboard.
5️⃣ Review KPI performance using UP/DOWN indicators.
6️⃣ Open the Trend Sheet to study performance patterns.
7️⃣ Use the Definition Sheet to understand KPI meaning.
In just a few steps, leadership and teams get complete visibility.
⭐ Who Can Benefit from This Dashboard?
This Excel dashboard is designed for every department in a Science and Technology Park:
🧪 Research Teams – Track research output, publications, patents & projects.
🚀 Incubation Centers – Monitor startup numbers, funding raised & mentor hours.
🤝 Industry Partnerships Team – Measure collaboration, Moues, and joint programs.
💰 Finance Department – Track revenue, cost, budget utilization & funding.
🏭 Operations & Facility Team – Analyze lab utilization, energy consumption & asset uptime.
📈 STP Leadership – Get full-performance snapshots for better strategic decisions.


Reviews
There are no reviews yet.