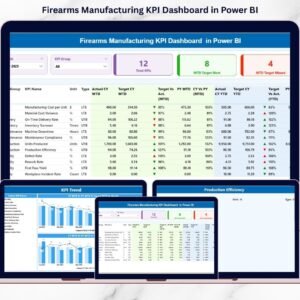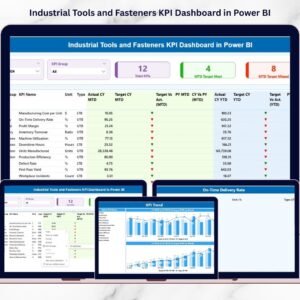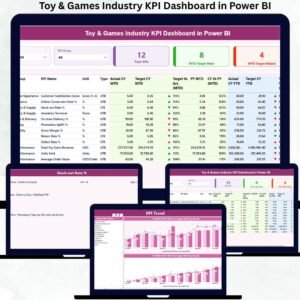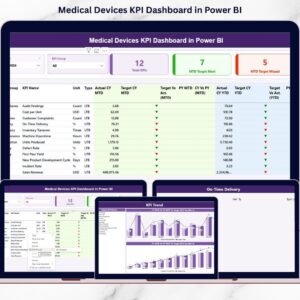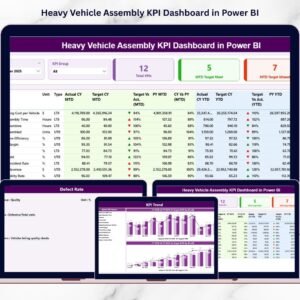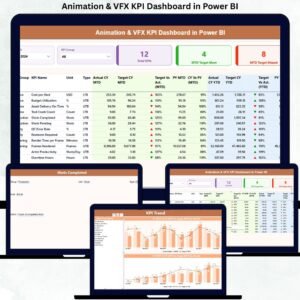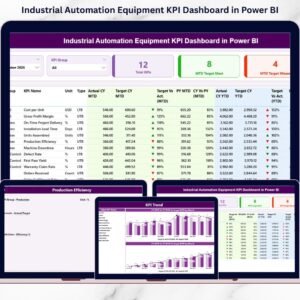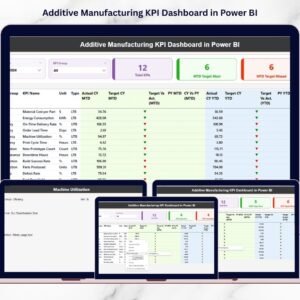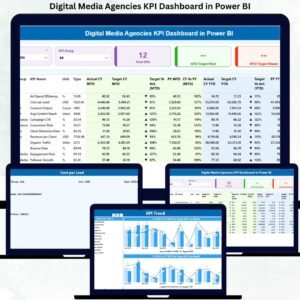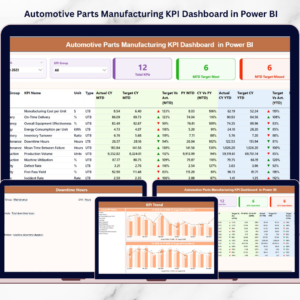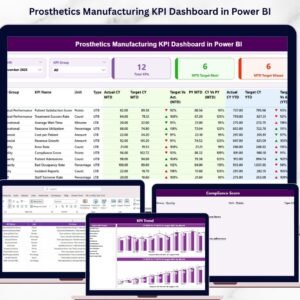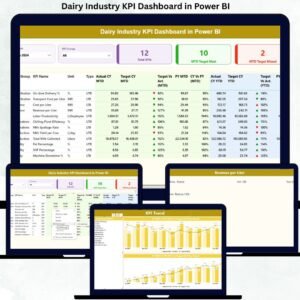
The rubber manufacturing industry demands high accuracy, fast production cycles, strict defect control, and strong coordination across departments. When data stays scattered in emails, spreadsheets, and outdated reports, leaders struggle to track performance or fix problems on time. Rubber Industry KPI Dashboard in Power BI Delays increase, defects remain unnoticed, and productivity suffers.
The Rubber Industry KPI Dashboard in Power BI solves all these challenges. Rubber Industry KPI Dashboard in Power BI It gives manufacturers a clean, automated, and interactive way to analyze production efficiency, monitor defects, control costs, track machine downtime, and compare overall KPIs. Rubber Industry KPI Dashboard in Power BI With a structured Excel source file and dynamic Power BI visuals, Rubber Industry KPI Dashboard in Power BI this dashboard becomes the ultimate productivity and reporting tool for rubber factories.
Rubber Industry KPI Dashboard in Power BI Whether you manage mixing, molding, curing, trimming, inspection, or dispatch operations—this dashboard helps every team monitor their KPIs in real time and make confident decisions.
✨ Key Features of the Rubber Industry KPI Dashboard in Power BI
This dashboard includes three analytical pages; each designed for faster insights and better decisions.
📌 What’s Inside the Rubber Industry KPI Dashboard
1. Summary Page – Your Central Performance Hub
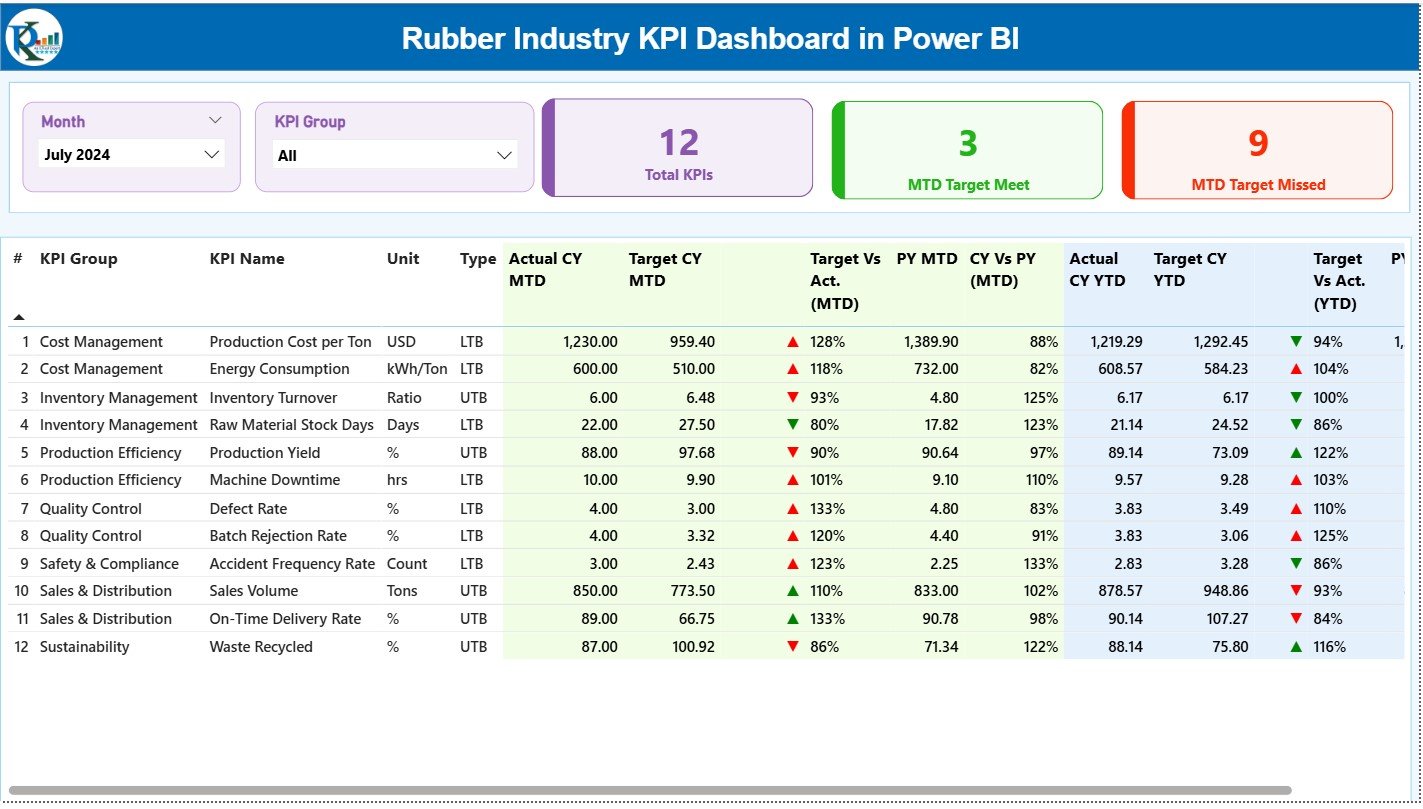
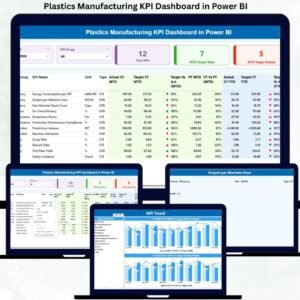
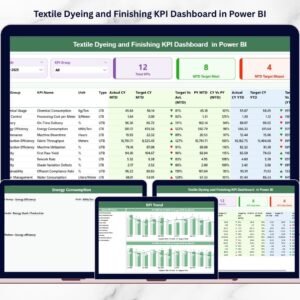
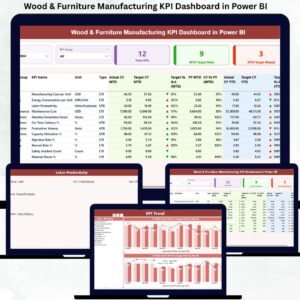
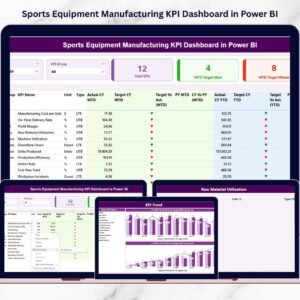
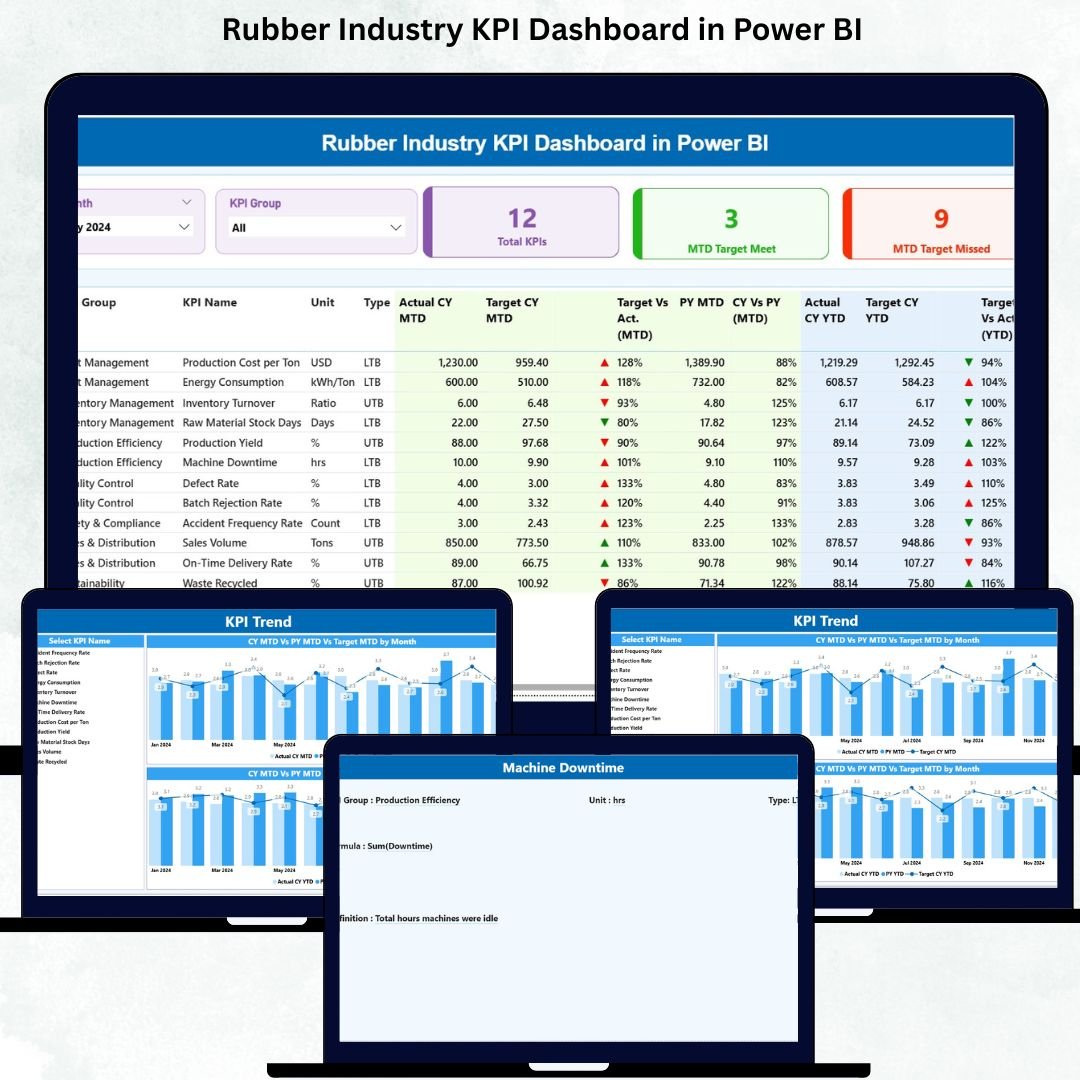
The Summary Page gives the full picture of monthly and year-to-date performance.
💠 Smart Filters (Slicers):
Month selector
KPI Group selector
With a single click, users view only the KPIs they want.
💠 Performance Cards:
Total KPIs Count
MTD Target Met
MTD Target Missed
These cards give instant clarity on how well the plant is performing.
💠 Detailed KPI Table:
The centerpiece of the dashboard is a powerful KPI table showing:
KPI Number
KPI Group (Production, Quality, Maintenance, Cost, etc.)
KPI Name
Unit (Kg, %, Hours, Nos)
Type (UTB / LTB)
Actual CY MTD
Target CY MTD
MTD Icons (▲/▼)
Target vs Actual (MTD)
PY MTD
CY vs PY MTD
Actual CY YTD
Target CY YTD
YTD Icons
Target vs Actual (YTD)
PY YTD
CY vs PY YTD
Managers instantly see which KPIs improved, declined, or need urgent action.
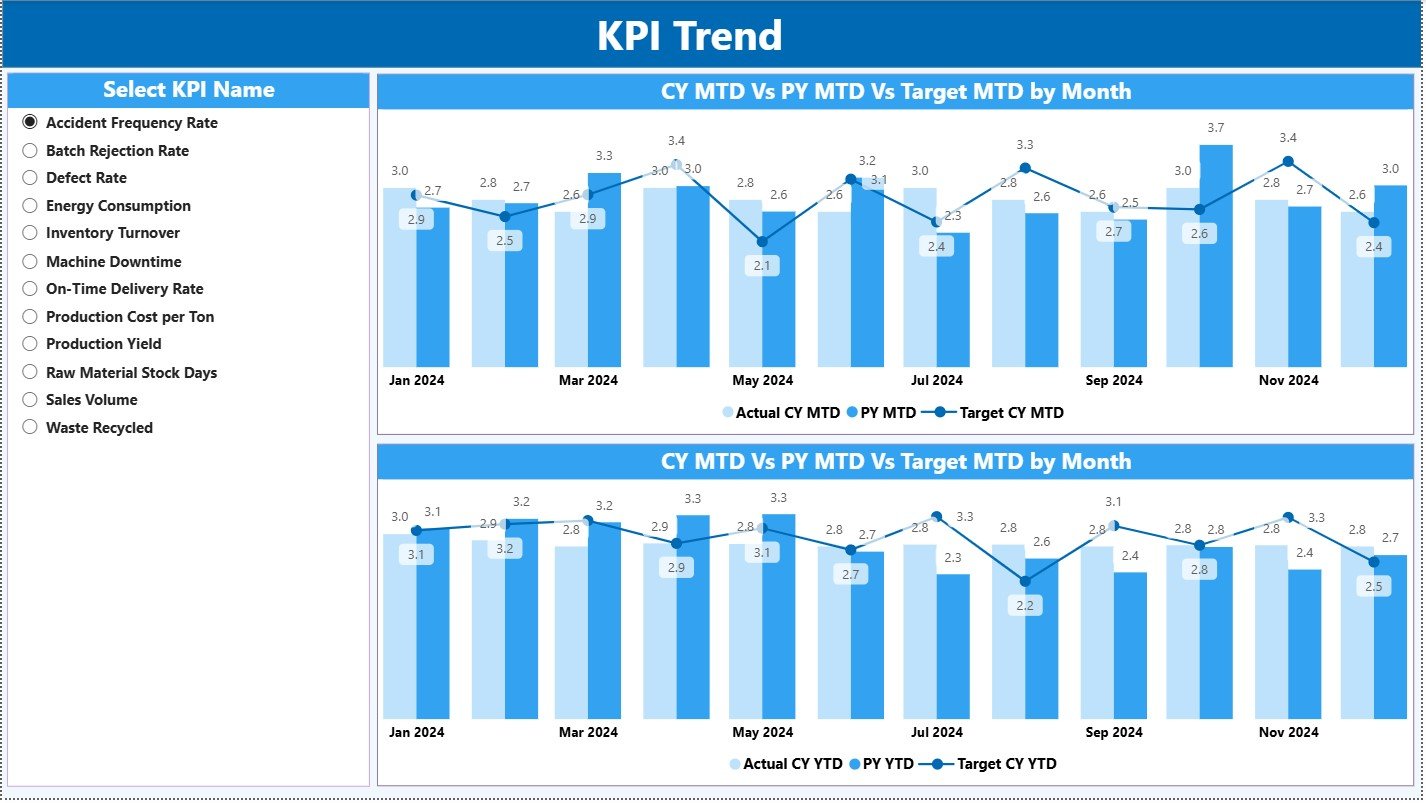
2. KPI Trend Page – Clear Month-to-Month Insights
This page helps teams identify patterns, seasonality, and performance gaps.
💠 KPI Selector Slicer
Choose any KPI and analyze its trend visually.
💠 MTD Trend Chart
Shows Actual vs Target vs Previous Year.
💠 YTD Trend Chart
Shows long-term performance comparisons.
Examples:
✔ If Scrap % is rising month after month, quality teams act quickly.
✔ If Machine Downtime spikes, maintenance schedules are adjusted.
The Trend Page ensures no issue stays hidden.
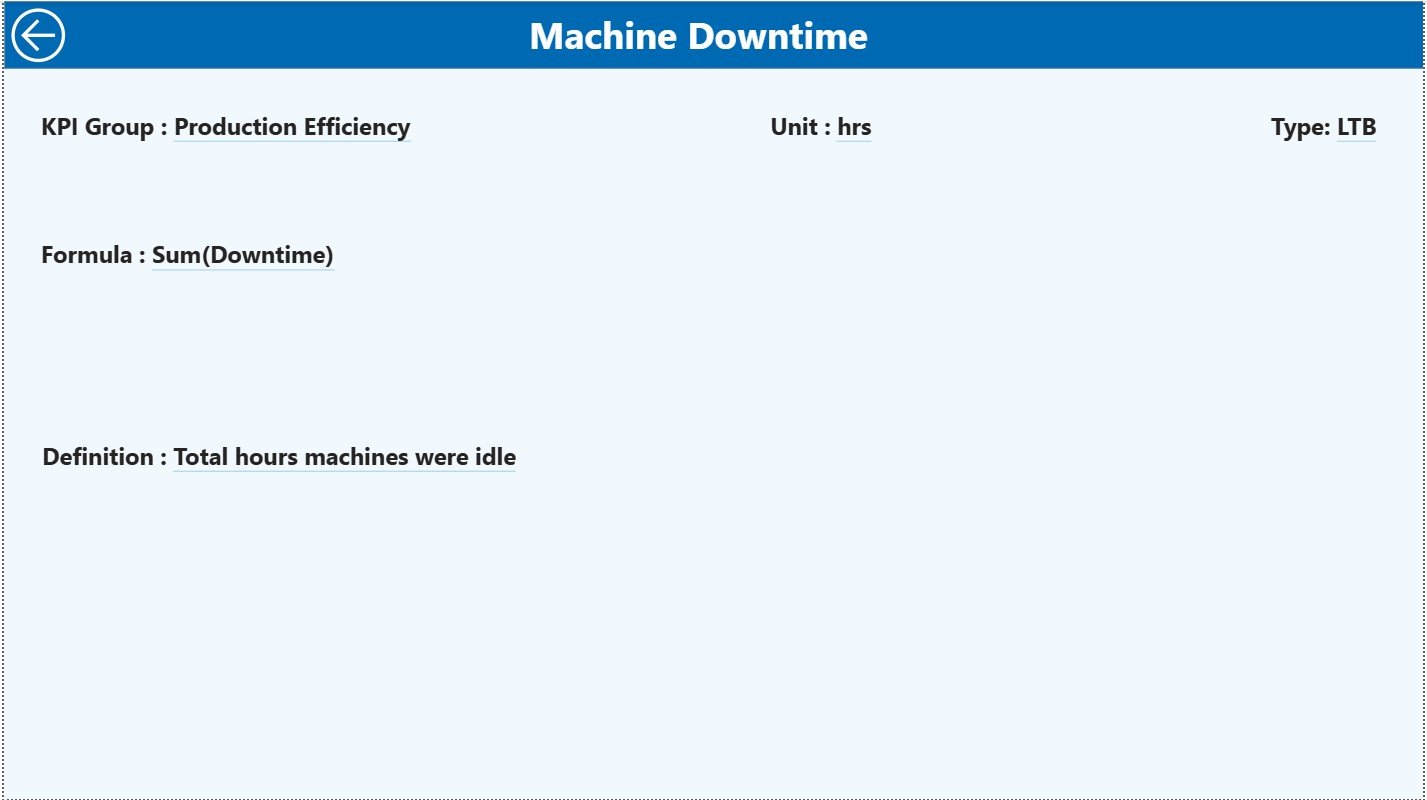
3. KPI Definition Page – Full Transparency Behind Every KPI
This drill-through page explains each KPI in detail and includes:
KPI Name
KPI Group
KPI Number
Unit
Formula
KPI Definition
Type (UTB/LTB)
This ensures everyone understands the KPIs clearly. A Back button takes users to the Summary Page.
📦 How the Dashboard Works (Excel-Powered & Automated)
The dashboard uses a clean Excel data model containing:
1. Input Actual Sheet
KPI Name
Month
MTD Actual
YTD Actual
2. Input Target Sheet
KPI Name
Month
MTD Target
YTD Target
3. KPI Definition Sheet
KPI Name
KPI Group
Unit
Formula
Definition
Type
Once data is updated → Power BI refreshes → visuals update instantly.
📈 What KPIs Can Rubber Manufacturers Track?
Production KPIs:
✔ Mixing Output
✔ Material Yield %
✔ OEE
✔ Curing Cycle Time
Quality KPIs:
✔ Scrap %
✔ Defect Ratio
✔ Rejection Rate
✔ Customer Complaints
Maintenance KPIs:
✔ Downtime Hours
✔ MTTR / MTBF
✔ Breakdown Frequency
Cost & Supply Chain KPIs:
✔ Cost per Kg
✔ Energy Consumption
✔ On-Time Delivery
✔ Inventory Days
The dashboard supports all these KPIs and more.
🎯 How This Dashboard Improves Decision-Making
Real-time visibility across production, quality, and maintenance
Early detection of quality issues
Better machine planning and preventive maintenance
Accurate cost and material consumption monitoring
Improved productivity through quick corrective actions
Eliminates manual Excel reporting
Ensures all departments work with the same data
This dashboard becomes the backbone of every daily review meeting.
👥 Who Can Benefit from This Dashboard?
✔ Factory Managers
✔ Production Supervisors
✔ Quality Heads
✔ Maintenance Heads
✔ Supply Chain Teams
✔ Plant Directors
✔ Manufacturing Analysts
Any rubber factory—small, medium, or large—can use this dashboard effectively.