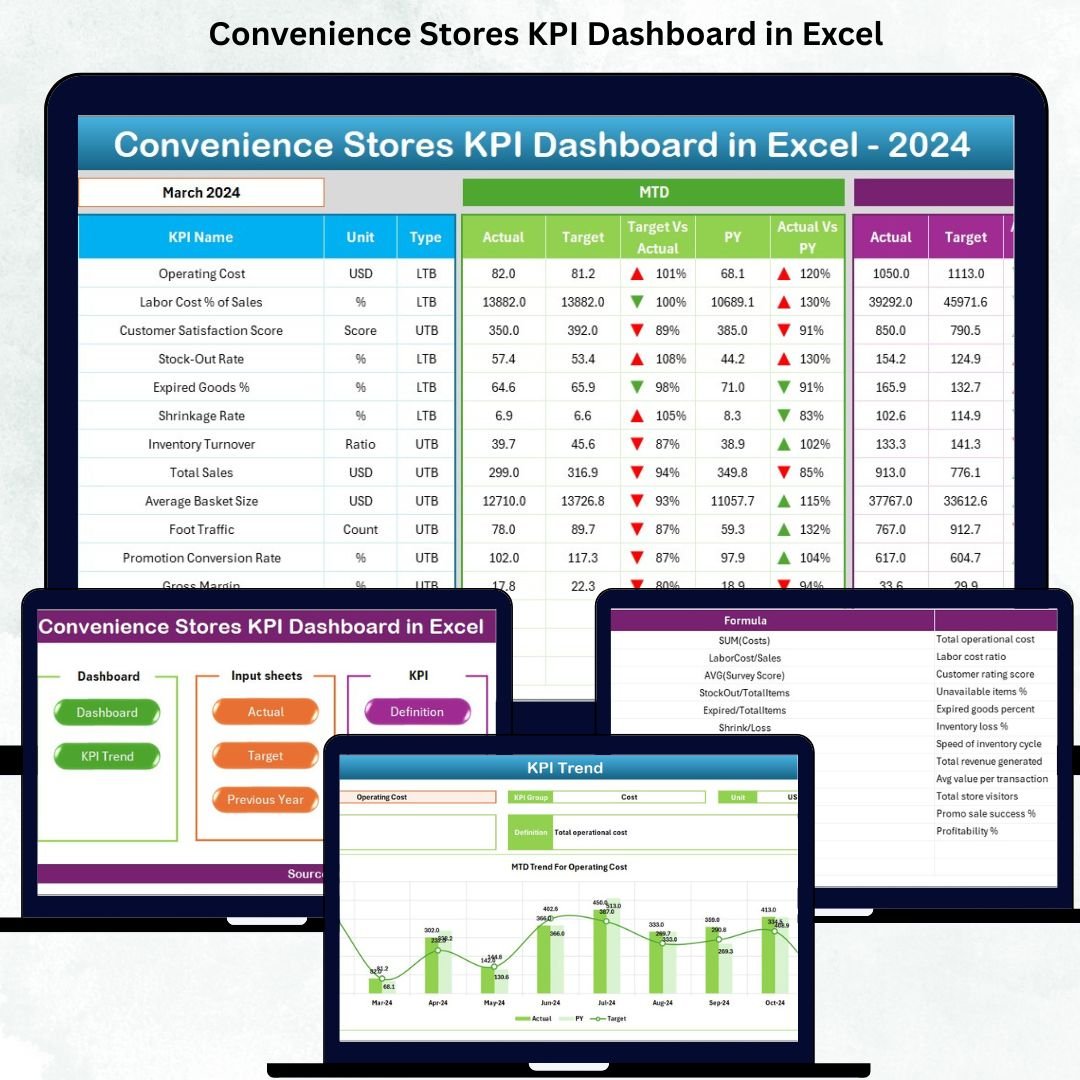


Managing a convenience store requires speed, accuracy, and constant monitoring. Inventory moves fast, customer footfall changes daily, and even a small mistake in stock planning or shrinkage control can affect profitability. To help store owners and managers stay in control, we have created the Convenience Stores KPI Dashboard in Excel—a ready-to-use, fully automated, and easy-to-understand performance monitoring tool designed for retail businesses of all sizes.Convenience Stores KPI Dashboard in Excel
This dashboard converts raw store data into visual insights so you can track your sales, inventory, store expenses, shrinkage, stock movement, customer trends, and profitability in one place. Whether you manage a single store or multiple locations, this dashboard puts every important KPI in front of you—clearly, visually, and accurately—so you can make faster and better decisions.Convenience Stores KPI Dashboard in Excel
Let’s explore how this digital product helps your convenience store run smarter than ever.
✨ Key Features of the Convenience Stores KPI Dashboard in Excel
Our Excel dashboard comes with seven professionally designed worksheets, each created to help you analyze your store’s performance instantly.
🔹 Smart Navigation (Summary Page)
A clean and simple index page helps you jump to any sheet with a single click. It’s designed for beginners and advanced users, making navigation effortless.
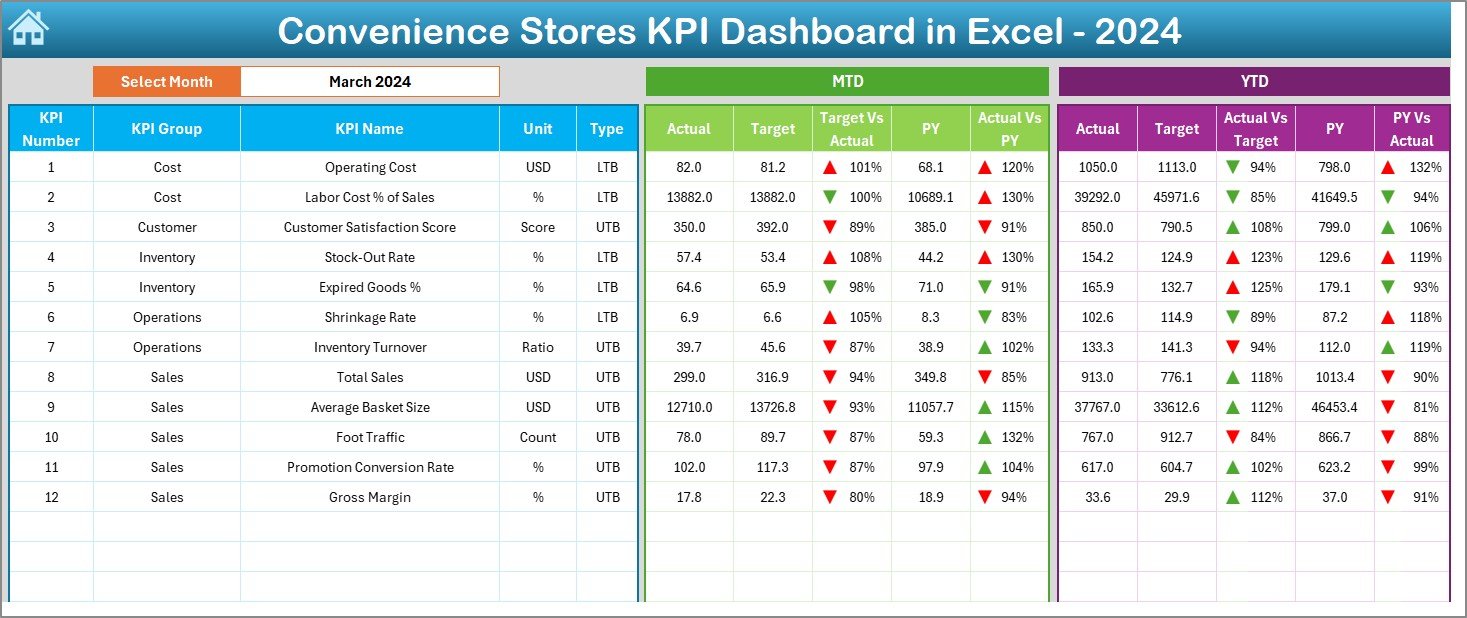
🔹 Interactive Dashboard Sheet
This is the heart of the system. With a Month Selector, you can instantly view:
-
MTD Actual, Target & Previous Year
-
YTD Actual, Target & Previous Year
-
Target vs Actual
-
PY vs Actual
All metrics use conditional formatting and arrow visuals, helping you read performance at a glance.
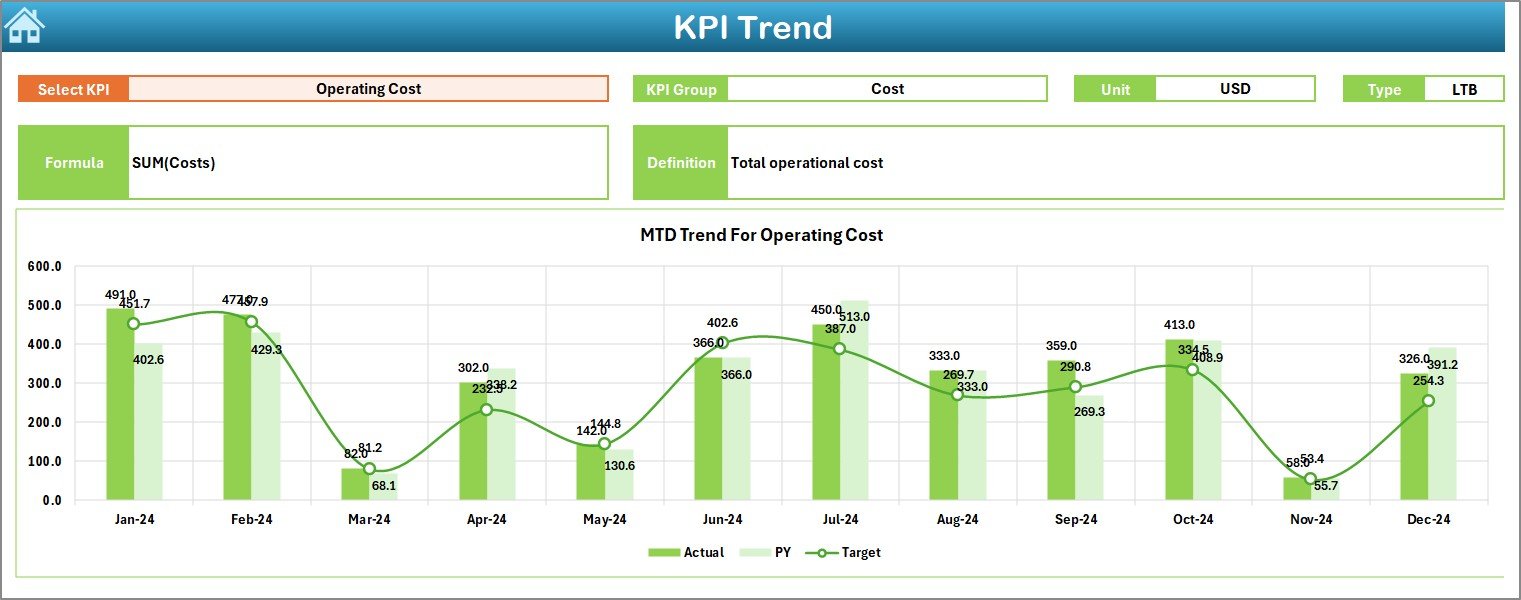
🔹 KPI Trend Page
Choose any KPI from the dropdown and see its complete trend with charts comparing Actual, Target, and Previous Year. Perfect for spotting patterns and improvement areas.
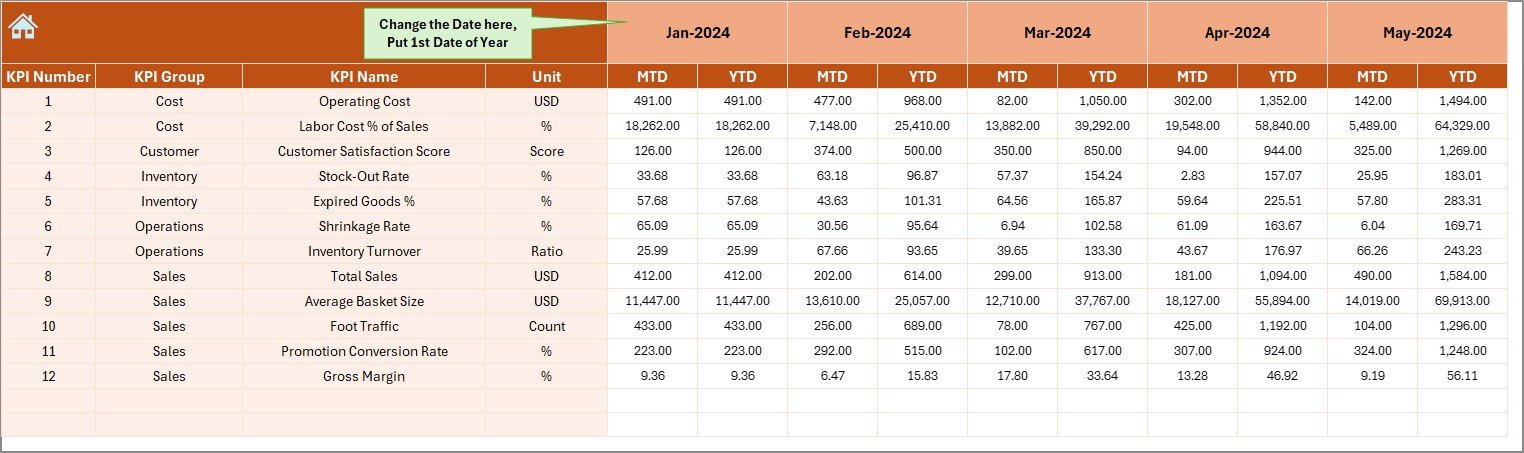
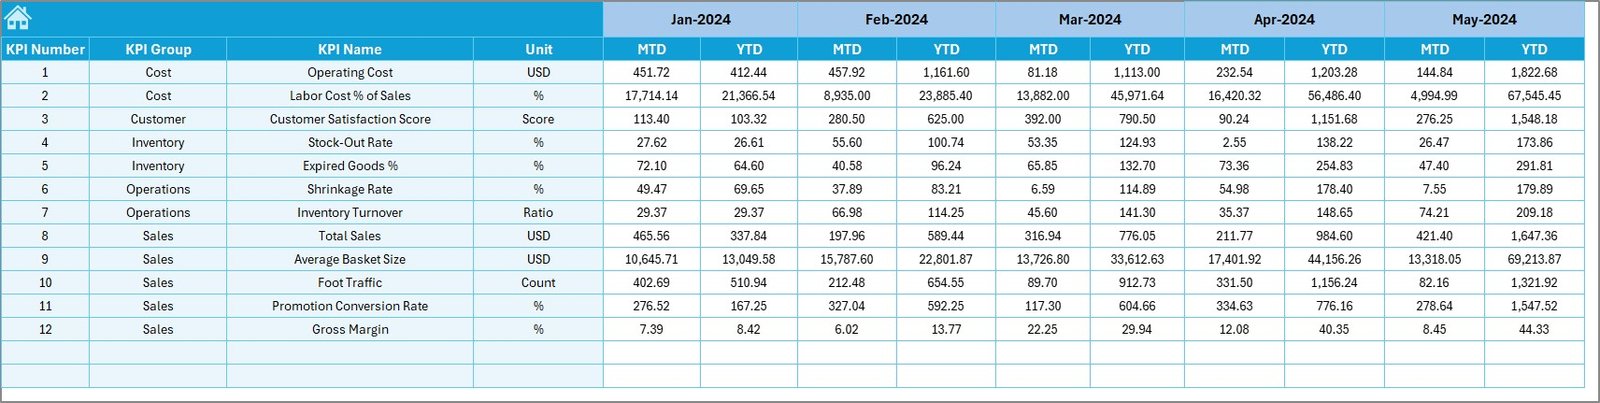
🔹 Actual, Target & Previous Year Data Sheets
You get dedicated sheets to update your store’s:
-
Actual performance
-
Monthly and yearly targets
-
Previous year numbers
This setup ensures clean, organized, and accurate reporting.
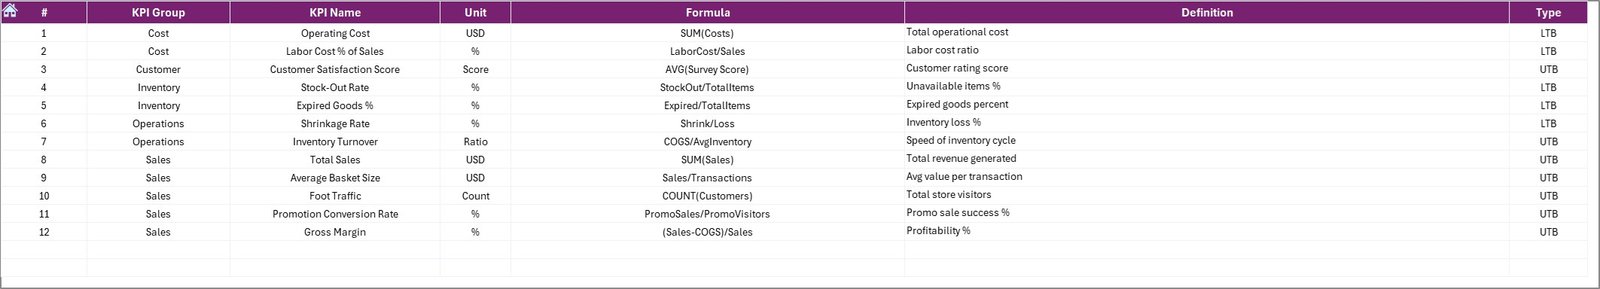
🔹 KPI Definition Sheet
Every KPI used in the dashboard is documented with its unit, formula, and definition—helping teams understand the metrics clearly.
📦 What’s Inside the Convenience Stores KPI Dashboard in Excel
When you download this product, you receive a fully structured Excel file containing:
-
7 Interactive Worksheets
-
Pre-built KPI calculations
-
Trend charts for all KPIs
-
MTD & YTD automated summaries
-
A complete KPI dictionary
-
Built-in navigation buttons
-
Easy data entry forms
-
Conditional formatting indicators
-
Clean, modern dashboard layout
Every element has been designed to make your performance tracking effortless.
🛠️ How to Use the Convenience Stores KPI Dashboard in Excel
Using this dashboard requires no technical expertise. Just follow these simple steps:
-
Enter Actual Values
Go to the Actual Numbers Sheet and enter your monthly figures. -
Enter Targets
Type your store’s target values in the Target Sheet. -
Add Previous Year Data
Use last year’s numbers for accurate comparison. -
Choose a Month
Select any month from the Dashboard Sheet and watch all visuals refresh instantly. -
Review Trends
Visit the Trend Sheet to analyze KPI patterns over time. -
Take Action
Use insights to improve stock control, reduce shrinkage, boost sales, and manage costs.
You can update this dashboard weekly, monthly, or daily—depending on your business needs.
👥 Who Can Benefit from This Convenience Stores KPI Dashboard in Excel
This dashboard is ideal for:
🏪 Convenience Store Owners
Track performance instantly and make confident business decisions.
🧾 Store Managers
Monitor targets, shrinkage, expenses, and team output every month.
📊 Retail Analysts
Analyze KPIs quickly without building dashboards from scratch.
🧮 Accountants & Operations Teams
Get accurate KPIs for financial and operational reporting.
🏬 Multi-Store Businesses
Monitor multiple branches by using this dashboard as a master template.
If you want to run your store efficiently, reduce waste, increase revenue, and streamline reporting—this template is perfect for you.
### Click here to read the Detailed blog post
Watch the step-by-step video tutorial:
Visit our YouTube channel to learn step-by-step video tutorials
👉 <a href=”https://youtube.com/@PKAnExcelExpert”>YouTube.com/@PKAnExcelExpert</a>


Reviews
There are no reviews yet.