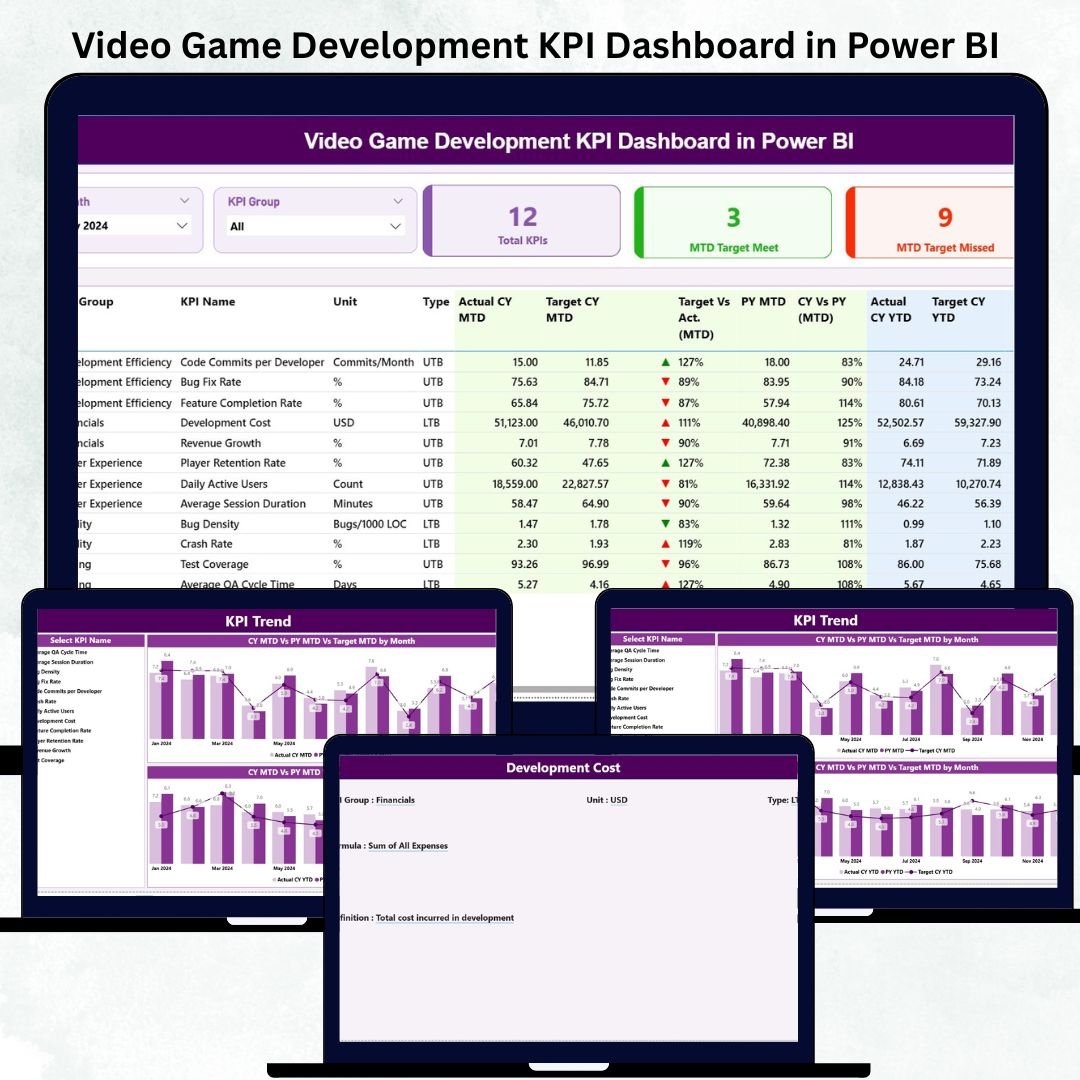
Video Game Development KPI Dashboard in Power BI The video game industry is growing faster than ever. Studios handle larger teams, tighter deadlines, and rising user expectations. Video Game Development KPI Dashboard in Power BI With so many moving parts—design, development, testing, user experience, performance optimization, and monetization—studios can easily lose track of progress. That’s why top-performing game studios rely on a Video Game Development KPI Dashboard in Power BI to monitor their entire pipeline in real time.
Video Game Development KPI Dashboard in Power BI This powerful dashboard helps development teams understand what’s working, what’s delayed, and where improvements are needed. It connects developers, designers, QA testers, artists, producers, and project managers on one clean, interactive platform. With built-in KPI logic, performance indicators, and comparison visuals, this dashboard becomes your studio’s single source of truth.
Let’s explore everything included in this high-performance dashboard 👇
✨ Key Features of the Video Game Development KPI Dashboard in Power BI
🎯 1. Three Professional Power BI Pages
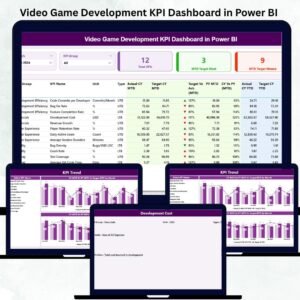
The dashboard includes Summary, KPI Trend, and KPI Definition pages—each created to simplify production monitoring and KPI evaluation.
🧭 2. Smart Navigation with Slicers
Filter performance by Month or KPI Group such as Development, Art & Design, QA Testing, Player Experience, Performance, and Monetization.
📊 3. Real-Time Production Insights
Track critical KPIs including bug counts, development hours, feature completion, asset progress, performance metrics, player feedback, and testing cycles.
🔄 4. Excel-Integrated Data Source
All data comes from Excel sheets (Actual, Target, KPI Definitions). Update numbers and the dashboard automatically reflects new performance.
📈 5. CY vs PY Comparisons
Clear visuals highlight progress versus previous months and previous years—perfect for large and small studios.
⭐ 6. MTD & YTD Tracking with Performance Indicators
The dashboard uses icons and percentages to show whether targets are met, missed, or improving.
📦 What’s Inside the Video Game Development KPI Dashboard in Power BI
🏠 1. Summary Page – Complete Development Snapshot
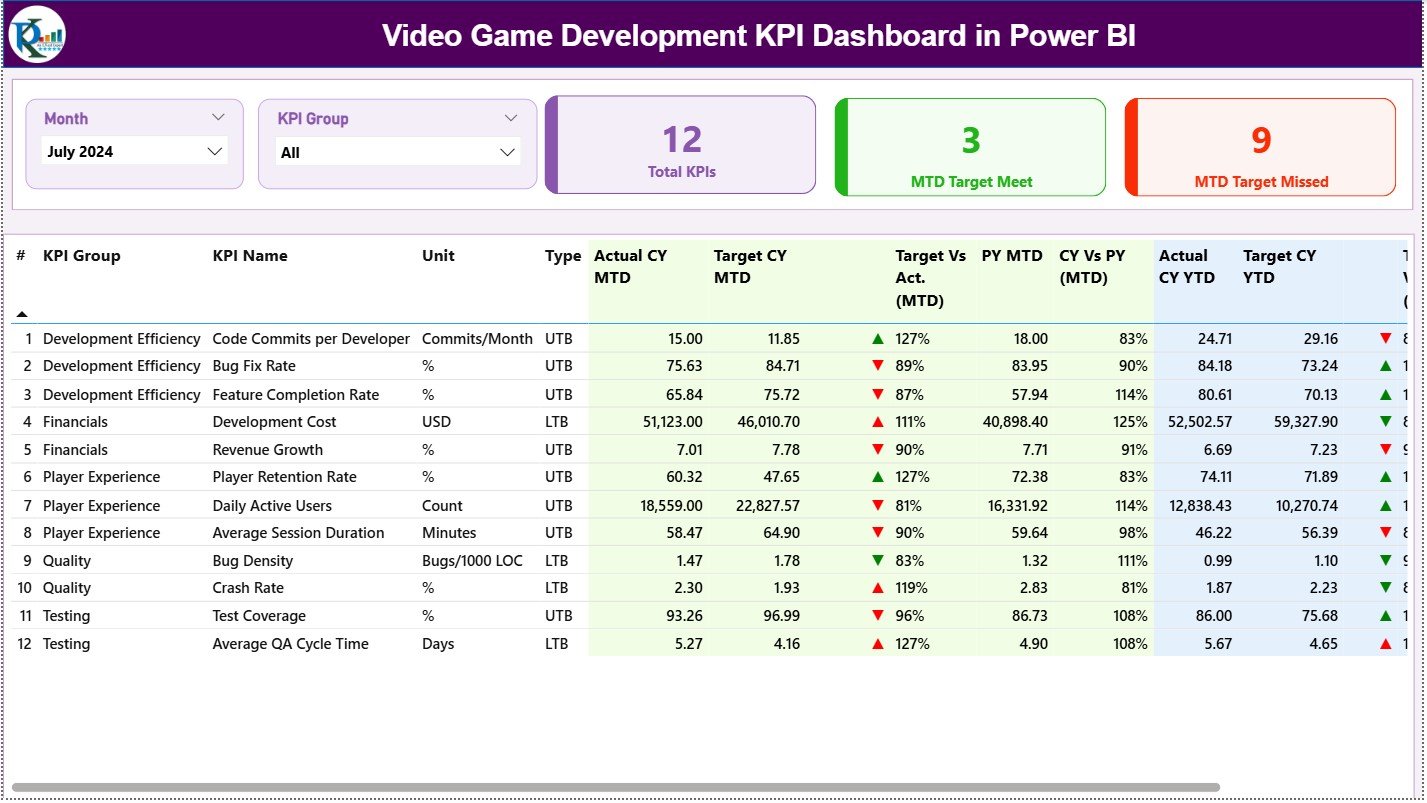
This is the main control center for your project. The page includes:
-
🎮 Month Slicer
-
🧩 KPI Group Slicer
-
🔵 KPI Cards:
-
Total KPIs Count
-
MTD Target Met
-
MTD Target Missed
-
Then comes the core of the dashboard:
📑 Detailed KPI Table
This interactive table shows:
-
KPI Number
-
KPI Group
-
KPI Name
-
Unit
-
KPI Type (LTB/UTB)
-
MTD Actual vs Target
-
MTD Indicators (▲▼)
-
CY vs PY (MTD)
-
YTD Actual vs Target
-
YTD Indicators
-
CY vs PY (YTD)
This gives studios complete clarity on current progress and historical performance.
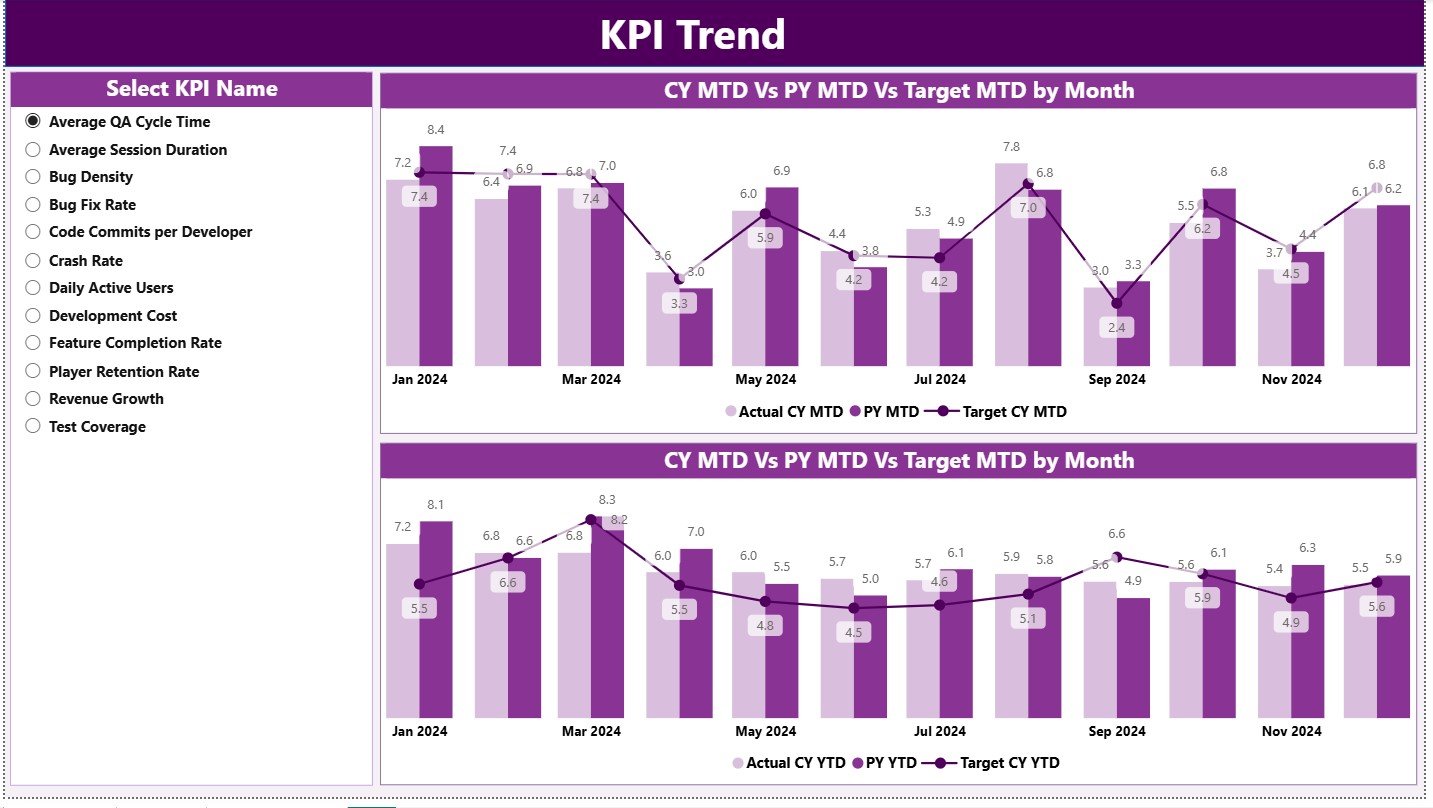
📈 2. KPI Trend Page – Month-by-Month Game Development Analysis
The trend page helps track patterns across the entire project lifecycle.
What you’ll see:
-
📌 Left Slicer: Select any KPI
-
📊 Combo Chart 1: MTD Actual vs Target vs PY
-
📉 Combo Chart 2: YTD Actual vs Target vs PY
These insights help teams track:
-
Bug fix rate improvement
-
Feature completion progress
-
Performance optimization trends
-
User feedback changes
-
Development workload balance
Trends help studios catch issues early and plan realistic timelines.
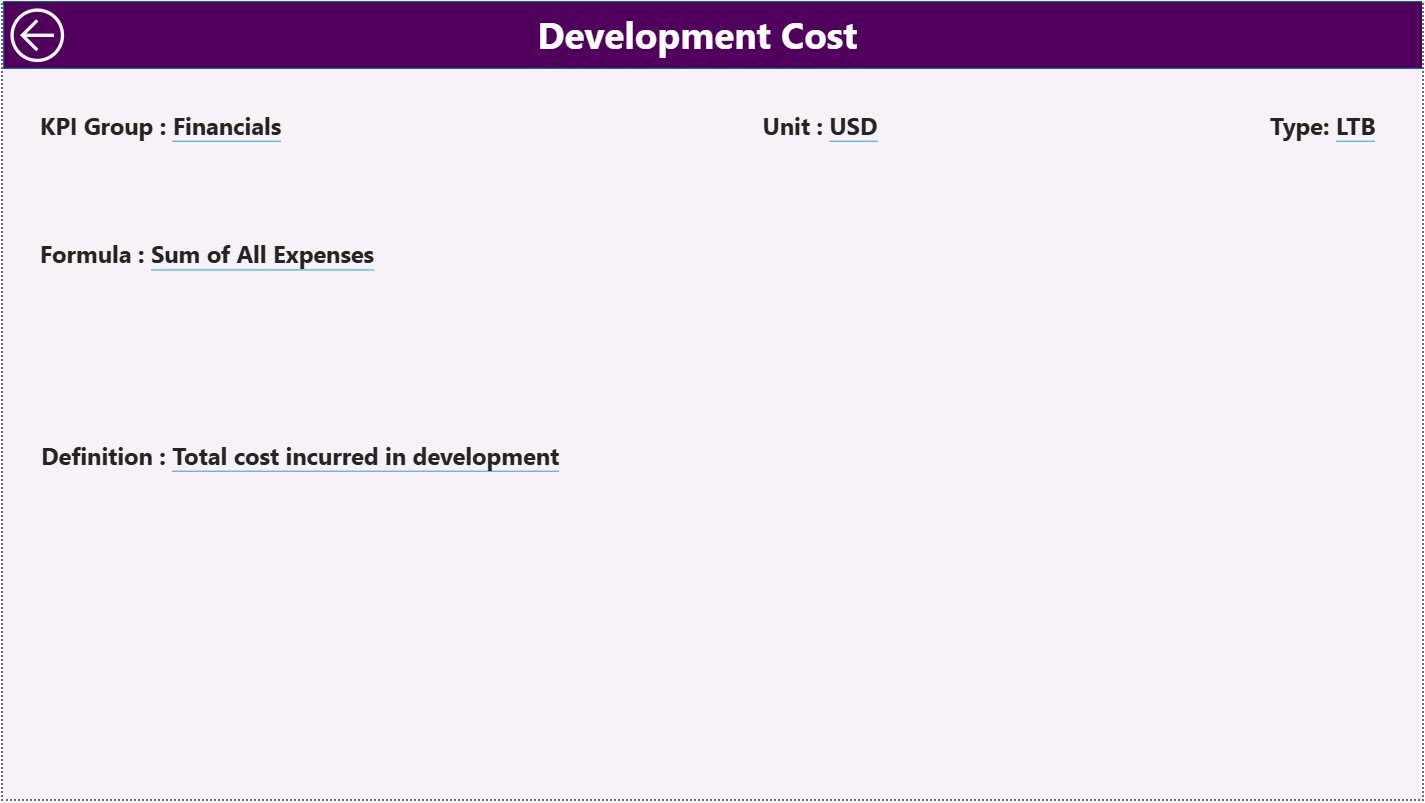
📘 3. KPI Definition Page – Full Transparency for All KPIs
This drill-through page shows:
-
KPI Number
-
KPI Group
-
Unit
-
Formula
-
Definition
-
Type (UTB or LTB)
This eliminates confusion between departments and ensures KPIs are interpreted correctly.
🧭 How to Use the Video Game Development KPI Dashboard in Power BI
🪄 Step 1: Update Excel Sheets
Fill the Input_Actual, Input_Target, and KPI Definition files.
🔄 Step 2: Refresh Power BI
Power BI automatically updates all visuals.
🔍 Step 3: Analyze the Summary Page
Review MTD/YTD performance, target gaps, and historical comparisons.
📈 Step 4: Use the KPI Trend Page
Study monthly patterns to identify improvement opportunities.
📘 Step 5: Drill Through for Clarifications
Right-click any KPI to see formula and definition instantly.
📤 Step 6: Share Reports
Publish the dashboard for project managers, QA teams, designers, and leadership.
🎮 Who Can Benefit from This Video Game Development KPI Dashboard?
👨💻 Developers & Programmers
Track coding productivity, build stability, review development progress.
🎨 Art & Design Teams
Monitor asset creation, design iterations, UI/UX progress.
🧪 QA Testers
Track bug reports, fix rates, severity levels, test coverage.
🎧 Player Experience Teams
Analyze retention, satisfaction, tutorial completion, feedback quality.
🧑💼 Project Managers & Producers
Monitor target achievement, optimize workflows, and foresee delays.
🏢 Studio Leadership Teams
Understand the overall project health in seconds.


Reviews
There are no reviews yet.