
Managing emergency operations requires speed, accuracy, and real-time visibility. When teams face unpredictable situations—fires, medical emergencies, hazardous incidents, or natural disasters—every second counts. That’s why having a powerful and easy-to-use reporting system is essential. The Emergency Management KPI Dashboard in Power BI is designed to give emergency teams the clarity they need to make fast and informed decisions.Emergency Management KPI Dashboard in Power BI
This ready-to-use Power BI dashboard brings together all critical KPIs into one interactive platform. Whether you’re monitoring response time, resource allocation, equipment readiness, medical support efficiency, or communication performance, this dashboard delivers instant insights that emergency leaders can trust.
With clean visuals, slicers, KPI cards, drill-through pages, and Excel-based data entry, this tool ensures accurate reporting without the need for technical expertise. It transforms raw performance numbers into easy-to-understand insights—helping teams stay fully prepared for any emergency.Emergency Management KPI Dashboard in Power BI
🚀 Key Features of the Emergency Management KPI Dashboard in Power BI
The dashboard includes powerful features that simplify emergency performance tracking:
✅ Real-Time KPI Monitoring
Track response time, incident handling, medical support efficiency, and communication performance with instant visual clarity.
✅ Easy Navigation
Use Month and KPI Group slicers to switch between Response KPIs, Communication KPIs, Recovery KPIs, and more.
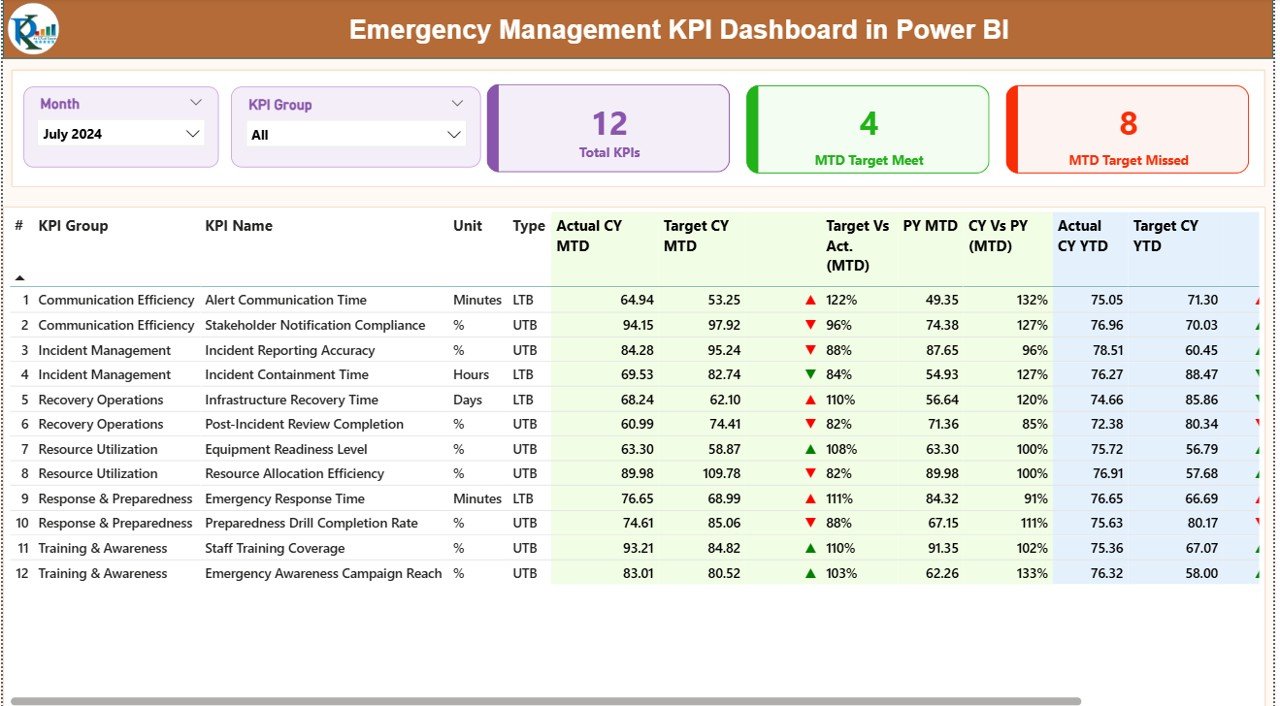
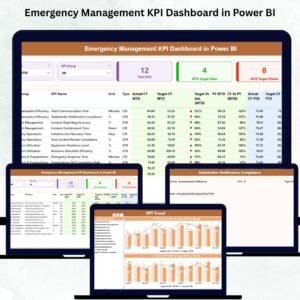
✅ KPI Cards for Quick Insights
View Total KPIs, Target Met, and Target Missed at a glance—perfect for fast decision-making.
✅ MTD & YTD Tracking
Analyze month-to-date and year-to-date performance with red/green status icons for accuracy.
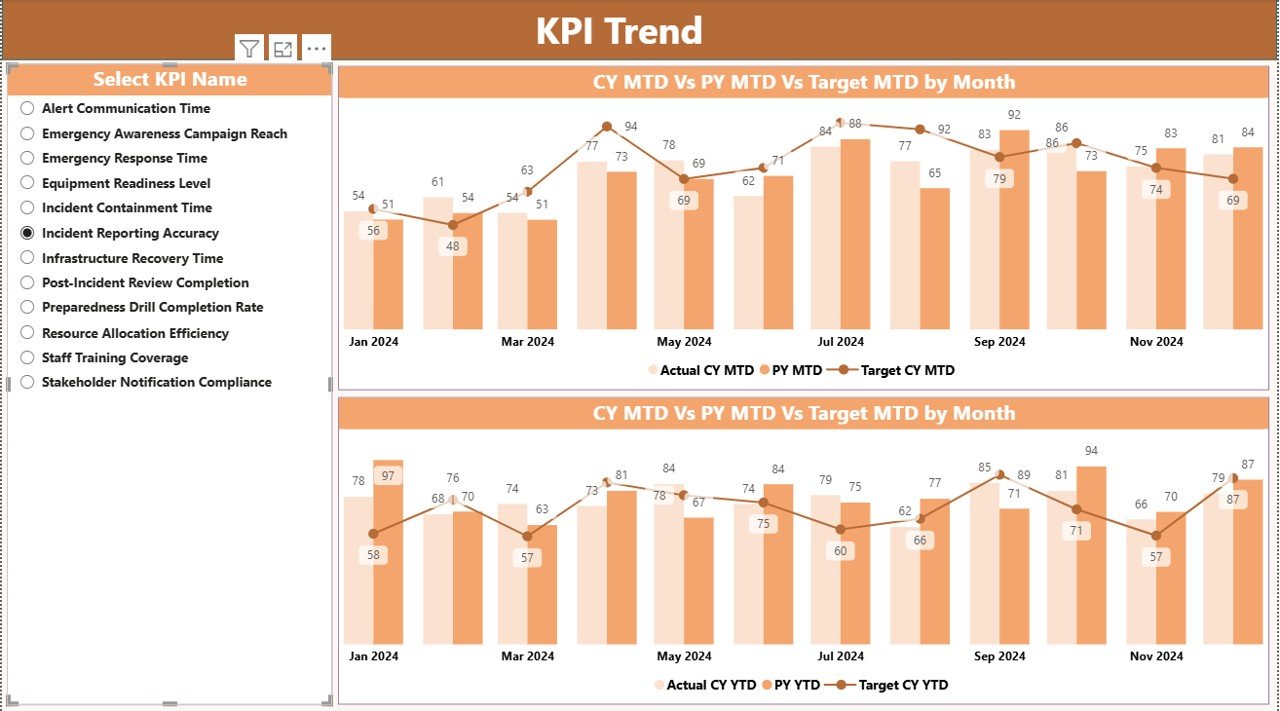
✅ Trend Charts
Monitor monthly performance to detect patterns, risks, or improvement opportunities.
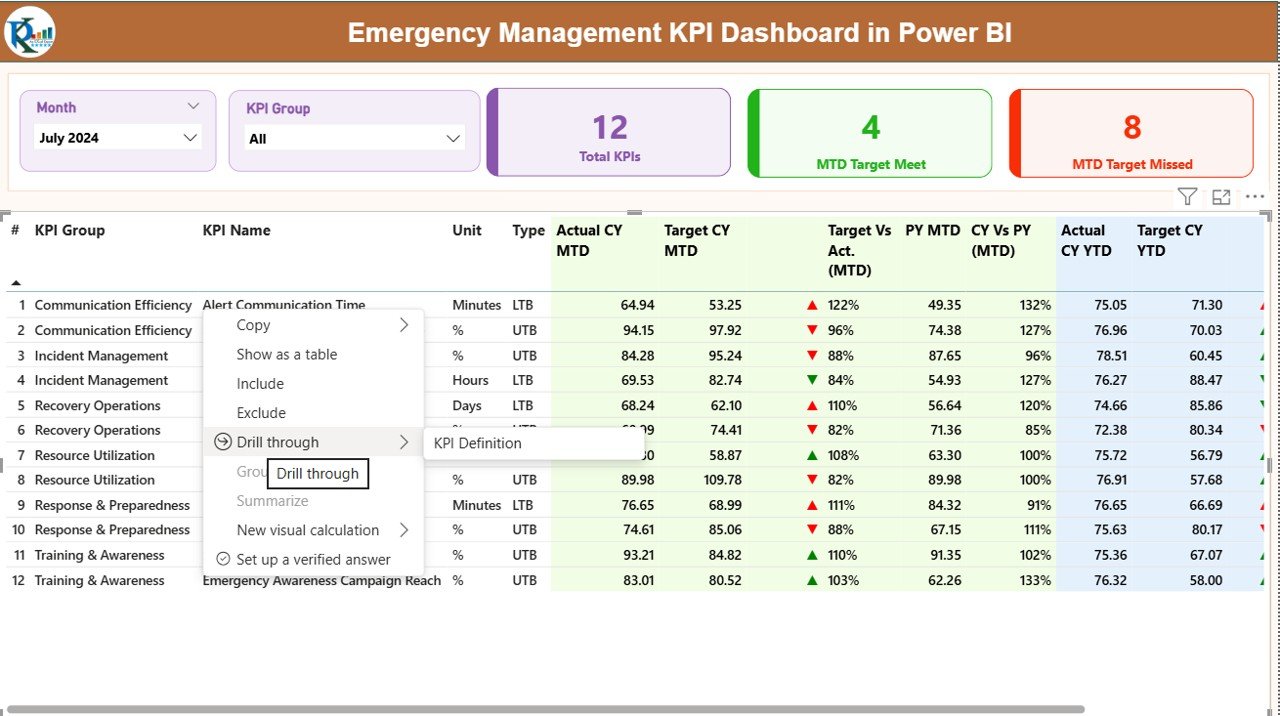
✅ Detailed KPI Table
View KPI names, units, types, formulas, actuals, targets, comparisons, CY vs PY, and status indicators.
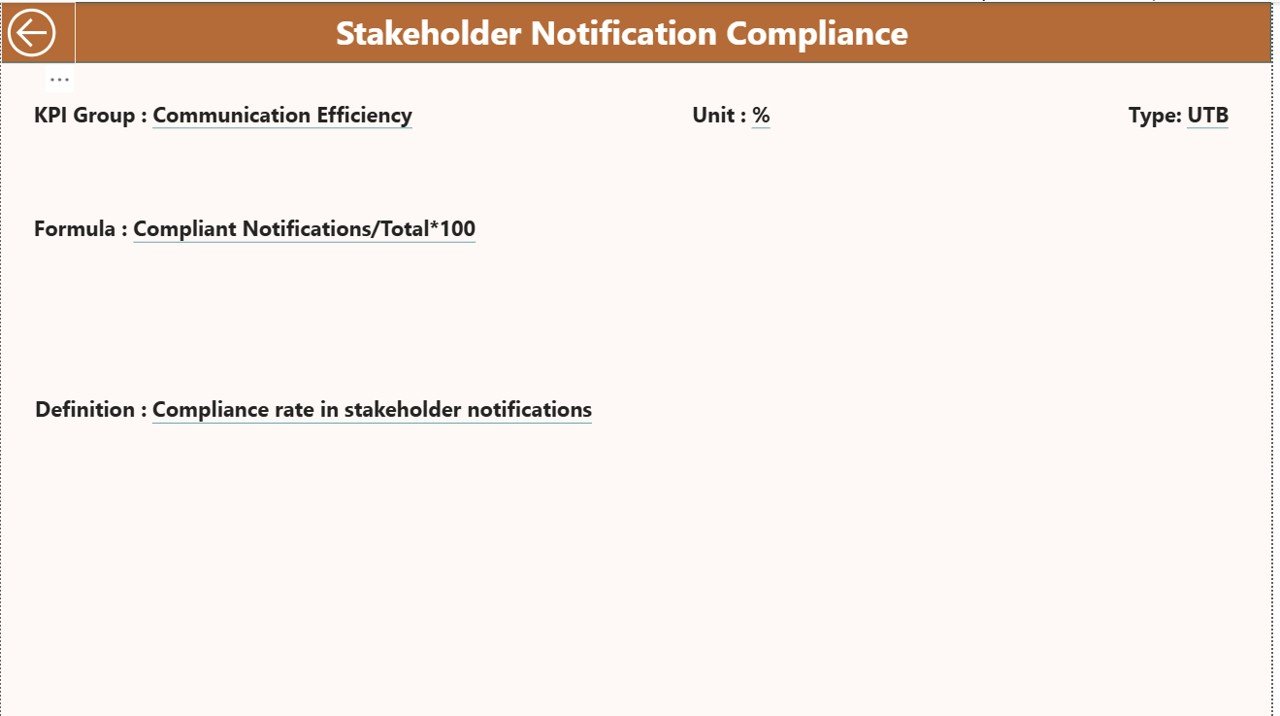
✅ Drill-Through KPI Definition Page
Right-click any KPI to access its definition, formula, group, unit, and type (UTB/LTB).
✅ Excel-Based Data Entry
Update metrics easily in three Excel sheets: Actuals, Targets, and KPI Definitions.
This dashboard gives emergency teams complete visibility into their operations—without manual work.
📦 What’s Inside the Emergency Management KPI Dashboard in Power BI
This product includes everything you need to track emergency performance smoothly:
📁 Power BI Dashboard (PBIX File)
Designed with:
-
Summary Page
-
KPI Trend Page
-
KPI Definition Page
📊 Excel Data Source
Includes:
-
Input_Actual Sheet
-
Input_Target Sheet
-
KPI Definition Sheet
🧭 Interactive Visual Elements
-
Slicers
-
Combo charts
-
Cards
-
Red/green icons
-
Drill-through buttons
📘 Documentation
A structured layout makes navigation simple for all levels of users.
🛠️ How to Use the Emergency Management KPI Dashboard in Power BI
You can set up the dashboard in three simple steps:
1️⃣ Update Data in Excel
Enter:
-
Actual CY MTD/YTD
-
Target MTD/YTD
-
KPI metadata
2️⃣ Refresh Power BI
Load the updated Excel file and refresh visuals instantly.
3️⃣ Analyze Insights
Use slicers, cards, tables, trend charts, and drill-through pages to understand performance.
Because the dashboard is beginner-friendly, no technical skills are required. Even first-time Power BI users can analyze emergency KPIs with ease.
👥 Who Can Benefit from This Emergency Management KPI Dashboard?
This dashboard is ideal for:
🚑 Emergency Response Teams
Monitor response time, delays, and readiness.
🚒 Fire & Rescue Departments
Track incident severity, closure rate, and preparedness.
👮 Police Departments
Measure communication time, incident handling, and resource allocation.
🏥 Medical Support Units
Analyze medical response KPIs and treatment efficiency.
🌪️ Disaster Management & Recovery Teams
Understand equipment readiness, coordination efficiency, and recovery timelines.
🛡️ Public Safety Agencies
Maintain high compliance and safety standards with accurate KPI tracking.
Any organization dealing with emergency operations can use this dashboard to improve speed, efficiency, and coordination.
Click here to read the Detailed blog post
Watch the step-by-step video tutorial:


Reviews
There are no reviews yet.