Payroll Management Dashboard in Power BI is a powerful, ready-to-use reporting system designed to transform payroll complexity into crystal-clear insights. Whether you manage salaries, deductions, allowances, bonuses, or department-wise payroll spending, this dashboard gives you everything in one place—clean, visual, and fully automated. It helps HR, Finance, and leadership teams monitor workforce costs, improve payroll accuracy, and make smarter decisions using dynamic Power BI visuals.
This digital product has been created for professionals who want accuracy, speed, and complete transparency in payroll workflows. No manual calculations. No scattered Excel sheets. No confusion. With this dashboard, you get a complete 360° view of how your payroll is performing across departments, regions, and branch locations—month after month.
⭐ Key Features of Payroll Management Dashboard in Power BI
This dashboard is packed with premium, user-friendly features that make payroll reporting fast, dynamic, and effortless:
✨ Multi-Page Interactive Dashboard – Comes with 5 beautifully designed pages to analyze payroll performance from every angle.
📊 Smart KPI Cards – Quickly track performance ratings, salary payout %, gross pay, deductions, and more.
📍 Department, Region & Branch Location Insights – Easily compare payroll trends across different organizational segments.
📈 Monthly Trend Visuals – Monitor overtime pay, deductions, and gross pay month-wise to spot patterns instantly.
🎯 Fully Automated Visuals – Simply refresh your data and the dashboard updates automatically.
📥 No Coding Required – 100% ready to use. Just load your data and start analyzing.
🔍 Drill-down Capabilities – Explore each KPI with more clarity using slicers and filters.
📦 What’s Inside the Payroll Management Dashboard in Power BI
Inside this digital product, you will find:
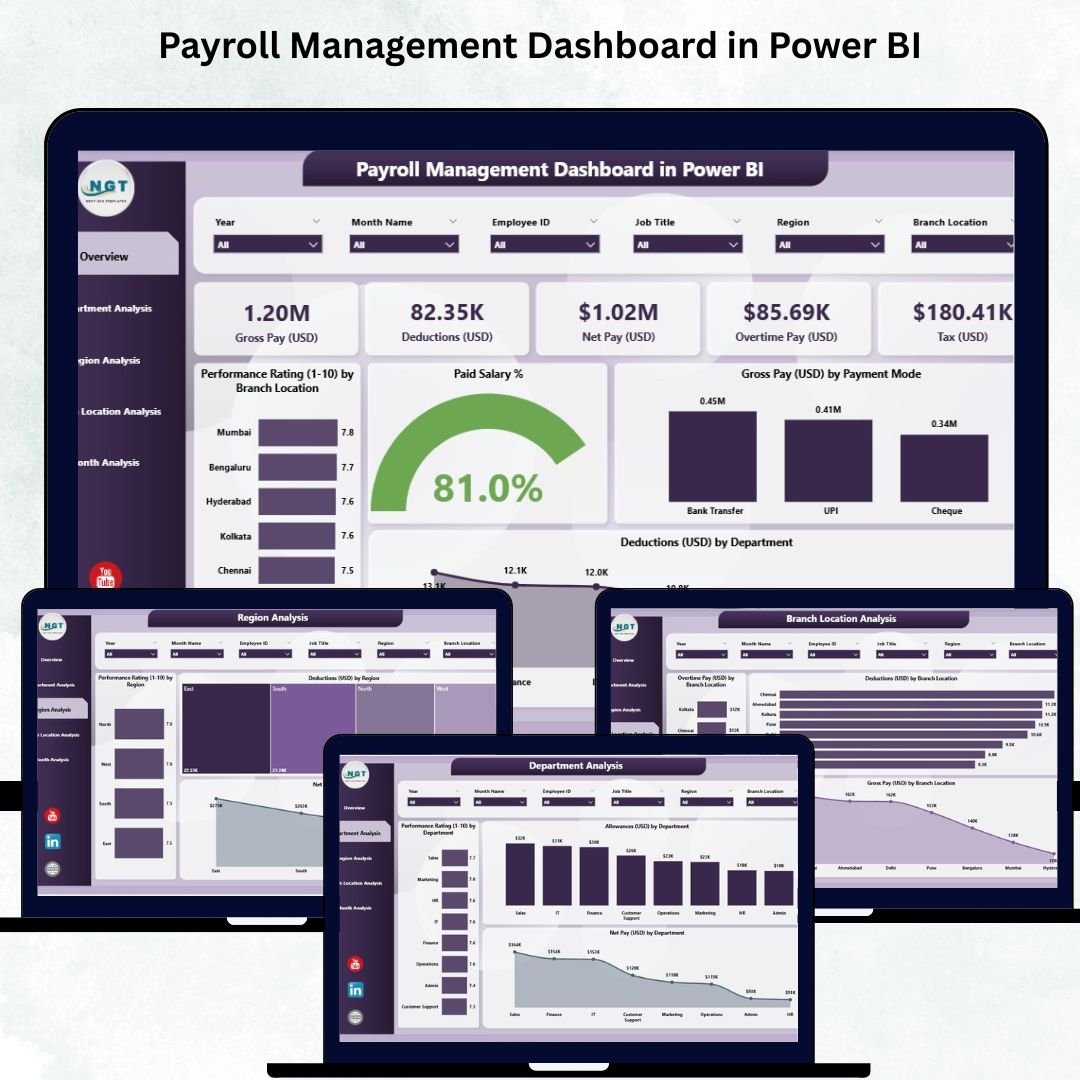
🟦 1. Overview Page
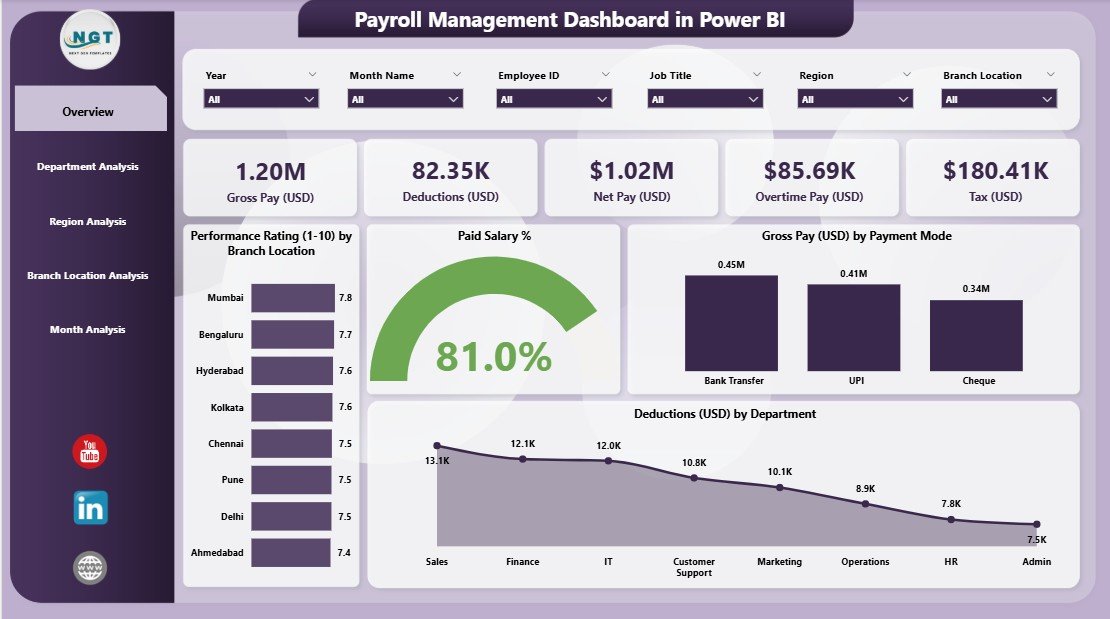
The main dashboard page containing:
-
Four KPI cards
-
Four visual charts including:
✔ Performance Rating by Branch Location
✔ Paid Salary %
✔ Gross Pay (USD) by Payment Mode
✔ Deduction (USD) by Department
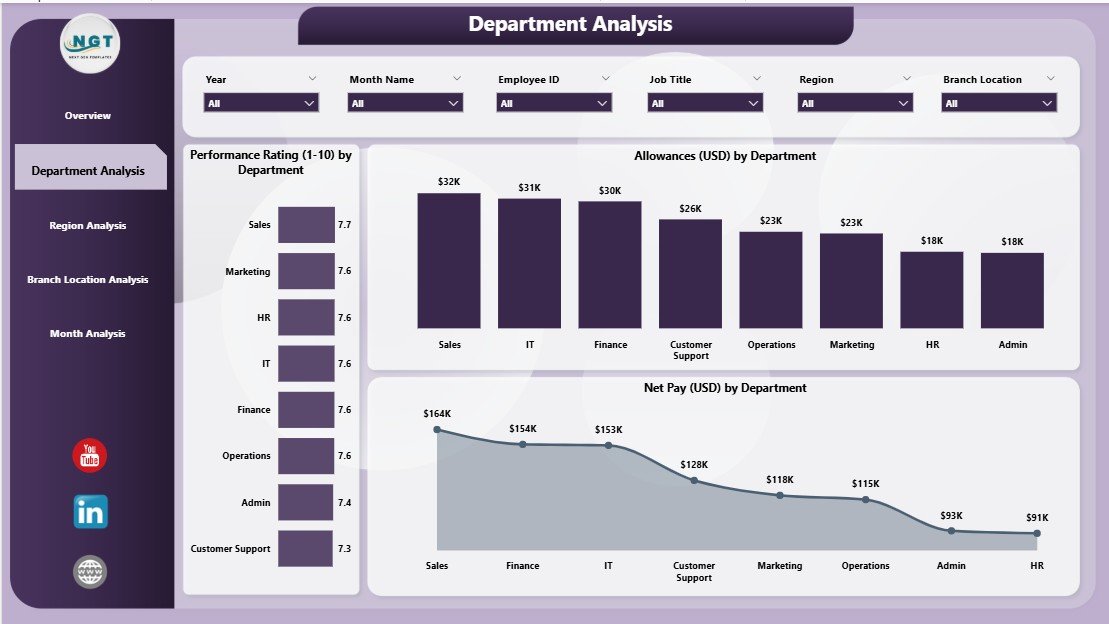
🟧 2. Department Analysis Page
-
Performance Rating by Department
-
Allowance (USD) by Department
-
Net Pay (USD) by Department
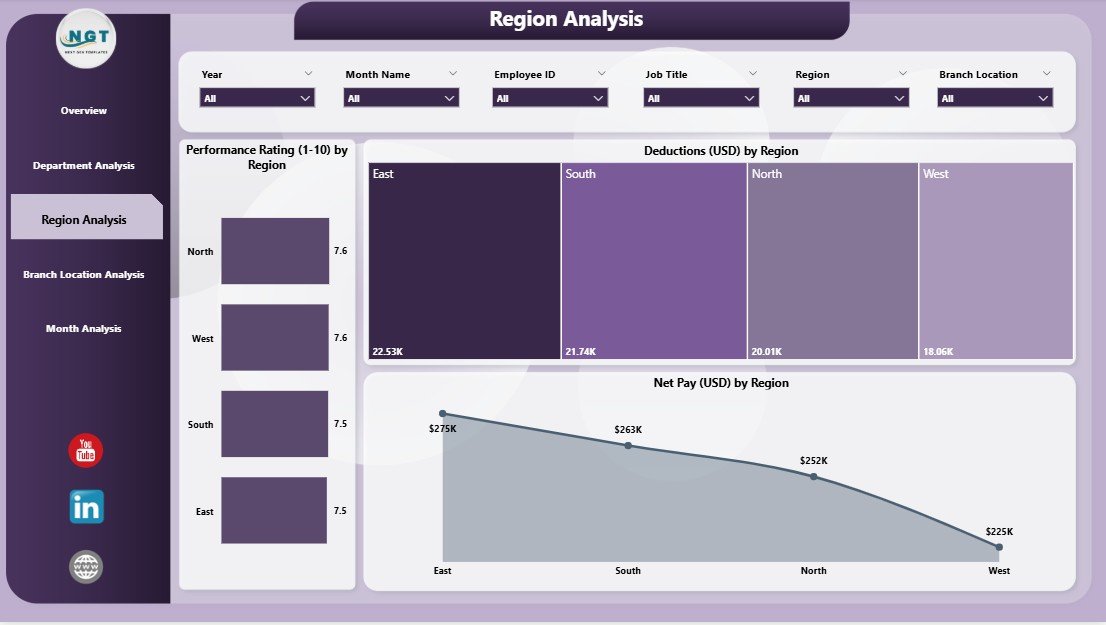
🟨 3. Region Analysis Page
-
Performance Rating by Region
-
Deduction (USD) by Region
-
Net Pay (USD) by Region
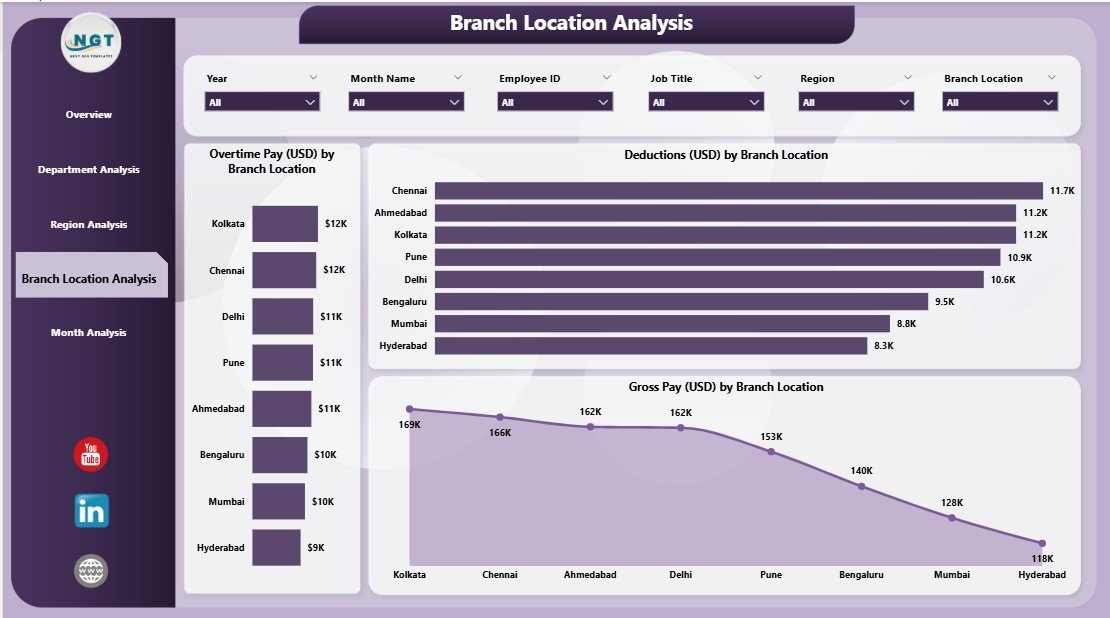
🟩 4. Branch Location Analysis Page
-
Overtime Pay (USD) by Branch
-
Deduction (USD) by Branch
-
Gross Pay (USD) by Branch Location
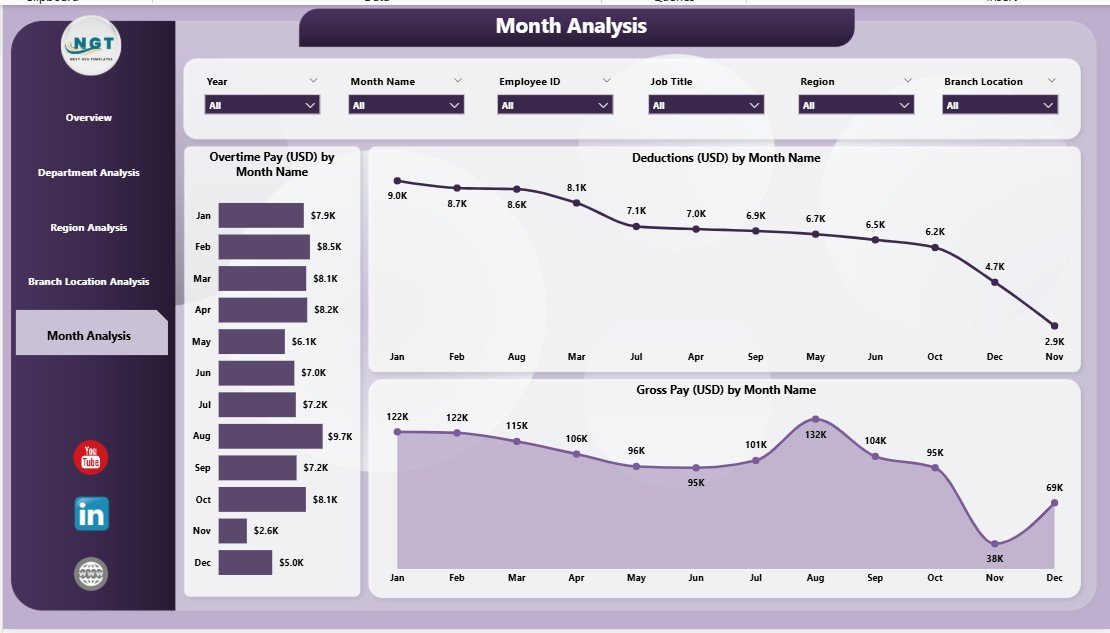
🟪 5. Monthly Trends Page
-
Overtime Pay (USD) by Month
-
Deductions (USD) by Month
-
Gross Pay (USD) by Month
Every page is professionally designed to simplify decision-making and save hours of manual work.
🧠 How to Use the Payroll Management Dashboard in Power BI
Getting started is effortless—even for beginners:
1️⃣ Open the PBIX file included with your download.
2️⃣ Load your payroll dataset using Power BI’s “Transform Data” or “Replace Data Source.”
3️⃣ Refresh the dashboard to update all visuals instantly.
4️⃣ Use slicers and filters to switch between locations, months, departments, and employee groups.
5️⃣ Export visuals to PDF or PowerPoint for management reporting.
Within minutes, your raw payroll data turns into actionable insights.
👥 Who Can Benefit from This Payroll Management Dashboard in Power BI?
This dashboard is perfect for:
💼 HR Managers – Track salary payouts, deductions, and employee performance trends.
📊 Finance Teams – Monitor payroll costs, monthly trends, and department-wise spending.
🏢 Business Owners & CEOs – Get a high-level view of payroll health and cost efficiency.
🏭 Multi-location Companies – Analyze branch, region, and department-level payroll performance.
💻 Power BI Users – A ready-made solution for automated payroll analytics.
🎓 Students & Analysts – Ideal for learning professional reporting methods.
If your organization processes salaries every month, this dashboard will save time, reduce errors, and dramatically improve transparency.


Reviews
There are no reviews yet.