


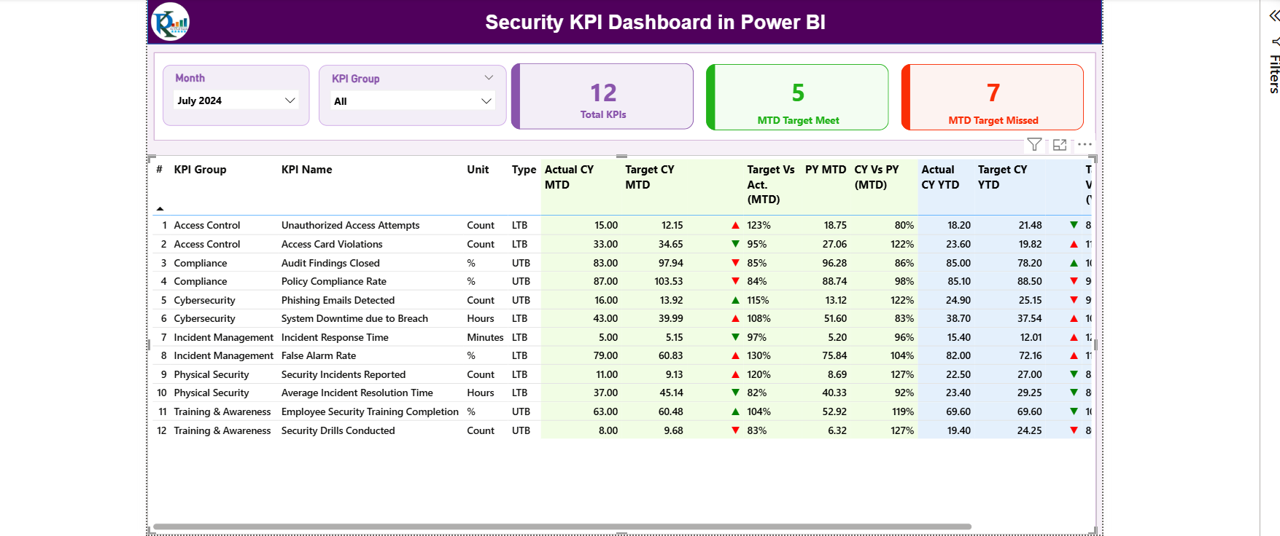
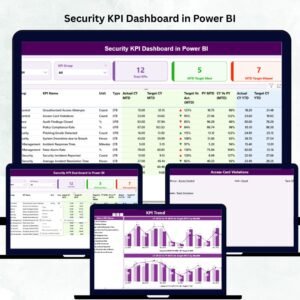
A secure organization is a successful organization — but only when you track the right numbers at the right time. The Security KPI Dashboard in Power BI is a powerful, ready-to-use reporting solution that gives you real-time visibility into every key area of security operations. Whether you manage incidents, access control, compliance, patrol activities, or cybersecurity alerts, this dashboard helps you monitor performance with accuracy, speed, and clarity. Designed for both beginners and experts, this tool turns raw Excel data into meaningful insights using automated visuals, slicers, icons, and intelligent calculations.
With this dashboard, you can instantly view Month-to-Date (MTD) and Year-to-Date (YTD) performance, track trends, compare target vs actual values, and drill into detailed KPI definitions — all within a clean, interactive Power BI interface. If your team currently uses manual spreadsheets or scattered reports, this dashboard will transform the way you manage security performance.
⚡ Key Features of the Security KPI Dashboard in Power BI
The Security KPI Dashboard is packed with powerful features that simplify performance monitoring and help security leaders make faster decisions.
✔ Complete Performance Overview
The Summary Page shows Total KPIs, MTD Target Met, and MTD Target Missed at a glance — helping you quickly understand your security performance status.
✔ Smart Slicers for Quick Analysis
Use Month and KPI Group slicers to instantly filter data by incidents, patrol activities, access control, compliance, or cybersecurity KPIs.
✔ Trend Analysis Charts
The Trend Page includes combo visuals for both MTD and YTD trends, allowing you to analyze performance movement across months and compare with previous year data.
✔ KPI Definition Knowledgebase
Drill through to view KPI formulas, units, LTB/UTB type, and detailed definitions — ensuring complete clarity for every metric.
✔ Excel-Based Input System
Easily update actual and target values through structured Excel sheets. Power BI auto-refreshes data with a single click.
📦 What’s Inside the Security KPI Dashboard in Power BI
When you download this product, you receive everything needed to track security performance end-to-end:
🗂 1. Power BI Dashboard File (.pbix)
Includes three fully designed pages:
-
Summary Page
-
KPI Trend Page
-
KPI Definition Page
📘 2. Excel Input File
Structured with:
-
Input_Actual Sheet
-
Input_Target Sheet
-
KPI Definition Sheet
🧠 3. Automated Visuals & Icons
Performance icons (▲ or ▼), interactive slicers, scorecards, data bars, and dynamic charts.
🛠 4. Ready-to-Use KPI List
Incident management, patrol activities, compliance scores, access control metrics, cybersecurity KPIs, and more.
🚀 How to Use the Security KPI Dashboard in Power BI
Using the dashboard is simple and beginner-friendly.
▶ Step 1: Update the Excel Input Files
Add monthly Actual MTD, Actual YTD, Target MTD, and Target YTD values.
▶ Step 2: Load the Files into Power BI
The dashboard automatically reads the Excel data.
▶ Step 3: Refresh the Dashboard
Click Refresh to update all visuals instantly.
▶ Step 4: Use Slicers to Analyze Trends
Filter by Month, KPI Group, or individual KPI.
▶ Step 5: Drill Through for Definitions
Review KPI formulas and definitions for better clarity.
This workflow ensures accurate reporting every month — without creating new files or charts.
🎯 Who Can Benefit from This Security KPI Dashboard in Power BI
This dashboard is perfect for security teams across every industry.
👨✈️ Security Managers & Supervisors
Track KPIs across incidents, guards, access control, and compliance.
🏢 Facility Management Teams
Monitor patrols, readiness, equipment issues, and emergency performance.
📊 Operations & Administration
Measure security efficiency, risk exposure, and reporting trends.
📑 Compliance Officers
Stay audit-ready with real-time monitoring of safety and compliance KPIs.
🛡 Cybersecurity Teams
Analyze alerts, breaches, and system downtime patterns.
Any organization that cares about safety, risk reduction, and operational clarity will find this dashboard extremely valuable.
### Click here to read the Detailed blog post
Watch the step-by-step video tutorial:


Reviews
There are no reviews yet.