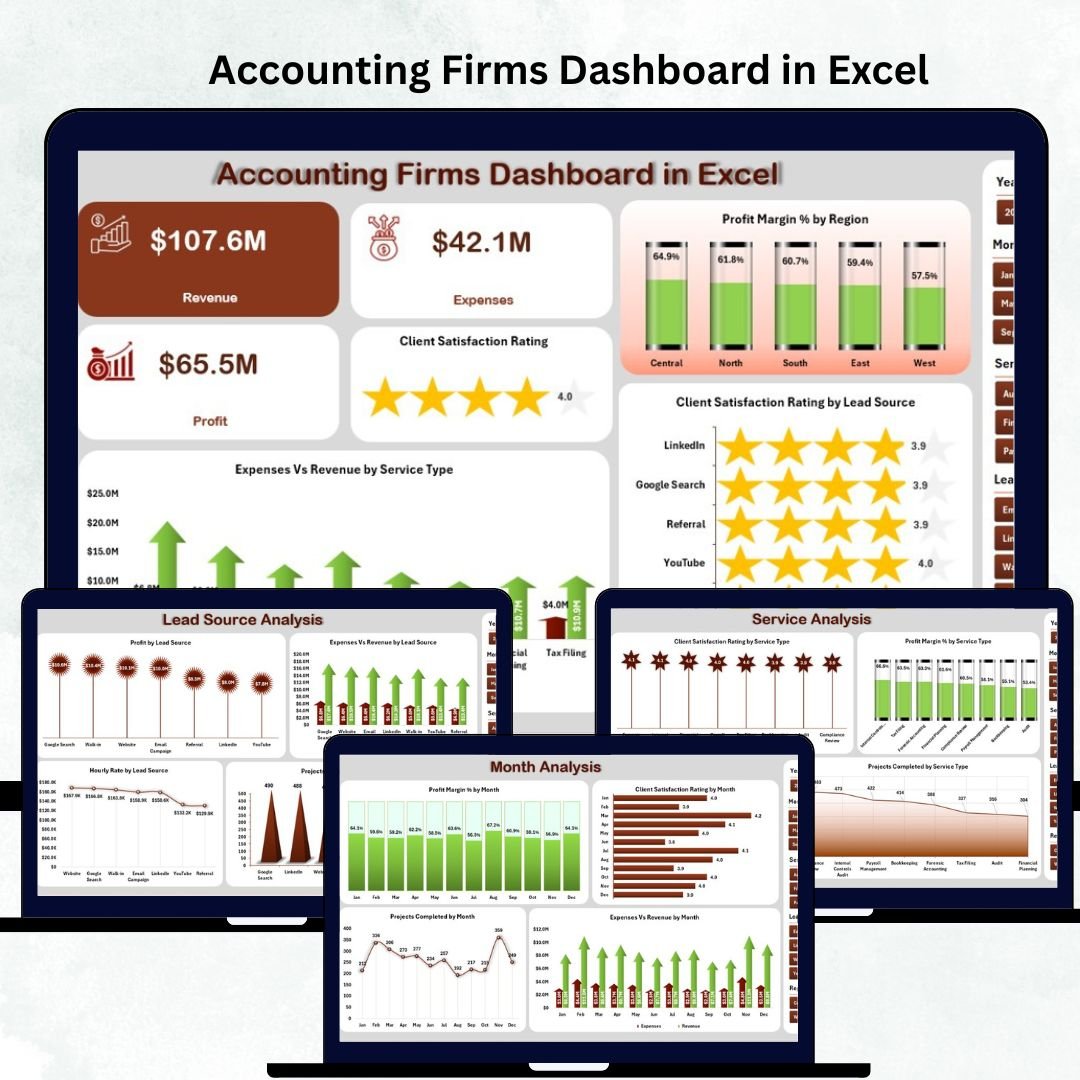
Accounting firms deal with an enormous amount of financial data daily—client revenue, project expenses, service performance, satisfaction ratings, engagement outcomes, and region-wise profitability. When all this information spreads across multiple spreadsheets and folders, teams lose visibility, leaders struggle to make decisions, and reporting becomes slow. To solve these challenges, we created the Accounting Firms Dashboard in Excel — a ready-to-use, visual, and interactive reporting system that consolidates every important metric into one powerful dashboard.
This dashboard gives accounting professionals a clear view of firm-wide performance. Whether you manage bookkeeping services, auditing, tax filing, advisory engagements, or corporate finance activities, this dashboard helps you analyze profitability, spot patterns, review ratings, and take immediate action. Built entirely in Excel, it requires no advanced tools—just enter the data, click refresh, and the dashboard updates automatically.
✨ Key Features of the Accounting Firms Dashboard in Excel
📍 Left-Side Page Navigator for Smooth Navigation
Move across all analytical pages using a simple one-click navigator. It saves time and makes analysis effortless for partners, managers, and analysts.
📊 5 Fully Interactive Pages for Complete Insights
The dashboard includes Overview, Engagement Analysis, Service Analysis, Lead Source Analysis, and Month Analysis pages—each designed to answer different performance questions.
💹 Auto-Refreshing KPI Cards & Charts
Every page includes pivot charts, pivot tables, slicers, and conditional formatting indicators that update instantly when you refresh the data.
👁️ Clear Visualization of Financial & Operational KPIs
Track revenue, expenses, profit margin %, projects completed, hourly billing rate, client feedback, region-wise performance, and more.
⚡ 100% Excel-Based – No Technical Skills Needed
Since everything runs inside Excel, anyone in your accounting firm can use this dashboard with ease.
📦 What’s Inside the Accounting Firms Dashboard in Excel
📁 1. Excel Dashboard File (.xlsx)
A fully designed, interactive dashboard with charts, cards, and slicers arranged across five high-impact analysis pages.
📊 2. Data Sheet
Enter all financial and operational details such as:
-
Revenue
-
Expenses
-
Engagement type
-
Service type
-
Lead source
-
Region
-
Client satisfaction
-
Projects completed
-
Monthly performance
Once updated, all pages refresh automatically.
🧩 3. Support Sheet
Stores calculated values, dropdown lists, and background formulas needed for automation. No manual edits required.
📈 4. Five Analytical Pages
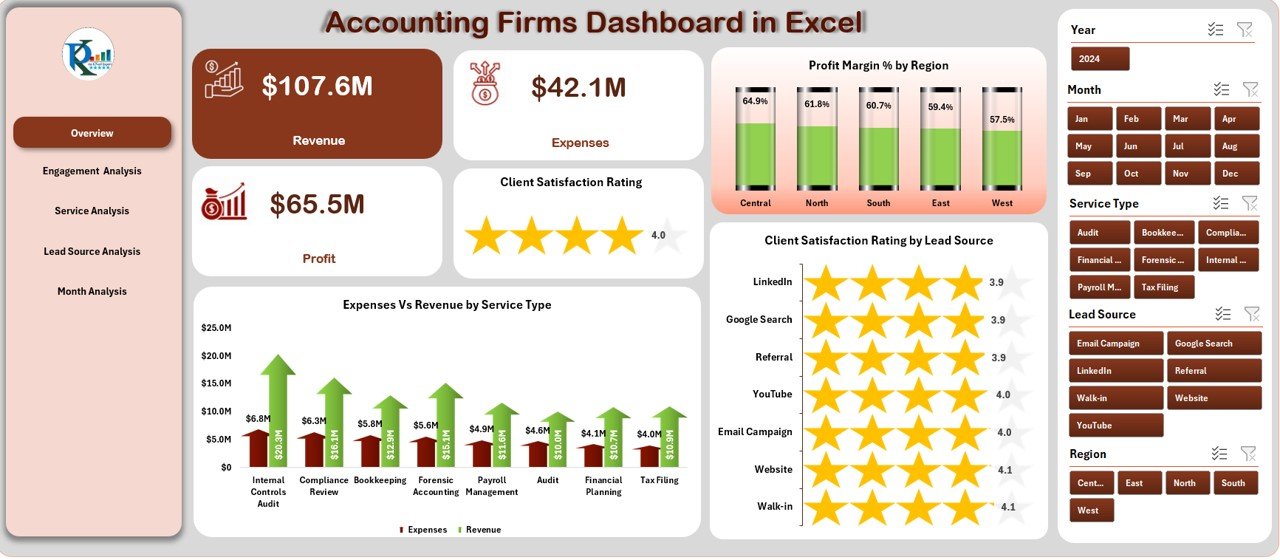
🟦 Overview Page – Firm-Level Performance Snapshot
Shows four KPI cards and three charts:
-
Profit Margin % by Region
-
Expenses vs Revenue by Service Type
-
Client Satisfaction Rating by Lead Source
Get instant clarity on profitability, service costs, and client experience.
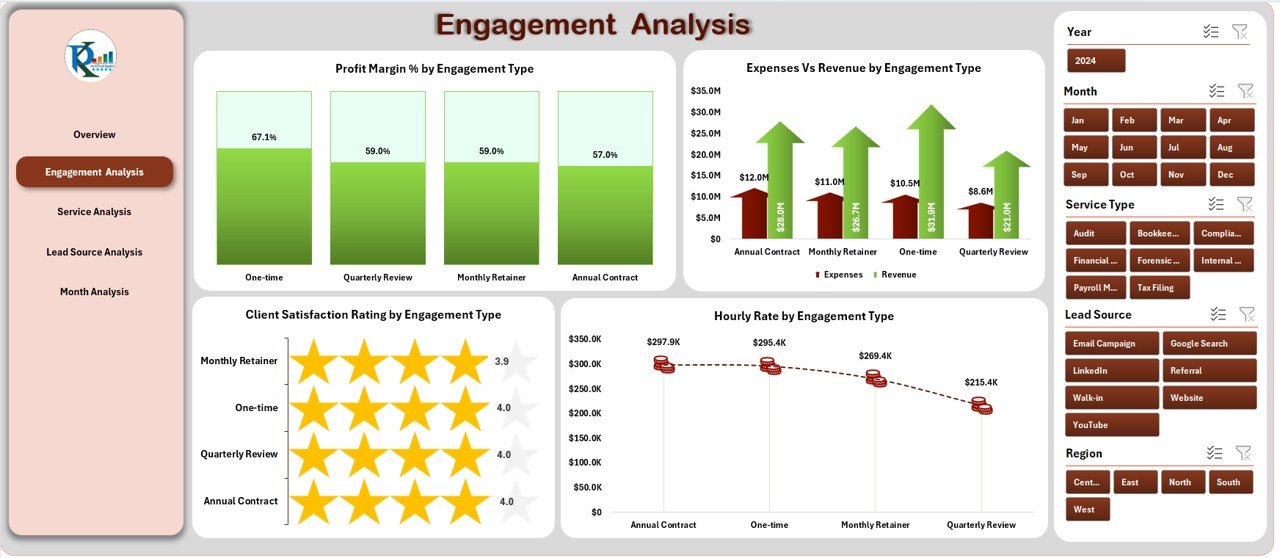
🟧 Engagement Analysis Page – Performance by Engagement Type
Review performance for audits, tax filings, compliance services, advisory, and consulting.
Charts include:
-
Profit Margin %
-
Expenses vs Revenue
-
Satisfaction Rating
-
Hourly Rate
Perfect for refining pricing, planning workload, and optimizing engagement strategy.
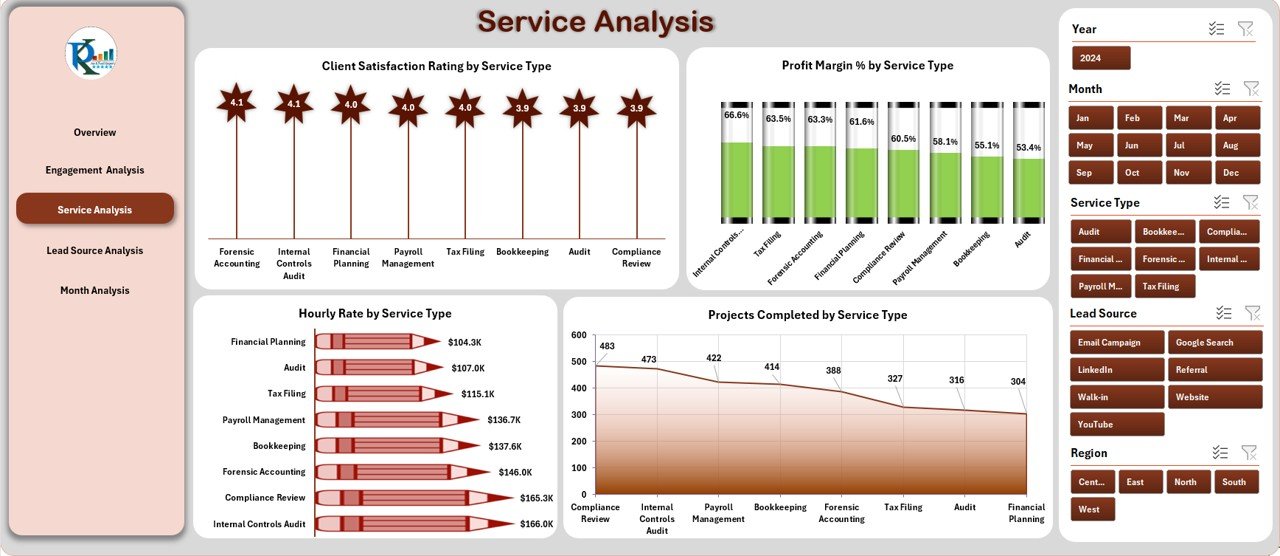
🟩 Service Analysis Page – Compare Service Performance
Track how each service type contributes to revenue and client satisfaction.
Includes:
-
Profit Margin % by Service
-
Satisfaction Rating by Service
-
Projects Completed by Service
-
Hourly Rate by Service
Use these insights to improve staff allocation and prioritize high-value services.
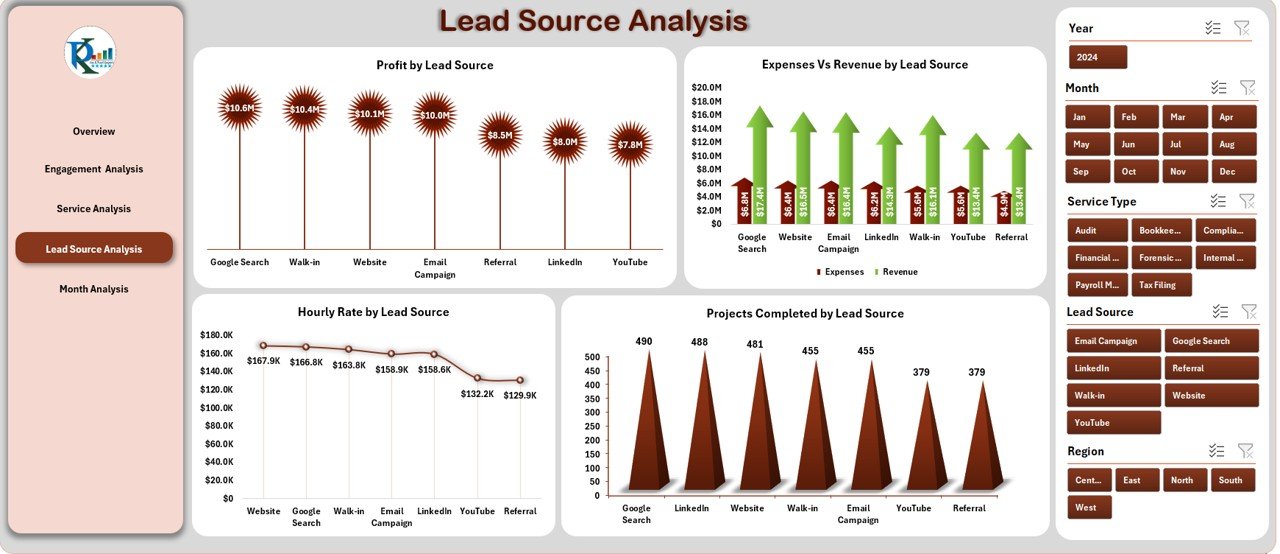
🟨 Lead Source Analysis Page – Understand Client Acquisition
Analyze which marketing channels deliver profitable clients.
Charts include:
-
Profit by Lead Source
-
Expenses vs Revenue
-
Projects Completed
-
Hourly Rate
Perfect for marketing planning and budget optimization.
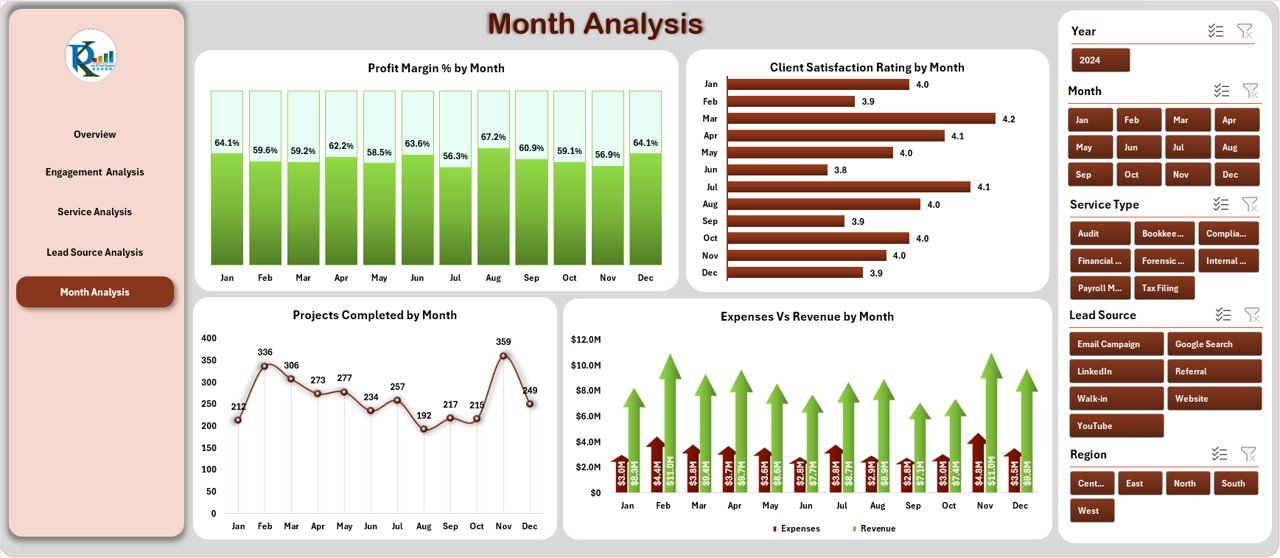
🟪 Month Analysis Page – Track Monthly Trends
Track seasonal and monthly patterns with charts showing:
-
Profit Margin %
-
Expenses vs Revenue
-
Client Satisfaction
-
Projects Completed
Helps you plan staffing, budgeting, and operational strategies with precision.
🛠️ How to Use the Accounting Firms Dashboard
1️⃣ Update Data Sheet
Add monthly performance details, service updates, engagement numbers, and revenue/expense entries.
2️⃣ Click Refresh All
All pivot tables and charts update automatically.
3️⃣ Use Slicers for Better Analysis
Filter results by region, service type, lead source, engagement type, or month.
4️⃣ Review KPIs & Patterns
Identify top-performing services, profitability variations, rating changes, and financial risks.
5️⃣ Plan With Confidence
Use insights to improve resource planning, pricing strategies, marketing channels, and operational efficiency.
🎯 Who Can Benefit from This Dashboard
🧑💼 Partners & Directors
Get a complete financial overview and make confident strategic decisions.
📊 Financial Analysts
Track margins, trends, operational costs, and performance insights quickly.
🧾 Accountants & Operations Teams
Monitor workload, project completion, and service performance easily.
💼 Business Development Teams
Analyze lead sources and conversion profitability to improve growth planning.
### Click hare to read the Detailed blog post
Visit our YouTube channel to learn step-by-step video tutorials
👉 Youtube.com/@PKAnExcelExpert


Reviews
There are no reviews yet.