The PPC Campaign KPI Dashboard in Power BI is your all-in-one analytical solution to measure, monitor, and maximize your digital advertising performance across Google Ads, Meta (Facebook), LinkedIn, and more.
In today’s fast-paced marketing world, every click, impression, and conversion matters. But without a unified, automated dashboard, tracking PPC performance becomes time-consuming and error-prone. That’s where this Power BI-based dashboard transforms raw ad data into interactive visuals — empowering marketers to focus on optimization, not spreadsheets.
With real-time metrics, MTD (Month-to-Date) and YTD (Year-to-Date) comparisons, and sleek visuals, this tool gives you the complete visibility needed to enhance ROI and make confident decisions.
✨ Key Features of the PPC Campaign KPI Dashboard in Power BI
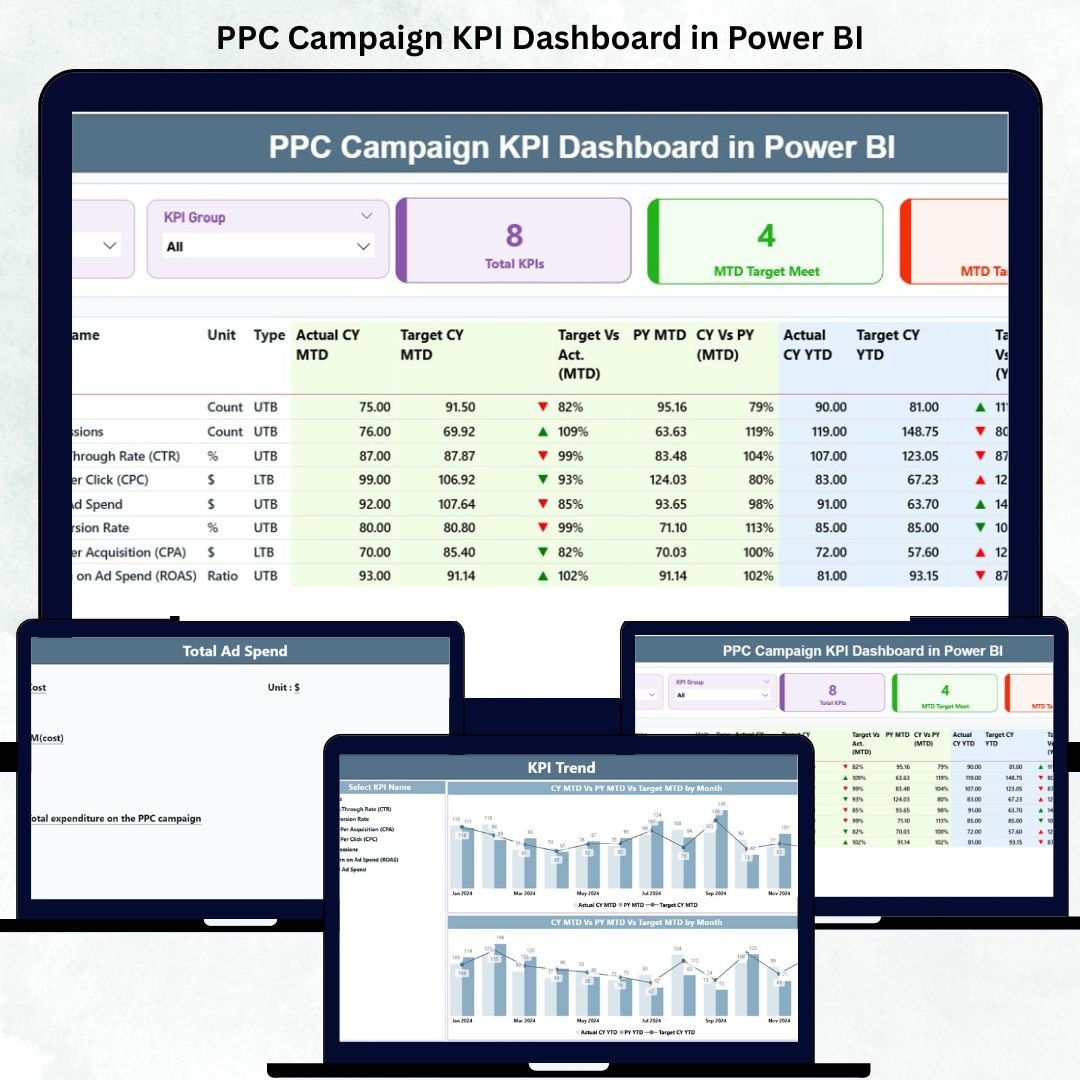
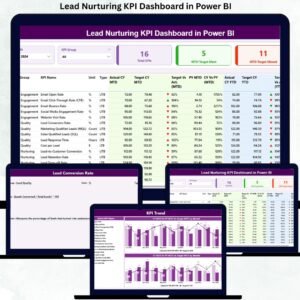
✅ 📊 Summary Page – Command Center for Marketers
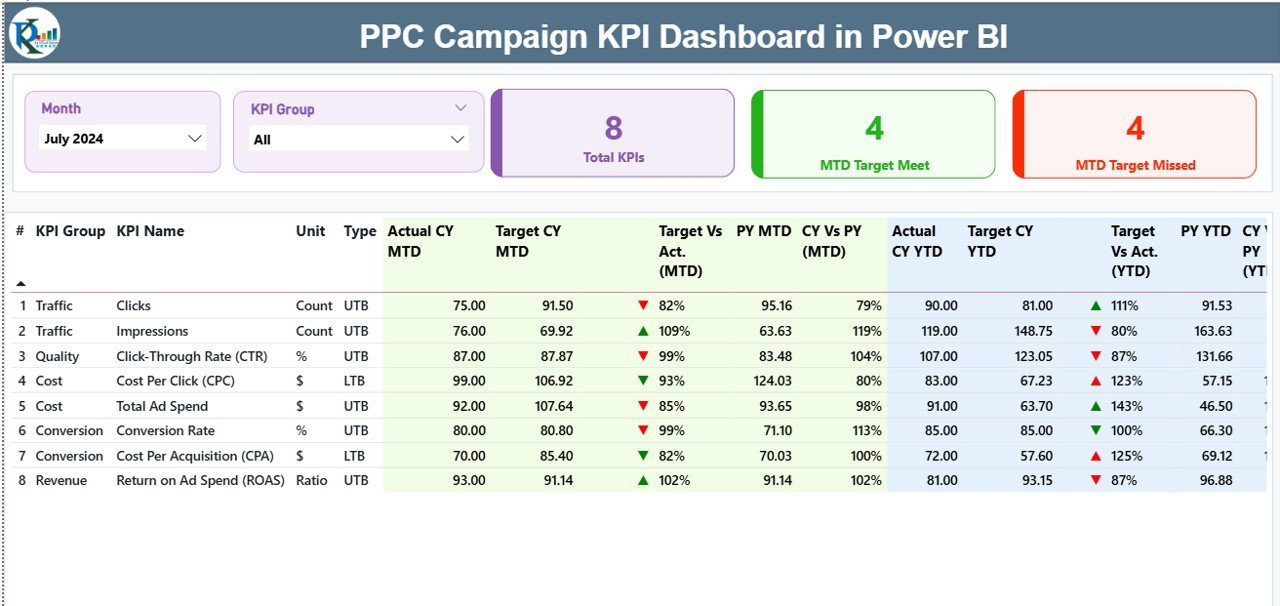
Your all-in-one performance snapshot.
-
KPI Cards: Total KPIs Count, MTD Target Met, MTD Target Missed.
-
Interactive Table: Displays detailed KPI info including Actual vs Target, CY vs PY, KPI Type (UTB/LTB), and performance icons.
-
Slicers: Filter results by Month or KPI Group for focused analysis.
💡 Instantly view which campaigns are exceeding expectations and which need attention.
✅ 📈 KPI Trend Page – Visualize Performance Over Time
Analyze progress month by month.
-
Dual combo charts for MTD and YTD comparisons.
-
Select any KPI (e.g., CTR, CPC, ROI) using the slicer.
-
Visual trends reveal seasonal dips, campaign peaks, and performance shifts.
📆 Spot patterns and make timely optimizations to sustain growth.
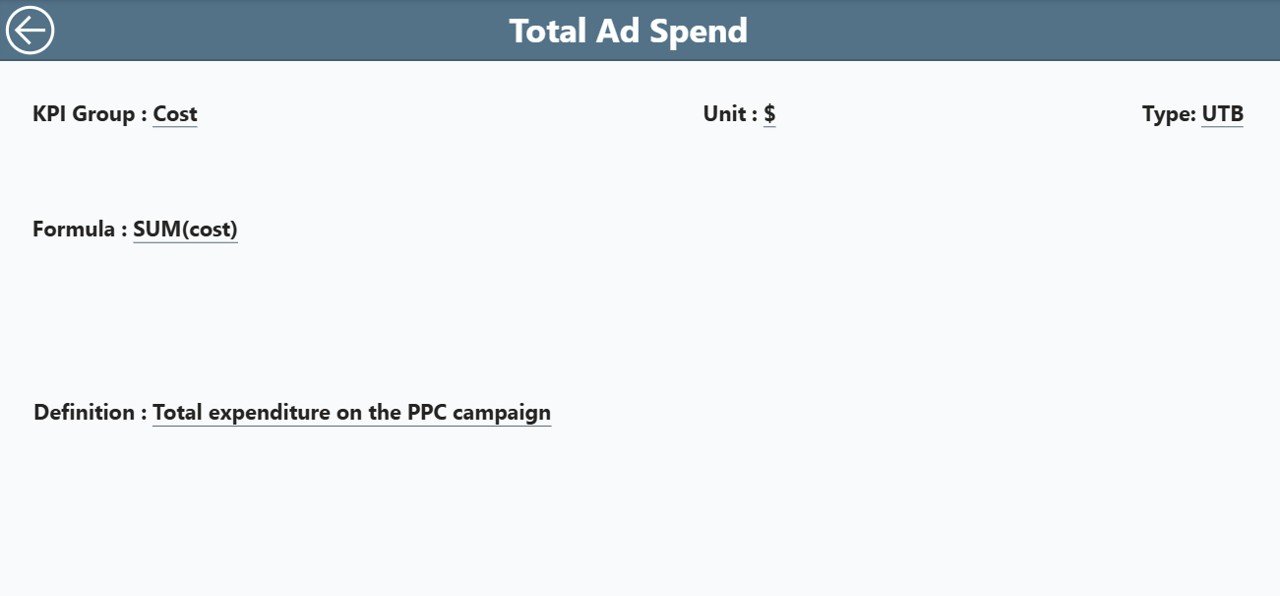
✅ 📘 KPI Definition Page – Complete Transparency
Understand every metric at a glance.
-
Drill-through feature from the Summary Page for detailed KPI definitions.
-
View formulas, units, and types (LTB or UTB).
-
Easy “Back” navigation to return to your main dashboard view.
🧠 Perfect for agencies and teams to align on how KPIs are calculated and interpreted.
📦 What’s Inside the Dashboard
📁 Three Core Pages: Summary | KPI Trend | KPI Definition
📂 Excel-Integrated Data Source: Update your input files and Power BI auto-refreshes visuals.
Includes:
-
Input_Actual– Actual MTD/YTD values. -
Input_Target– Target MTD/YTD goals. -
KPI_Definition– KPI formulas, units, and definitions.
⚙️ No coding required — just connect, refresh, and analyze.
🧭 Who Can Benefit from This Dashboard
💼 Digital Marketing Managers – Monitor ROI, CPC, and CTR trends.
📊 Ad Agencies – Present client results with interactive visuals.
🧠 Business Owners – Gain real-time clarity on ad efficiency.
💰 Performance Analysts – Compare YTD vs PY data for strategic insights.
📈 Media Buyers – Evaluate multi-platform performance in one unified report.
Whether you run one campaign or hundreds, this dashboard scales effortlessly.
💡 Advantages of the PPC Campaign KPI Dashboard in Power BI
✅ Centralized Analytics: View all campaign KPIs from Google, Meta, LinkedIn, and Bing in one place.
✅ Real-Time Visibility: Instantly identify under- or over-performing ads.
✅ Automated Insights: Skip manual Excel reports — Power BI updates instantly.
✅ Clear Visual Storytelling: Use charts, icons, and color coding (🟢 Green = On Target, 🔴 Red = Below Target).
✅ Time Efficiency: Save hours of reporting time every month.
✅ Year-Over-Year Comparison: Measure continuous growth through CY vs PY analysis.
✅ Customizable: Add new KPIs, modify visuals, or apply your brand colors easily.
📈 Perfect for both in-house marketers and PPC agencies aiming to deliver transparency and performance clarity.
⚙️ How to Use the Dashboard
1️⃣ Open the Power BI file and connect your Excel dataset.
2️⃣ Refresh the data for automatic KPI updates.
3️⃣ Use slicers to view performance by month or KPI group.
4️⃣ Drill into trends or KPI definitions for deeper insights.
5️⃣ Export reports as PDFs or share live dashboards securely.
💡 You can also schedule automatic refreshes to get updated visuals daily or weekly.
🎯 Best Practices
✅ Keep data consistent across input sheets.
✅ Update Excel source monthly for accurate MTD & YTD metrics.
✅ Focus on 10–15 essential KPIs instead of data overload.
✅ Use color-coding (🟢/🔴/🟡) for faster performance interpretation.
✅ Train your marketing team to use slicers and drill-throughs effectively.
🔗 Click here to read the Detailed Blog Post
🎥 Visit our YouTube channel to learn step-by-step video tutorials


Reviews
There are no reviews yet.