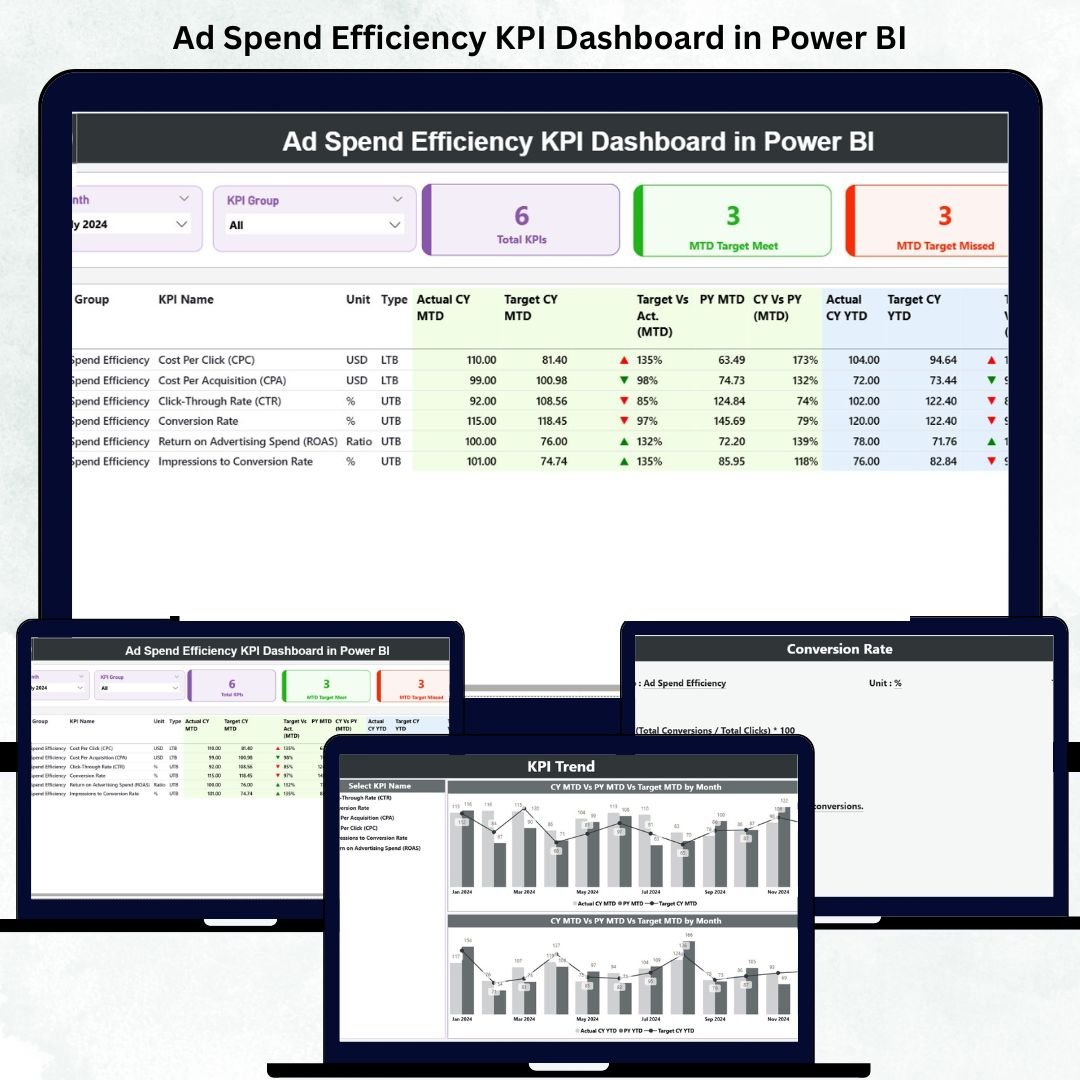
The Ad Spend Efficiency KPI Dashboard in Power BI is a game-changing tool for digital marketers, analysts, and decision-makers who want to spend smarter—not more.
In today’s marketing world, budgets flow across multiple channels—Google Ads, Meta, LinkedIn, YouTube, and beyond. But knowing which campaigns deliver true ROI can be complex. This ready-to-use Power BI dashboard turns scattered ad data into actionable insights, helping you visualize costs, performance, and conversions in real time.
Built on Microsoft Power BI, it consolidates multiple ad-platform data streams and translates them into KPIs like Cost Per Click (CPC), Cost Per Lead (CPL), Return on Ad Spend (ROAS), Conversion Rate, and Customer Acquisition Cost (CAC). The result? A crystal-clear view of how efficiently your ad budget drives business results.
✨ Key Features of the Ad Spend Efficiency KPI Dashboard in Power BI
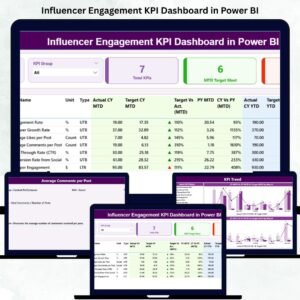
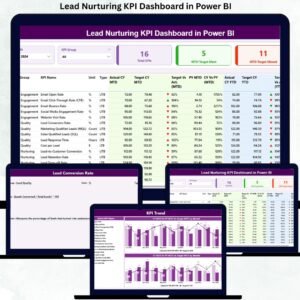
✅ 📊 Summary Page – Your Ad Performance Hub
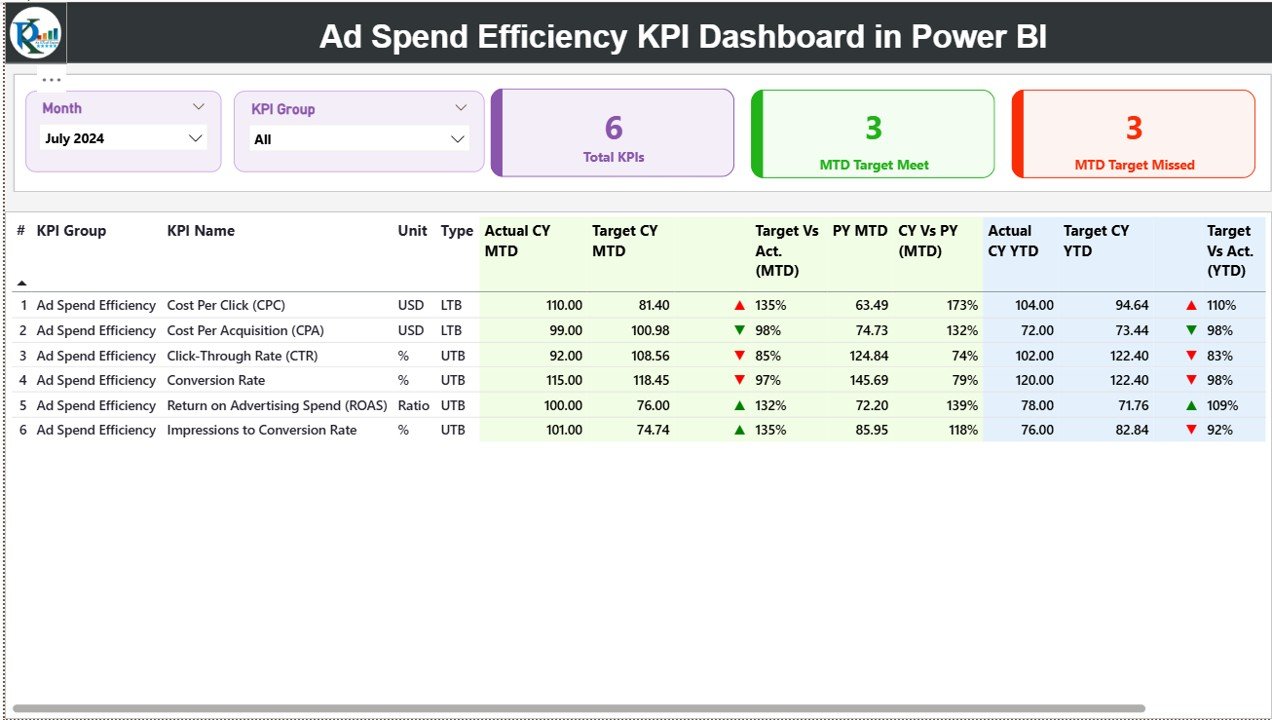
See every essential KPI in one place.
-
KPI Cards: Total KPIs Tracked, MTD Target Met, MTD Target Missed.
-
Dynamic Table: KPI Name, Group, Unit (% or USD), Type (LTB/UTB), Actual vs Target, CY vs PY Performance.
🎯 Instantly spot which metrics are on target and which need attention with green ▲ or red ▼ icons.
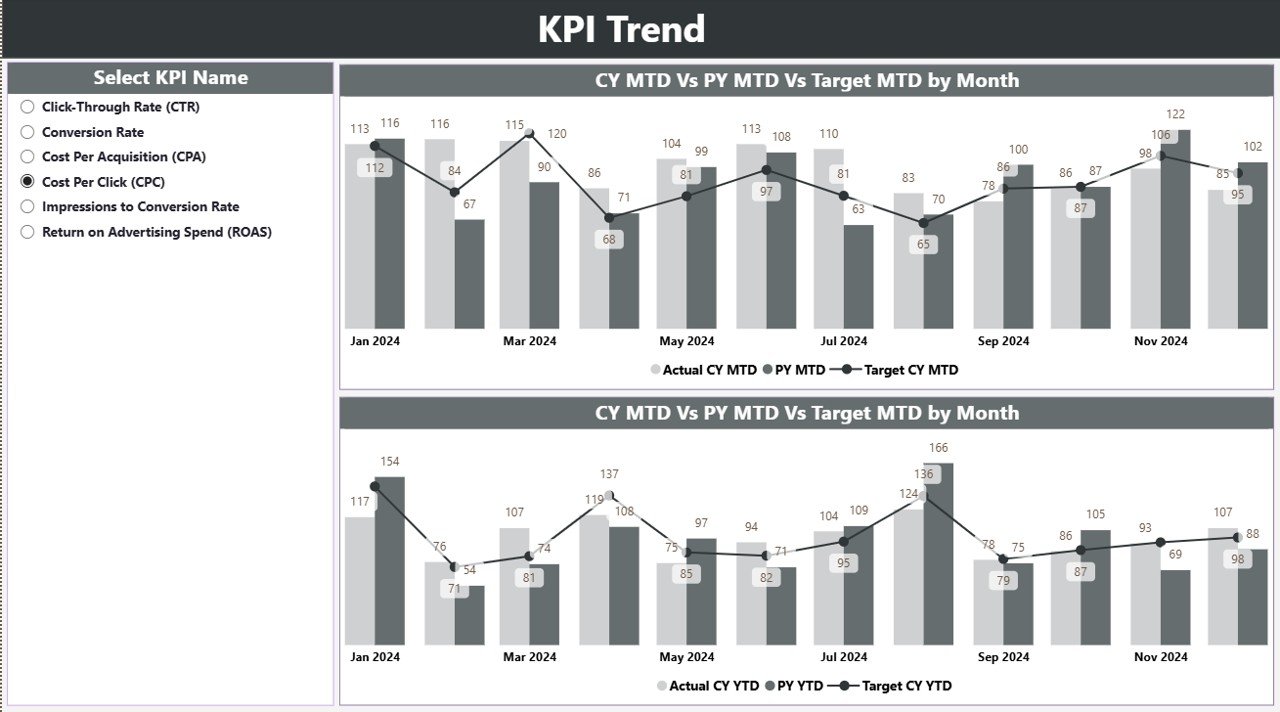
✅ 📈 KPI Trend Page – Track Performance Over Time
Visualize month-over-month changes in key metrics.
-
Compare Current Year (CY) vs Previous Year (PY).
-
Combo charts for MTD and YTD views.
💡 Identify seasonal patterns, detect ad spend inefficiencies, and forecast performance trends instantly.
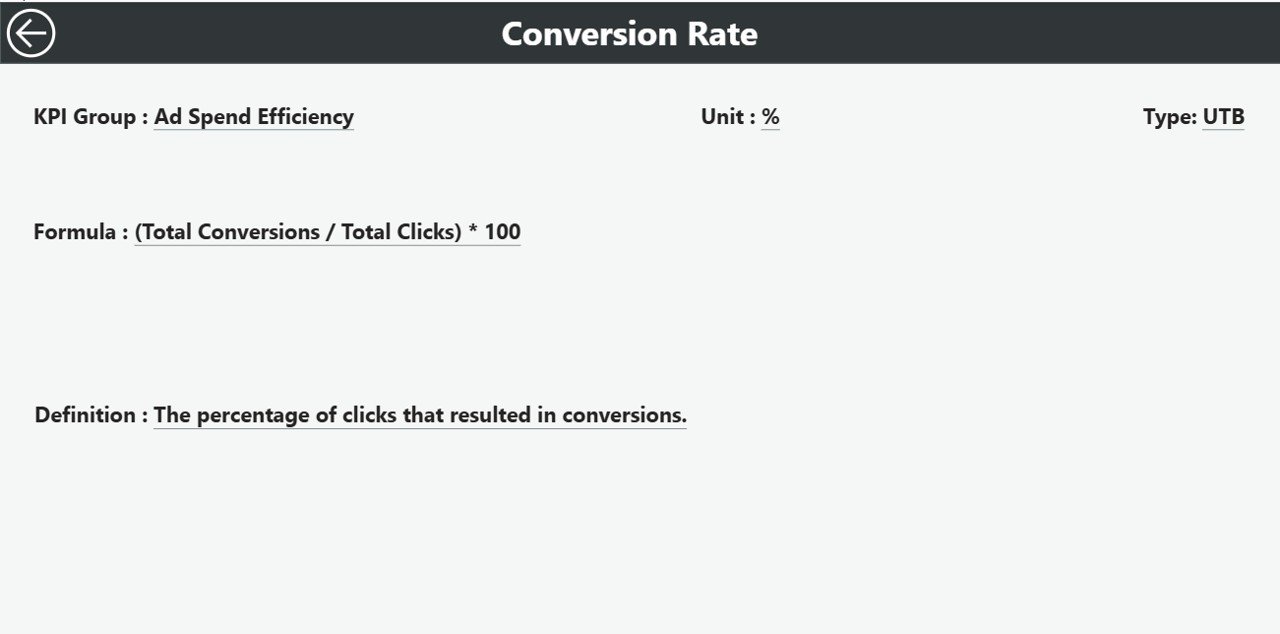
✅ 🧮 KPI Definition Page – Built-In Reference Guide
Drill through from the Summary Page to understand each metric.
-
View formula, definition, and performance type (LTB/UTB).
-
Back button for easy navigation.
🧠 Ensure clarity for marketers, analysts, and executives reviewing metrics together.
✅ 📊 Excel Data Integration – Easy Maintenance
The dashboard pulls live data from Excel files with three tabs:
-
Input_Actual: Monthly KPI values (MTD/YTD).
-
Input_Target: Target values for comparison.
-
KPI Definition: Formulas and types for each metric.
🔄 Just update Excel and Power BI refreshes automatically—no manual work needed.
📦 What’s Inside the Dashboard
📁 Three Interactive Pages: Summary | KPI Trend | KPI Definition
💡 Core KPIs Included:
-
Cost Per Click (CPC)
-
Cost Per Lead (CPL)
-
Return on Ad Spend (ROAS)
-
Conversion Rate (%)
-
Customer Acquisition Cost (CAC)
-
Click-Through Rate (CTR)
-
Impressions vs Conversions
📈 Each KPI is color-coded and automatically updated for both MTD and YTD performance — making reporting faster and smarter.
⚙️ How to Use the Dashboard
1️⃣ Connect your Excel file containing KPI data.
2️⃣ Use the Month Selector and KPI Group Slicer to filter data instantly.
3️⃣ Monitor the Summary Page for target status (▲ green = on track, ▼ red = underperforming).
4️⃣ Drill through to the Definition Page for clarity on each KPI.
5️⃣ Check the Trend Page for MTD and YTD patterns to adjust ad strategies.
💡 Within minutes, you’ll know where your budget is winning and where to optimize.
👥 Who Can Benefit from This Dashboard
🎯 Digital Marketers – Optimize budget allocation across channels.
📊 Marketing Analysts – Track KPI performance in real time.
💻 Agencies – Create transparent client reports with visual ROI insights.
💼 Executives & CMOs – View spend efficiency at a strategic level.
💰 Finance Teams – Correlate marketing spend with business outcomes.
This dashboard is a must-have for any organization looking to maximize advertising ROI and make data-backed decisions.
🔗 Click here to read the Detailed Blog Post
🎥 Visit our YouTube channel to learn step-by-step video tutorials


Reviews
There are no reviews yet.