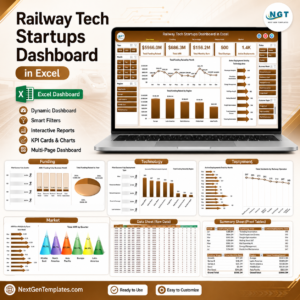
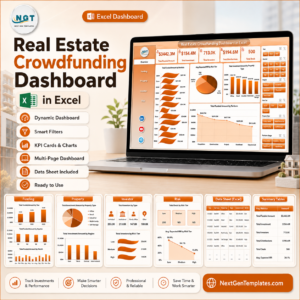
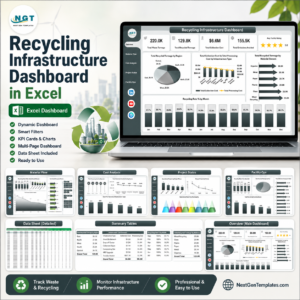
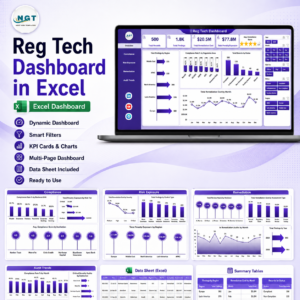
Engineering projects involve hundreds of moving parts — deadlines, budgets, risks, and resources. Tracking them manually often leads to confusion, delays, and poor decisions. That’s where the Engineering Dashboard in Excel comes in — a ready-to-use analytical tool designed to help engineering professionals visualize project progress, financial performance, and team efficiency — all in one dynamic dashboard.
Whether you manage construction, manufacturing, design, or software engineering, this dashboard transforms complex project data into simple, interactive insights. Built with Excel’s advanced formulas and pivot charts, it empowers you to make faster, data-driven decisions without any coding or complicated setup.
⚙️ Key Features of the Engineering Dashboard in Excel
✅ 📊 Five Analytical Pages + Support Sheet – A complete performance monitoring system structured for clarity, precision, and impact.
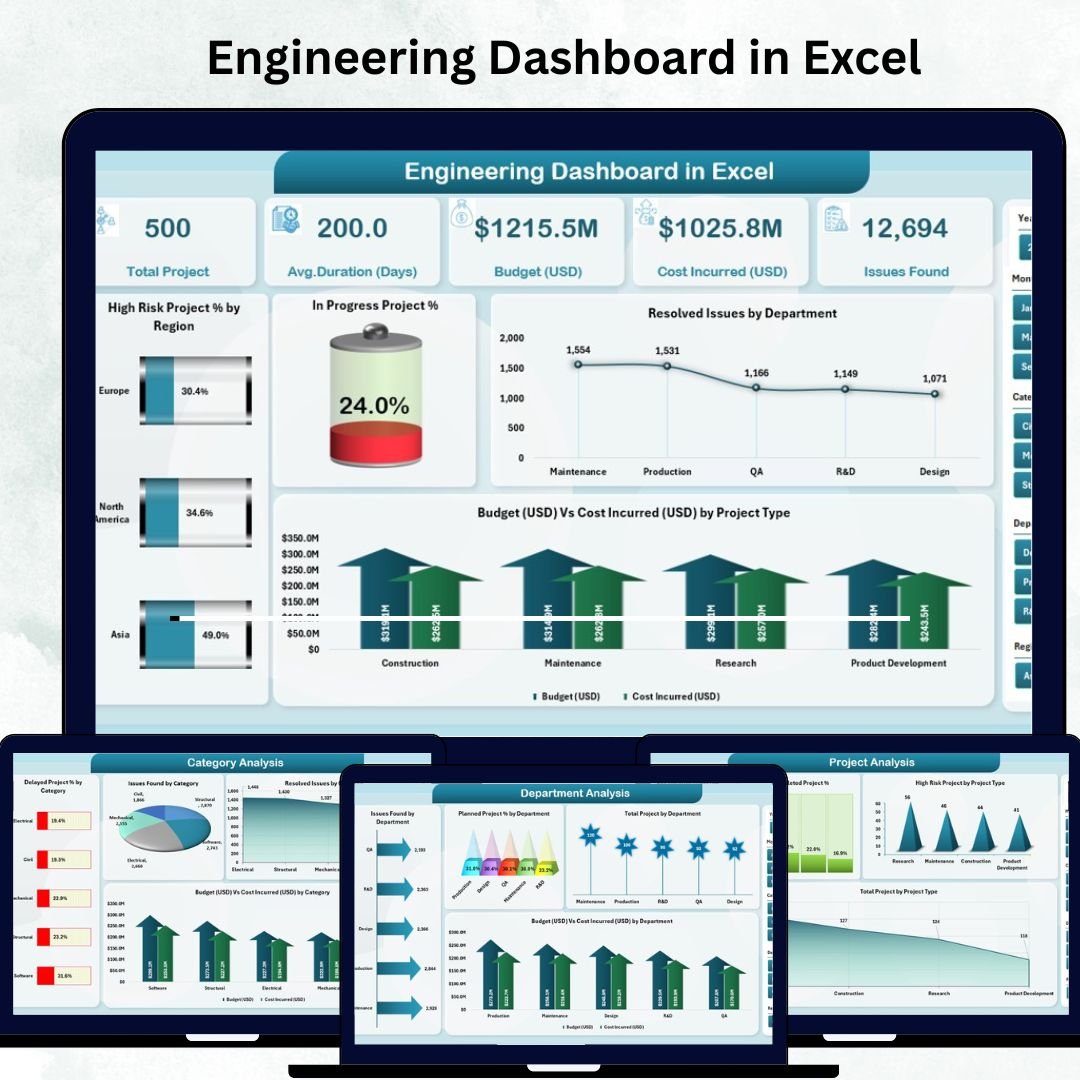
🧭 1. Overview Page – The Control Center
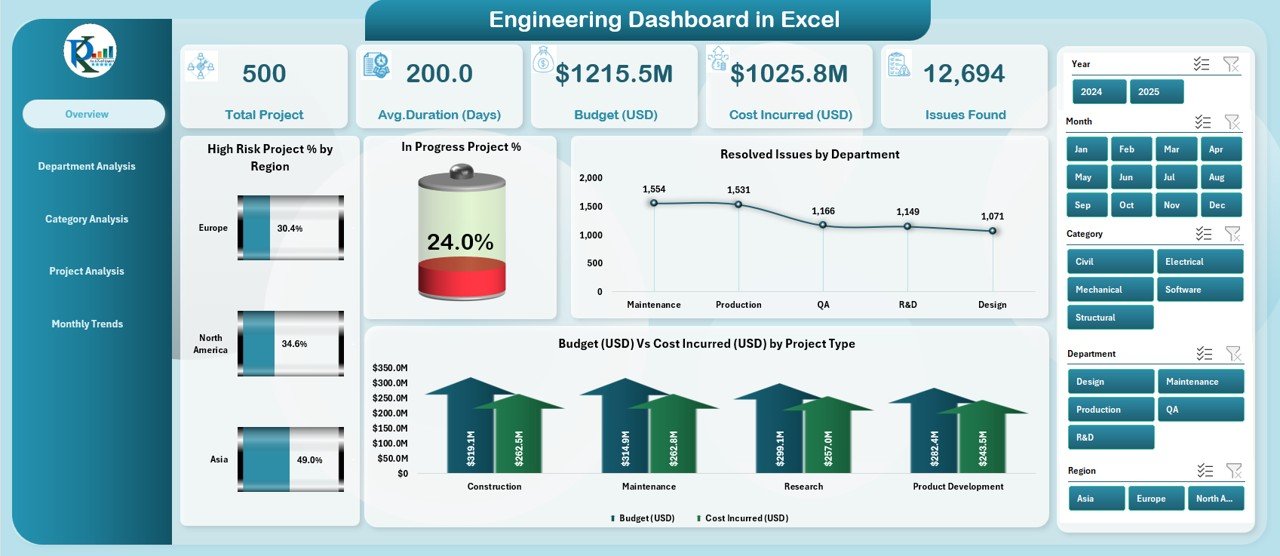
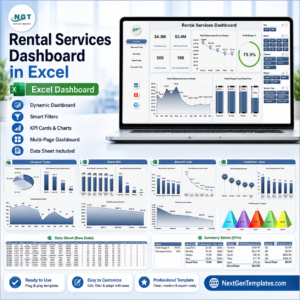
Gain instant visibility into your engineering operations with summarized KPIs and key visuals.
Includes:
-
📈 Five KPI Cards: Total Projects, High-Risk Project %, Completed Projects, Total Budget (USD), Total Cost (USD).
-
🎛️ Slicers: Quickly filter by Region, Department, or Project Type.
-
📊 Charts:
-
High-Risk Project % by Region
-
In-Progress Project %
-
Resolved Issues by Department
-
Budget vs. Cost Incurred by Project Type
-
👉 This page offers an at-a-glance understanding of overall project performance, risk exposure, and financial efficiency.
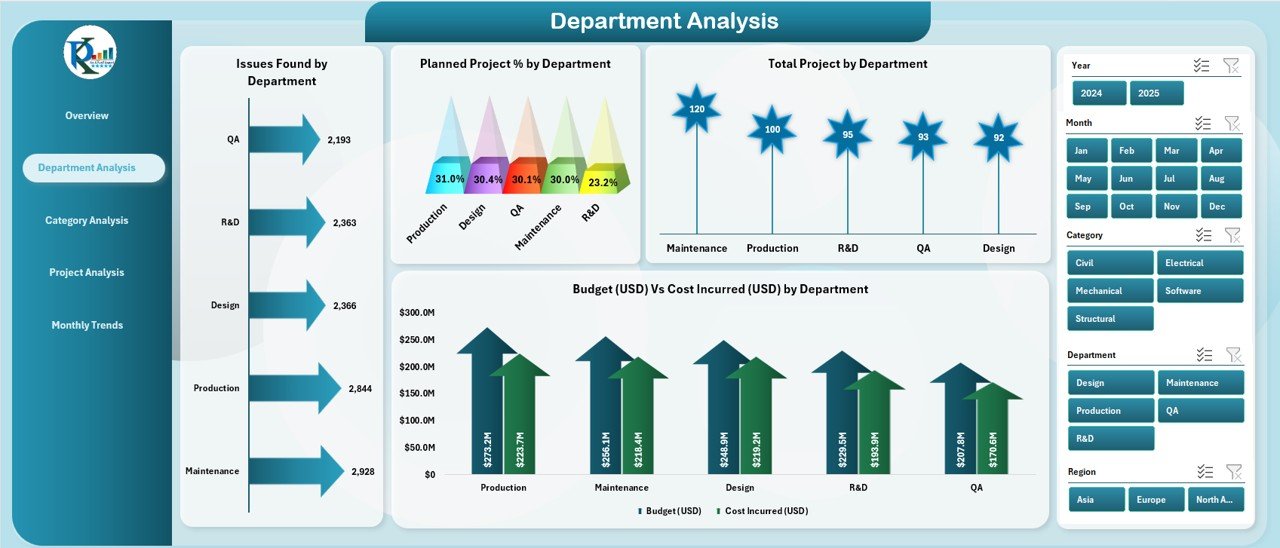
🏢 2. Department Analysis Page – Compare Department Performance
Dive deeper into departmental efficiency, issue frequency, and cost management.
Charts Featured:
-
Issues Found by Department
-
Planned Project % by Department
-
Total Projects by Department
-
Budget vs. Cost Incurred by Department
📊 Perfect for identifying high-performing teams and departments that need optimization.
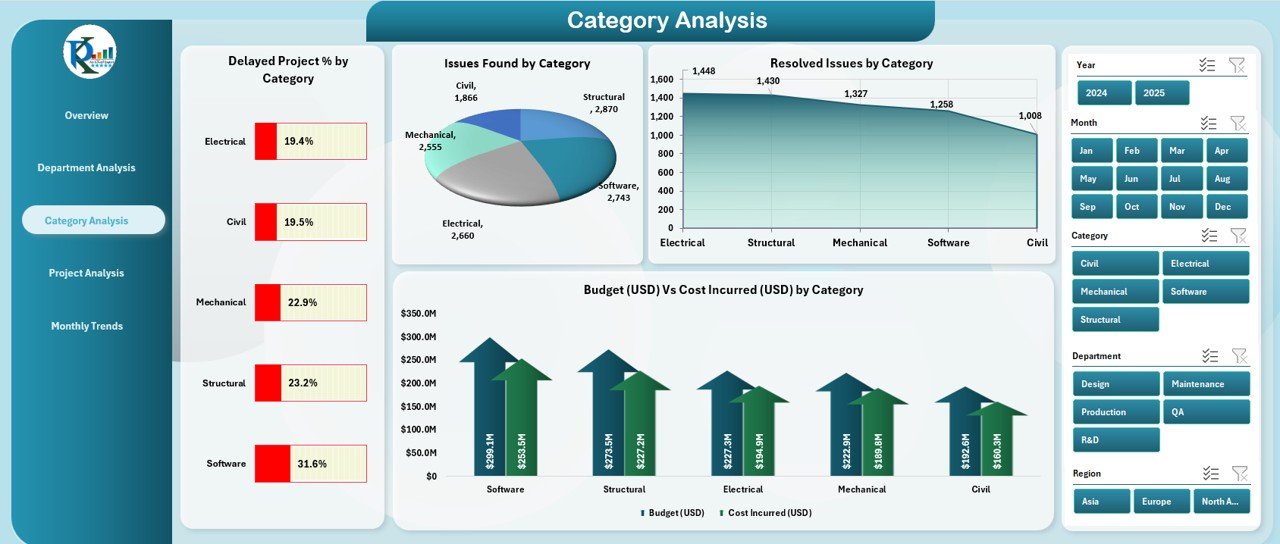
🧩 3. Category Analysis Page – Evaluate Project Categories
Compare different project types or categories such as Infrastructure, Design, Software, or Maintenance.
Visual Insights Include:
-
Delayed Project % by Category
-
Issues Found by Category
-
Total Projects by Category
-
Budget vs. Cost Incurred by Category
💡 This helps pinpoint which categories drive success and which require improved planning or resources.
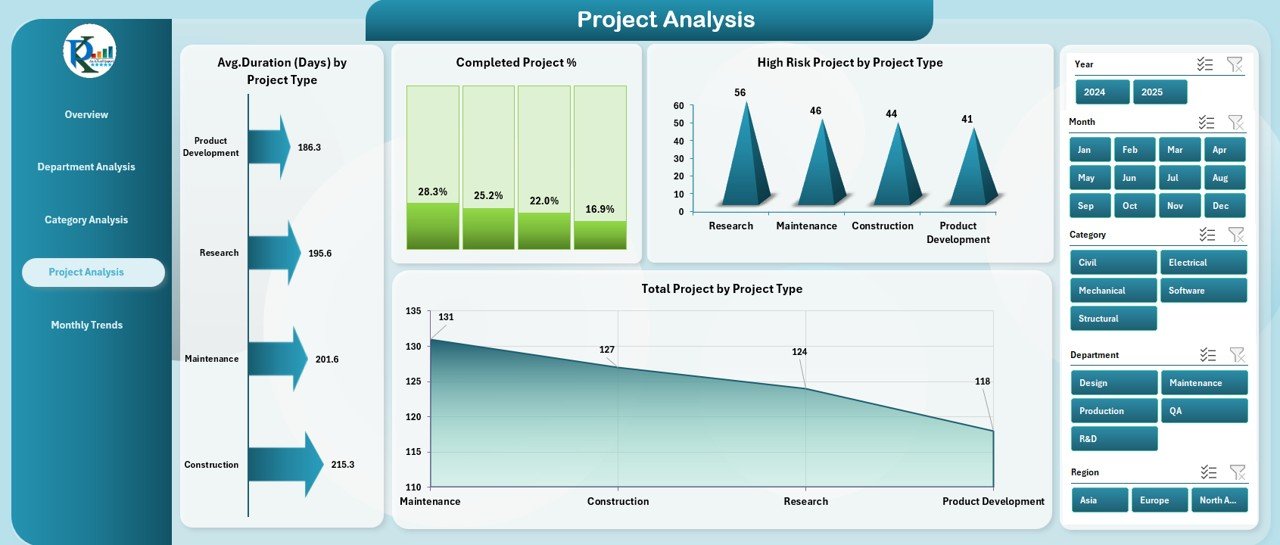
📁 4. Project Analysis Page – Drill into Project-Level Data
Get a focused view of performance at the individual project level.
Charts:
-
Average Duration (Days) by Project Type
-
Completed Project %
-
High-Risk Projects by Type
-
Total Projects by Type
🎯 Identify inefficiencies, evaluate workload balance, and measure outcomes across multiple project types.
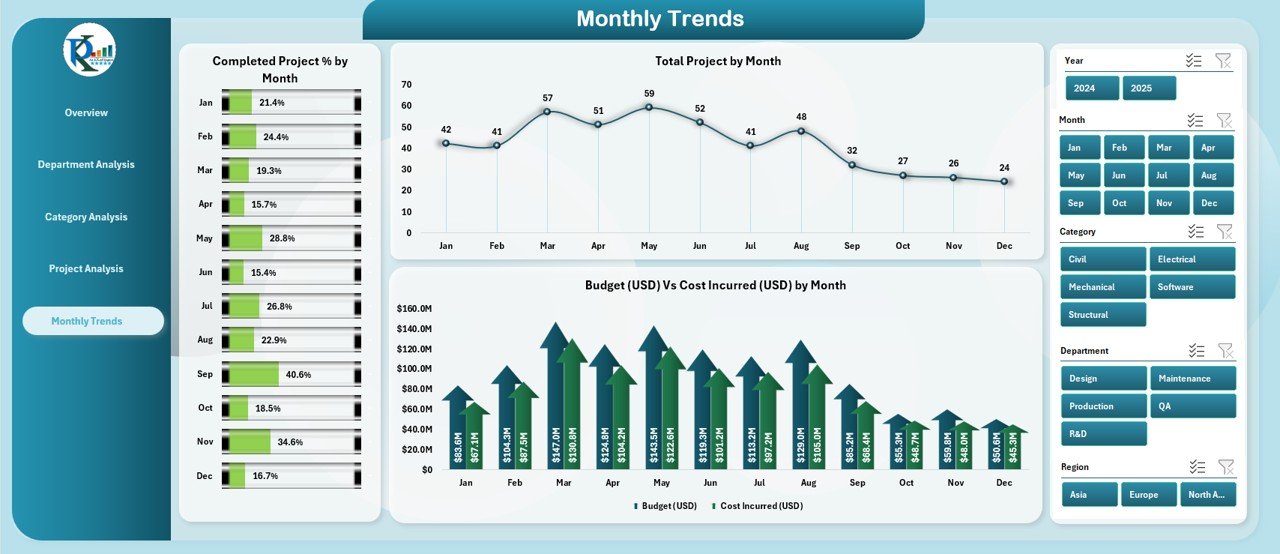
📅 5. Monthly Trends Page – Monitor Progress Over Time
Visualize how project results evolve month by month.
Charts Include:
-
Completed Project % by Month
-
Total Projects by Month
-
Budget vs. Cost Incurred by Month
📆 Perfect for tracking long-term performance, cost fluctuations, and seasonal patterns.
🧮 What’s Inside the Dashboard
📘 Data Sheet: Stores all raw project records such as cost, budget, issues, and completion status.
📙 Support Sheet: Manages dropdown lists, department names, and reference data to power slicers.
📈 Dynamic Charts: Refresh automatically whenever new data is entered.
💻 Pre-Built Formulas: Automate performance calculation and eliminate manual errors.
🚀 How to Use the Engineering Dashboard in Excel
1️⃣ Enter or import project data into the Data Sheet.
2️⃣ Click “Refresh All” to update KPIs and charts automatically.
3️⃣ Use slicers to filter results by department, category, or month.
4️⃣ Review key visuals for high-risk, delayed, or cost-heavy projects.
5️⃣ Export visuals or print summaries for presentations and reports.
Even non-technical users can analyze project performance effortlessly!
👨💼 Who Can Benefit from This Dashboard
🔹 Engineering Project Managers – Track budgets, risks, and milestones.
🔹 Department Heads – Compare team output and workload.
🔹 Financial Analysts – Review cost vs. budget deviations.
🔹 Quality Assurance Teams – Monitor issues and resolution trends.
🔹 Executives – Gain a holistic view of operations and efficiency.
Whether you’re in construction, energy, manufacturing, or technology, this Excel template adapts perfectly to your reporting needs.
🌟 Why Choose the Engineering Dashboard in Excel
✅ Centralized view of all project KPIs
✅ Automated, real-time analysis
✅ Interactive visuals and slicers
✅ No coding or add-ins required
✅ Customizable charts and design
✅ Affordable and beginner-friendly
✅ Ideal for individuals and enterprises alike
This dashboard helps you save time, control budgets, and optimize resources, all from a single, professional Excel interface.
🔗 Click here to read the Detailed blog post
📺 Visit our YouTube channel for step-by-step tutorials
👉 YouTube.com/@PKAnExcelExpert


Reviews
There are no reviews yet.