In the fast-paced digital world, brand reputation is everything — and Public Relations (PR) is at the heart of it. But tracking sentiment, media reach, and campaign effectiveness manually can be overwhelming. That’s why the Public Relations (PR) Dashboard in Power BI is a game-changing tool for communication professionals.
This ready-to-use Power BI dashboard transforms raw PR metrics into visual stories and actionable insights. Whether you’re monitoring media mentions, campaign costs, or sentiment scores, this dashboard helps PR managers and marketing teams make informed, real-time decisions that strengthen brand credibility.
Built in Power BI, it connects directly to Excel or live data sources, bringing automation, interactivity, and analytical depth to PR reporting — no coding required.
⚙️ Key Features of the PR Dashboard in Power BI
✅ 📊 Five Insightful Pages – Overview, Channel Analysis, Region Analysis, Event Analysis, and Monthly Trends — all connected through dynamic slicers and visuals.
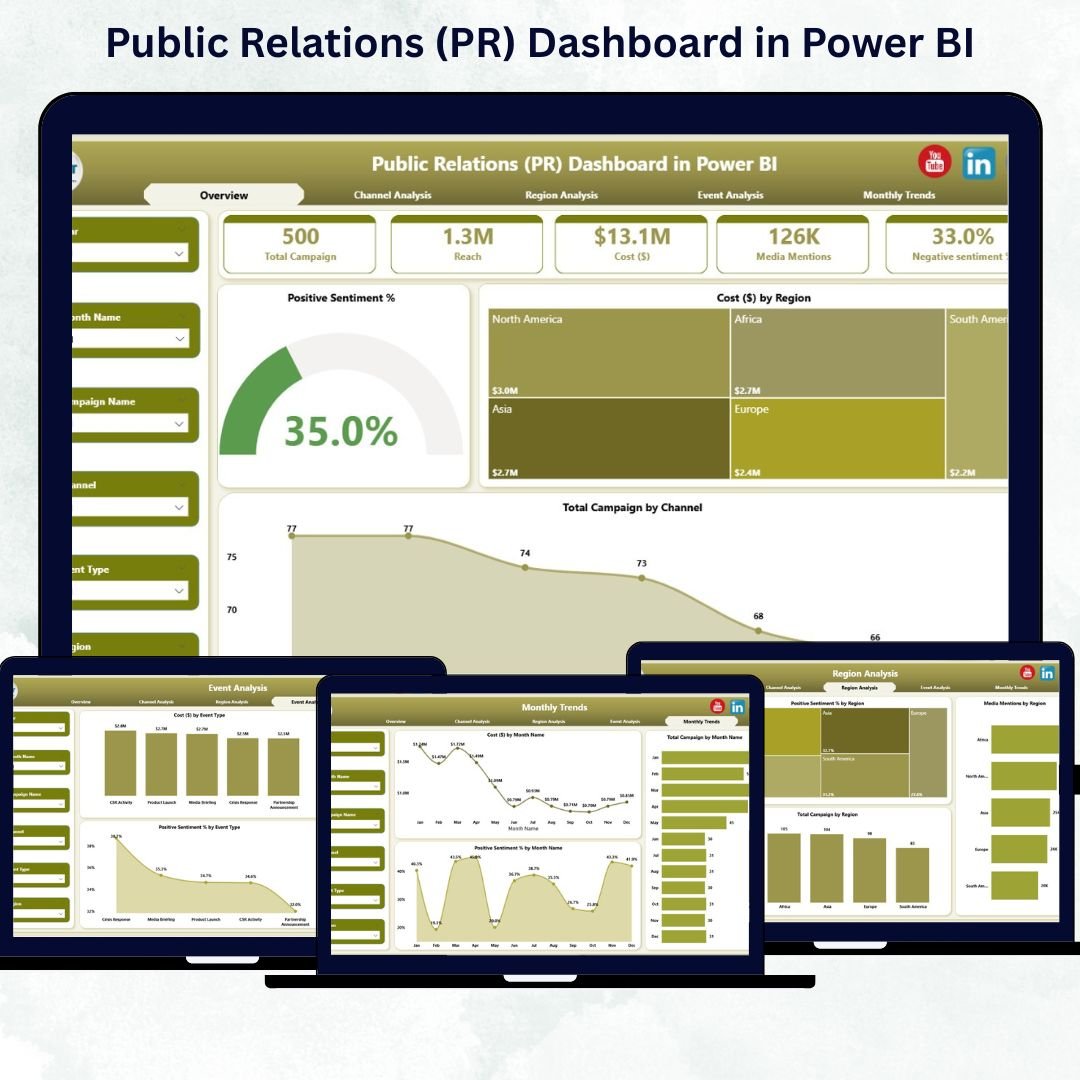
🏁 1. Overview Page – Your PR Command Center
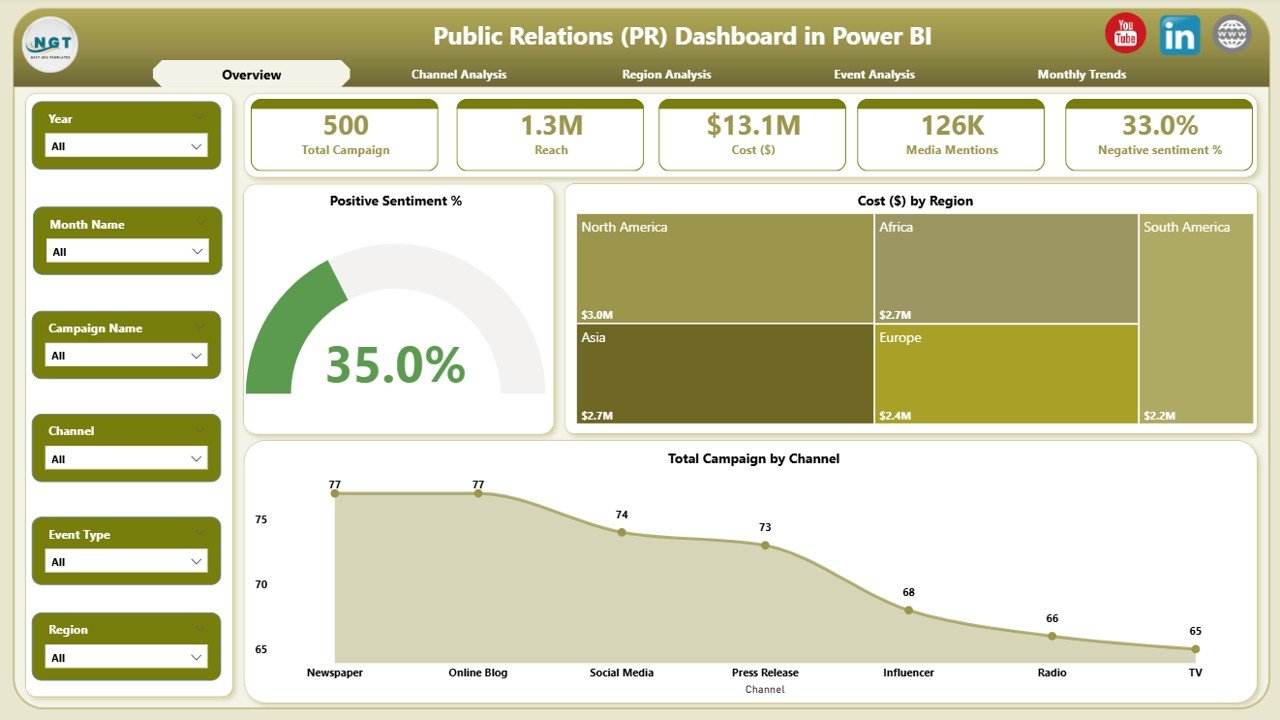
This is the main control panel that gives a bird’s-eye view of your entire PR performance.
Includes:
-
🧾 Five KPI Cards: Total Campaigns, Positive Sentiment %, Total Cost ($), and more.
-
🎛️ Interactive Slicers: Filter by Region, Channel, or Event Type.
-
📈 Charts: Positive Sentiment %, Cost ($) by Region, and Total Campaigns by Channel.
👉 This page helps decision-makers instantly gauge campaign health, brand perception, and cost efficiency — all in one glance.
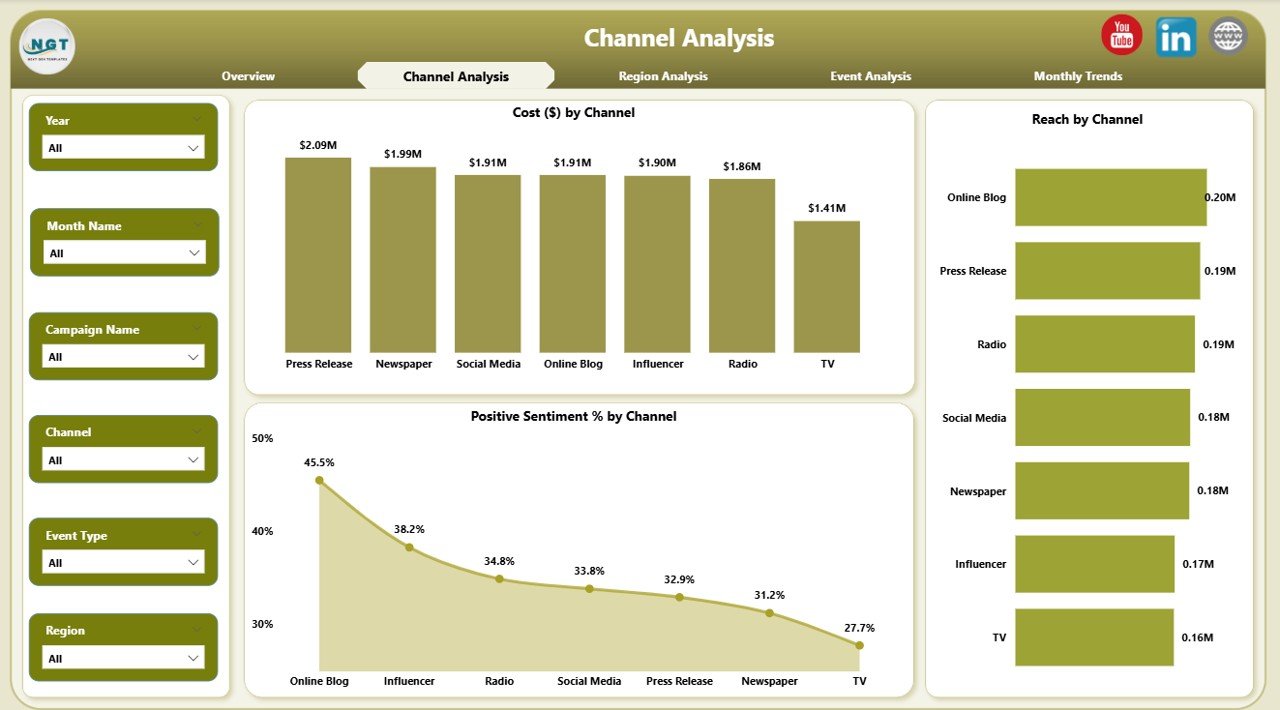
📺 2. Channel Analysis Page – Measure Communication Impact
Understand which media channels drive engagement and deliver the highest ROI.
Visuals Included:
-
Positive Sentiment % by Channel
-
Cost ($) by Channel
-
Reach by Channel
Gain clarity on audience response and platform performance so you can invest strategically in high-impact media.
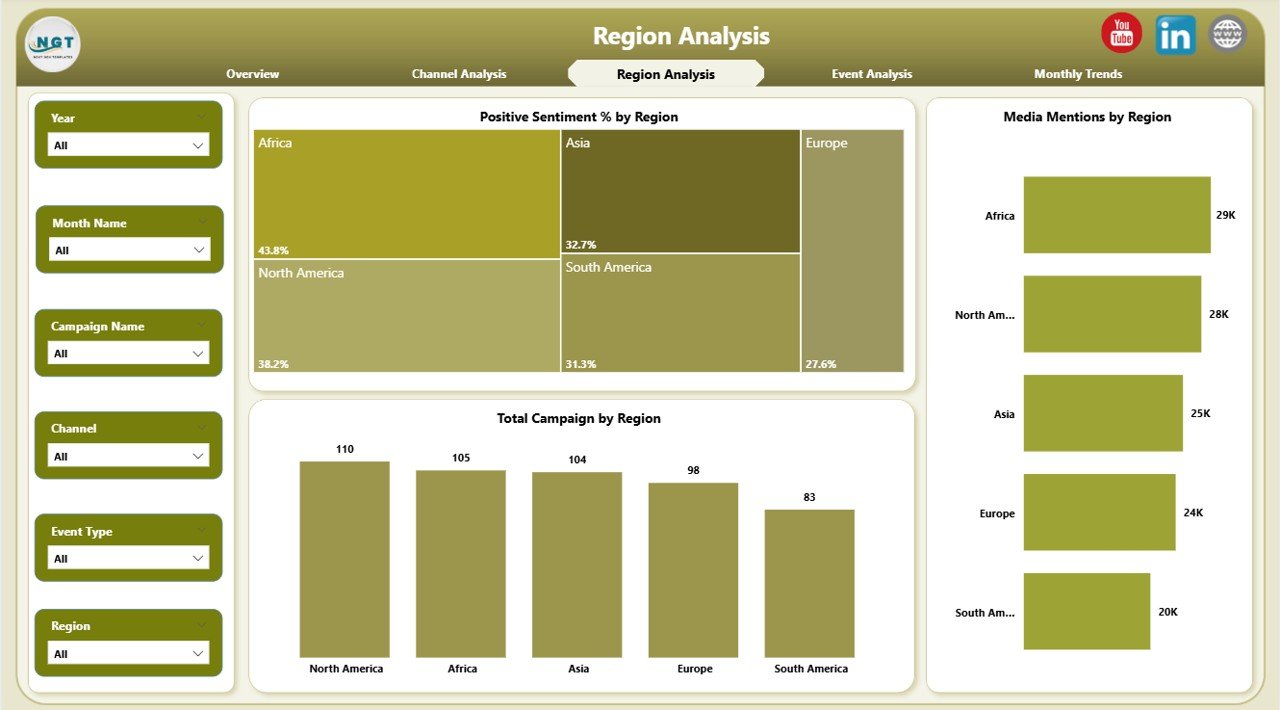
🌍 3. Region Analysis Page – Compare Global PR Performance
For national or international campaigns, regional insights are vital.
Charts Displayed:
-
Positive Sentiment % by Region
-
Media Mentions by Region
-
Cost ($) by Region
Easily pinpoint which regions need attention, optimize spend, and identify where your brand reputation is strongest.
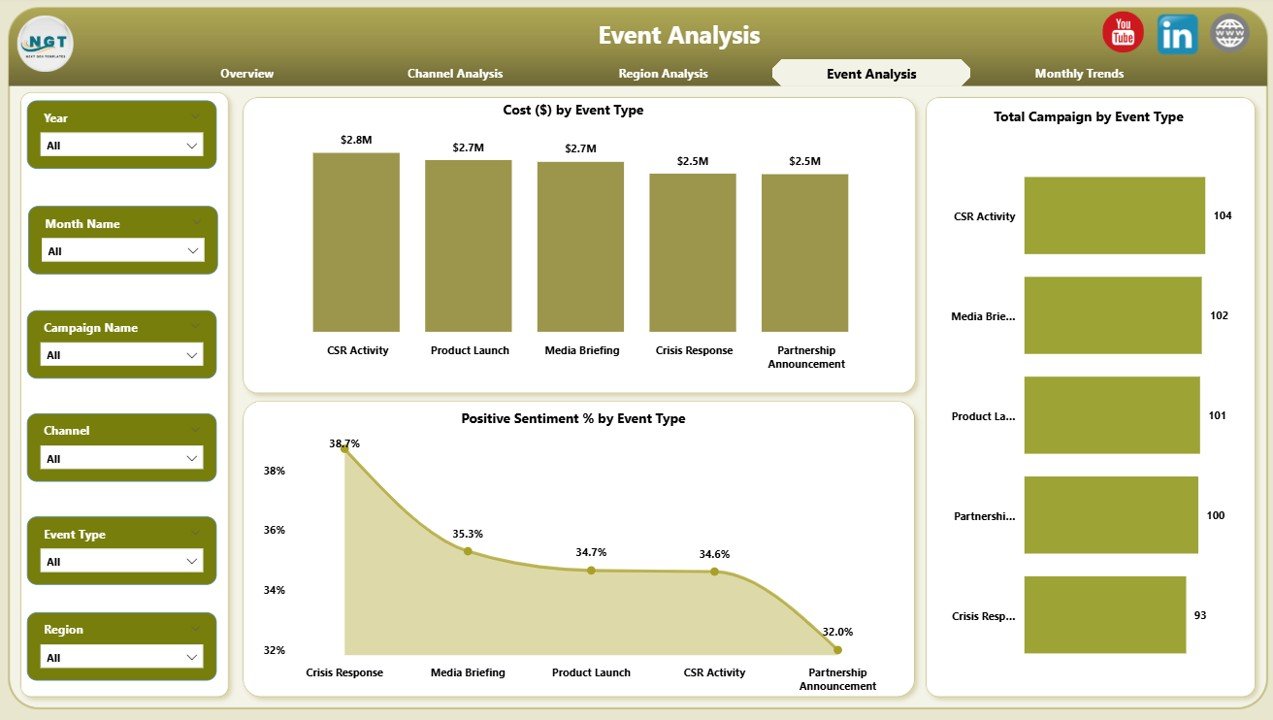
🎤 4. Event Analysis Page – Evaluate PR Event Success
Track how events — from product launches to conferences — influence audience sentiment.
Key Visuals:
-
Cost ($) by Event Type
-
Positive Sentiment % by Event Type
-
Total Campaigns by Event Type
Know which event categories deliver maximum engagement and justify the highest ROI.
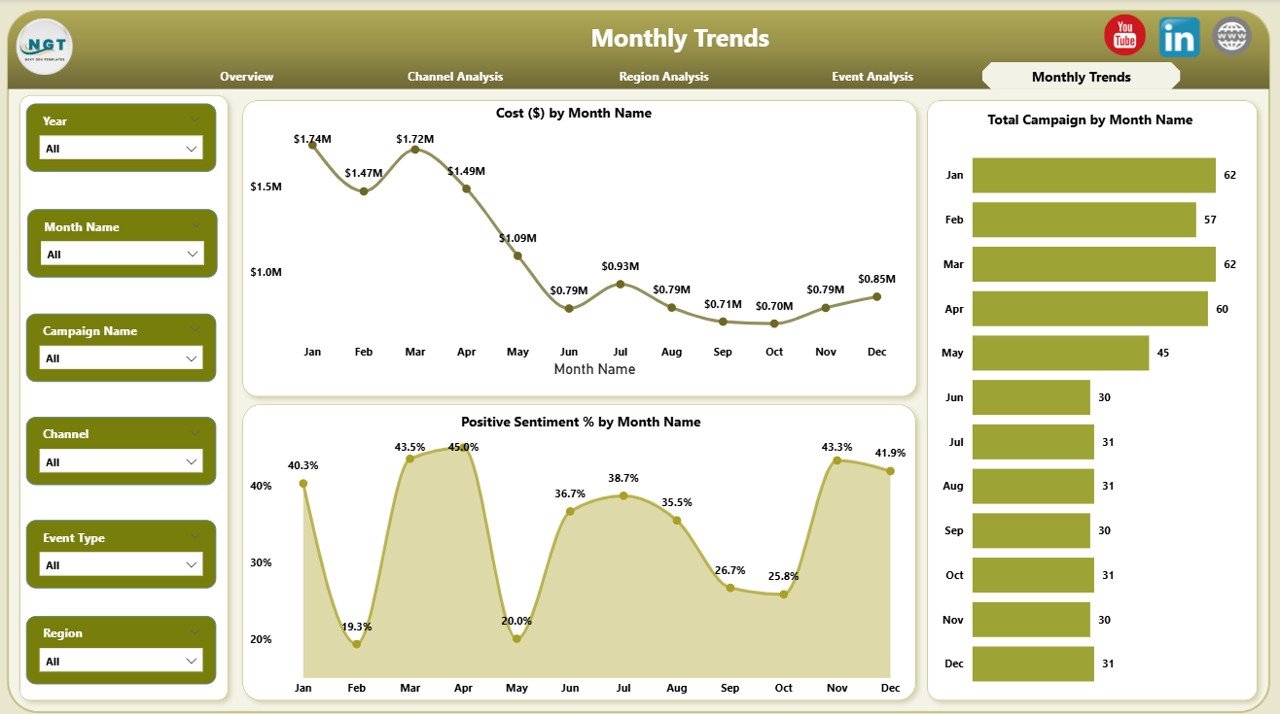
📅 5. Monthly Trends Page – Monitor Performance Over Time
Visualize PR activity across months to identify patterns and forecast performance.
Charts:
-
Cost ($) by Month
-
Positive Sentiment % by Month
-
Total Campaigns by Month
Track seasonality, spot declining sentiment early, and plan future campaigns proactively.
🚀 Why Use a PR Dashboard in Power BI?
✅ Real-Time Insights: Automated refresh keeps metrics current.
✅ Unified Data Source: Integrate Excel, social media, and media tracking tools.
✅ Customizable Design: Adjust visuals and KPIs to match your brand.
✅ Collaborative Access: Share reports securely via Power BI Service.
✅ Cost-Effective Analytics: Enterprise-level reporting without premium software.
✅ Data-Driven Decisions: Spot negative trends and optimize resources instantly.
💼 Who Can Benefit from This Dashboard
📰 PR Agencies – Track client campaign performance and sentiment.
🏢 Corporate Communications Teams – Manage brand reputation and media relations.
📣 Marketing Departments – Align PR data with overall campaign KPIs.
🌐 Global Enterprises – Compare regional PR efforts at scale.
🎯 Event Managers – Analyze event ROI and engagement impact.
🧩 Best Practices for Effective PR Analytics
✅ Keep your design clean and branded.
✅ Add clear titles for every chart and card.
✅ Use meaningful slicers only (e.g., Region, Channel).
✅ Schedule automatic data refresh in Power BI Service.
✅ Focus on actionable KPIs like Sentiment %, Cost Efficiency, and Media Reach.
✅ Apply conditional formatting for up/down performance arrows.
✅ Enable drill-through options for detailed exploration.
🔗 Click here to read the Detailed blog post
📺 Visit our YouTube channel for step-by-step tutorials
👉 YouTube.com/@PKAnExcelExpert


Reviews
There are no reviews yet.