In the high-speed world of global logistics, every decision counts. Whether you manage fleets, ports, routes, or delivery networks, staying ahead requires real-time insights and accurate performance tracking. The Shipping & Cargo KPI Dashboard in Excel ⚓📊 is a powerful, ready-to-use template designed to simplify logistics performance analysis — helping businesses cut costs, improve efficiency, and enhance customer satisfaction.
Built entirely in Excel, this dynamic dashboard consolidates your key performance indicators (KPIs) into a single, visual system. It helps logistics professionals, freight forwarders, and cargo operators monitor fleet utilization, on-time delivery rates, and fuel costs — all in one place. With automated formulas, drop-down selections, and clear visuals, it transforms raw shipping data into actionable intelligence.
⚡ Key Features of Shipping & Cargo KPI Dashboard in Excel
✅ Interactive Dashboard: Track all key logistics KPIs with MTD (Month-to-Date), YTD (Year-to-Date), and PY (Previous Year) comparisons.
✅ Automated Calculations: Instantly view Target vs Actual and PY vs Actual performance using conditional formatting arrows 🟢🔴.
✅ Smart Month Selector: Choose any month from a dropdown (cell D3) to automatically refresh visuals and metrics.
✅ KPI Trend Analysis: Monitor historical trends for each KPI through dynamic charts.
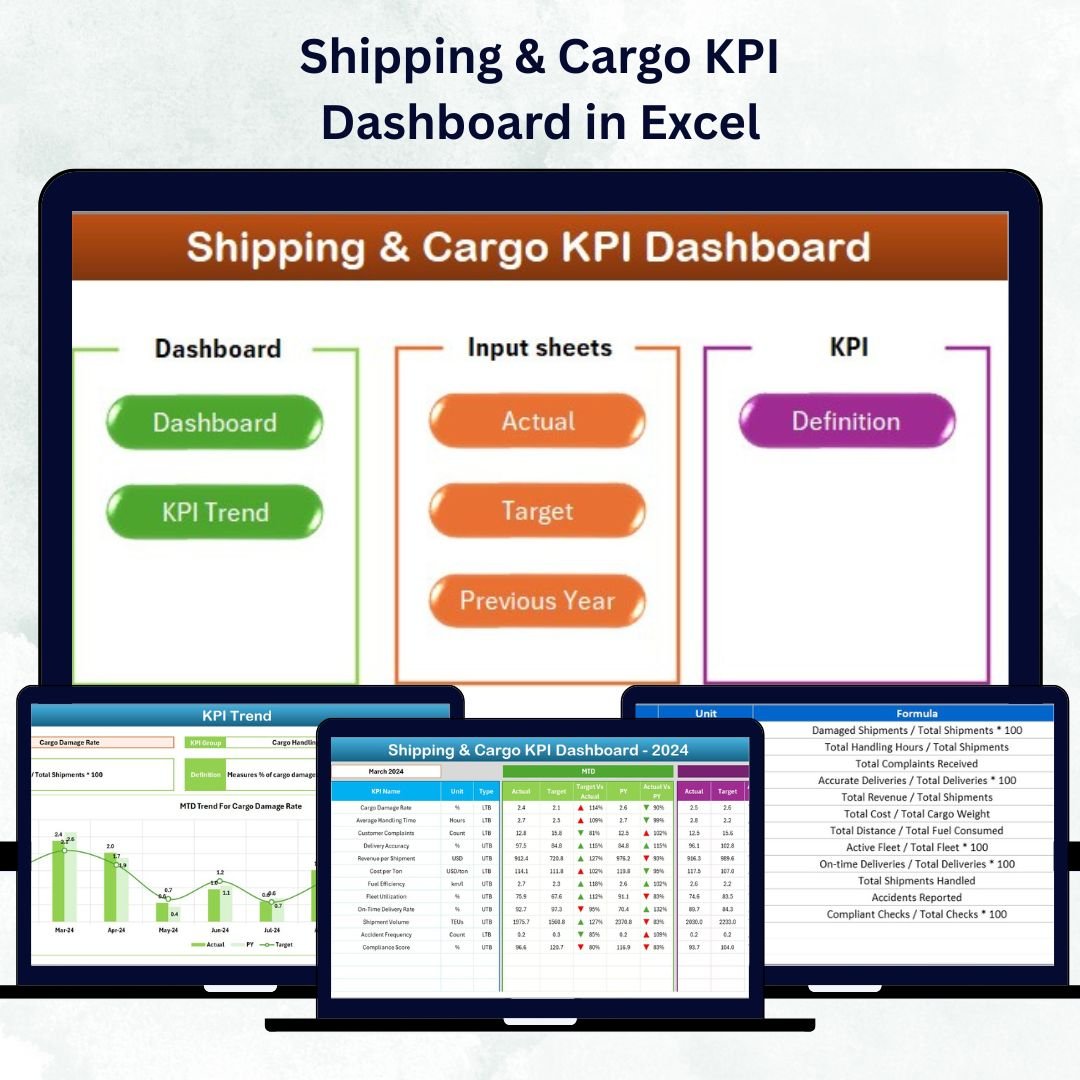
✅ Seven Connected Sheets: Includes Home, Dashboard, KPI Trend, Actual Numbers, Target, Previous Year, and KPI Definition.
✅ Zero Coding Required: 100% formula-driven; no macros or Power BI knowledge needed.
✅ Fully Customizable: Add, edit, or delete KPIs based on your company’s needs.
✅ Professional Visualization: Uses clean charts, ratios, and color-coded icons for fast decision-making.
✅ Team Alignment: Keeps operations, finance, and management teams on the same page.
This Excel dashboard transforms your shipping data into a visual story — allowing you to manage costs, track performance, and make data-driven logistics decisions effortlessly.
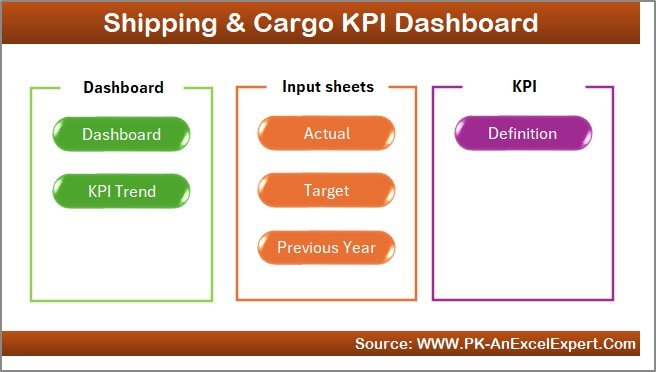
🧩 What’s Inside the Shipping & Cargo KPI Dashboard in Excel
The template includes seven well-structured worksheets, each with a specific purpose:
1️⃣ Home Sheet:
A user-friendly control panel with navigation buttons that let you jump between sheets instantly. It’s the perfect start page for beginners and managers alike.
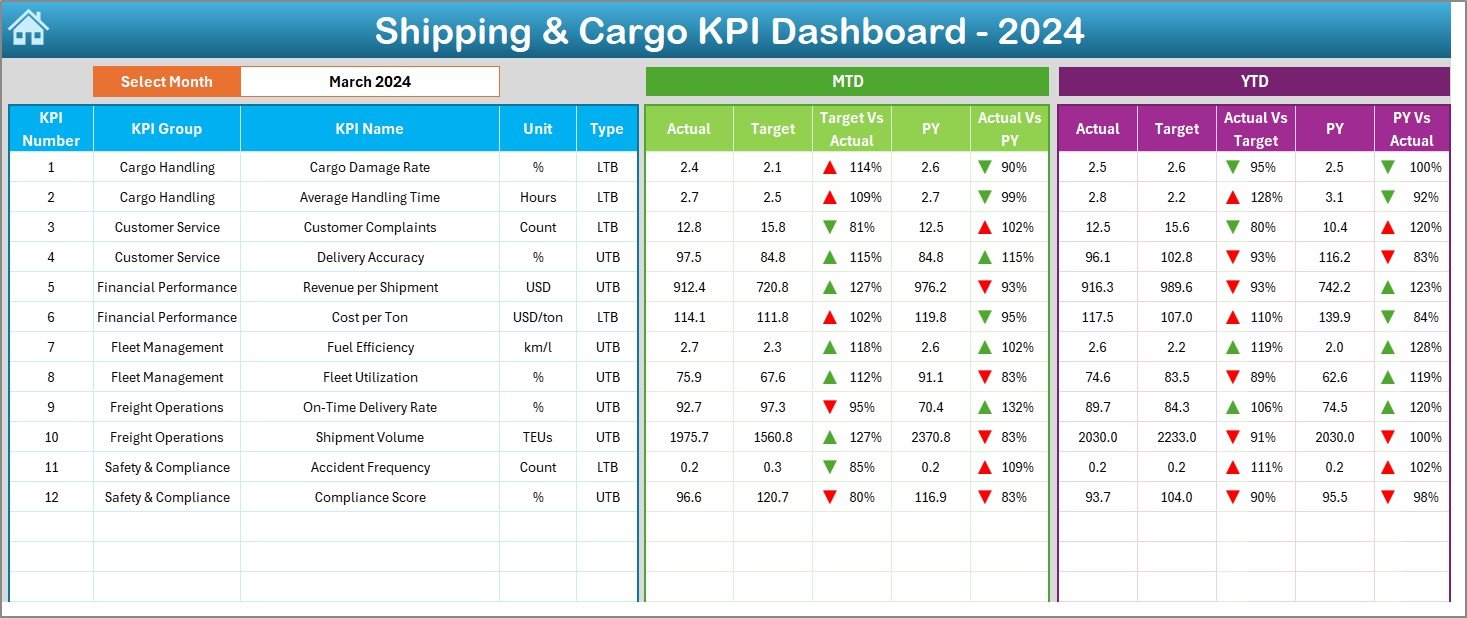
2️⃣ Dashboard Sheet:
Your main performance cockpit — featuring KPI cards, comparison ratios, and arrows to display whether metrics are above or below target.
-
Displays Actual, Target, and PY numbers for both MTD and YTD.
-
Calculates Target vs Actual (%) and PY vs Actual (%) automatically.
-
Uses conditional formatting icons (▲▼) for quick insight.
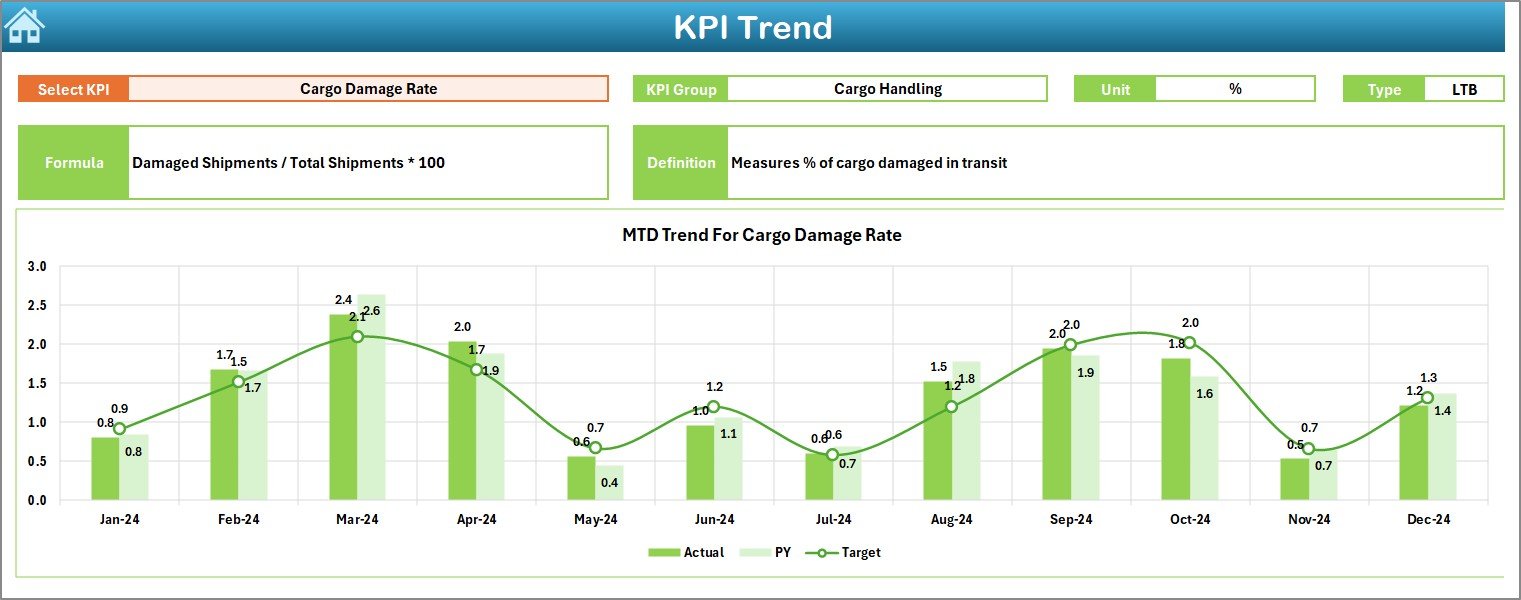
3️⃣ KPI Trend Sheet:
Analyze how each KPI evolves over time. Select any KPI (cell C3) to see detailed MTD and YTD trends in interactive line charts.
Includes KPI details like Group, Unit, Type (UTB/LTB), Formula, and Definition for reference.
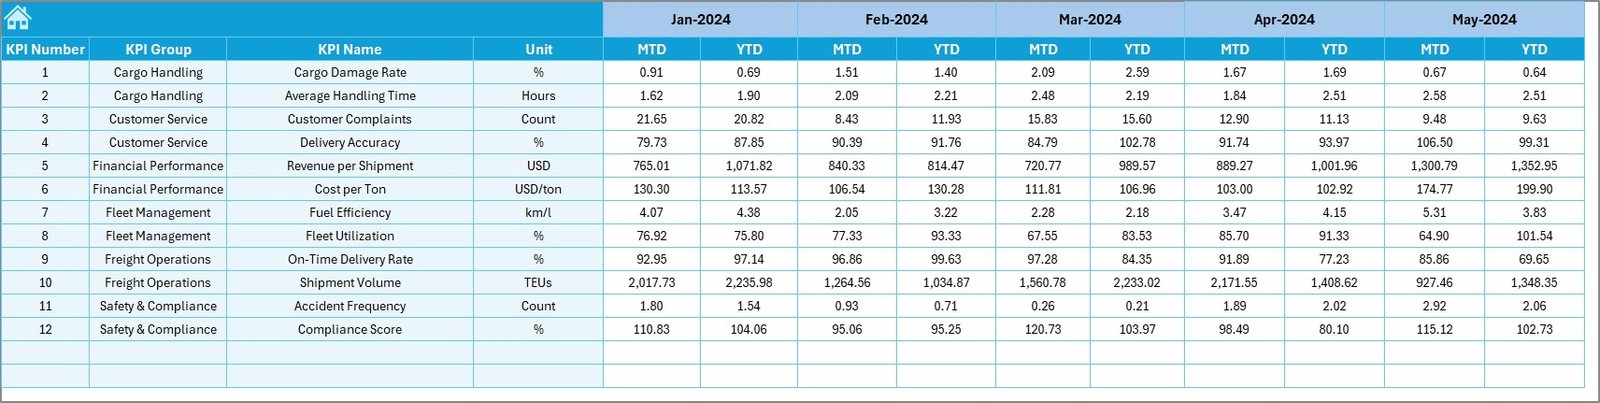
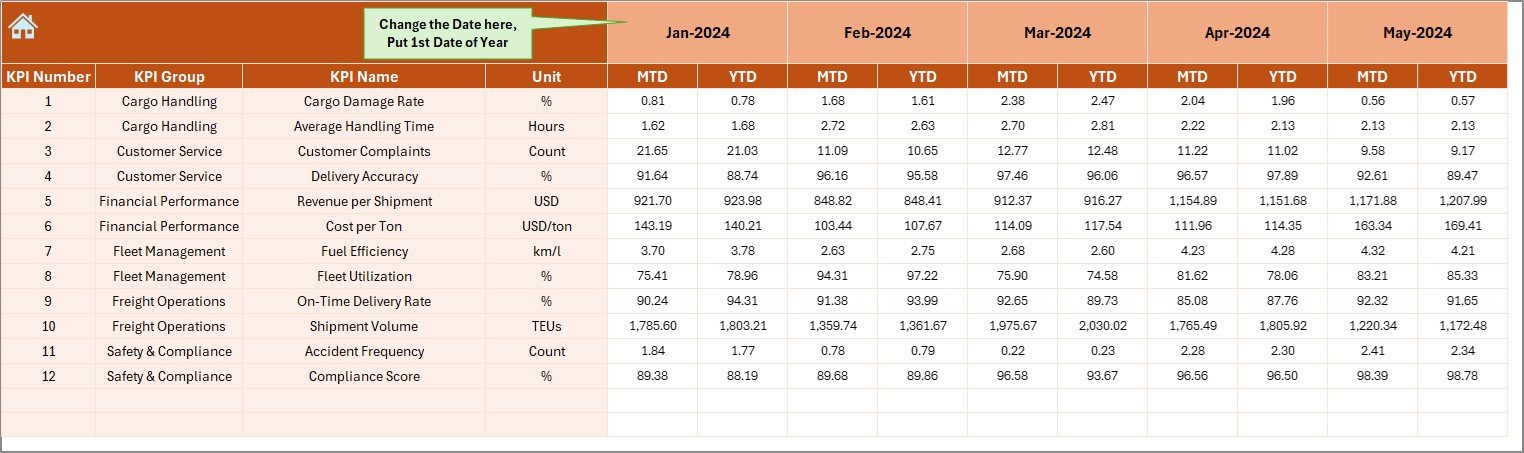
4️⃣ Actual Numbers Input Sheet:
Enter real monthly data for each KPI.
-
Change the start month of the fiscal year using the dropdown in E1.
-
The dashboard updates automatically with each new entry.
5️⃣ Target Sheet:
Define your monthly and yearly targets for every KPI.
This helps align strategic goals and compare actual performance against defined benchmarks.
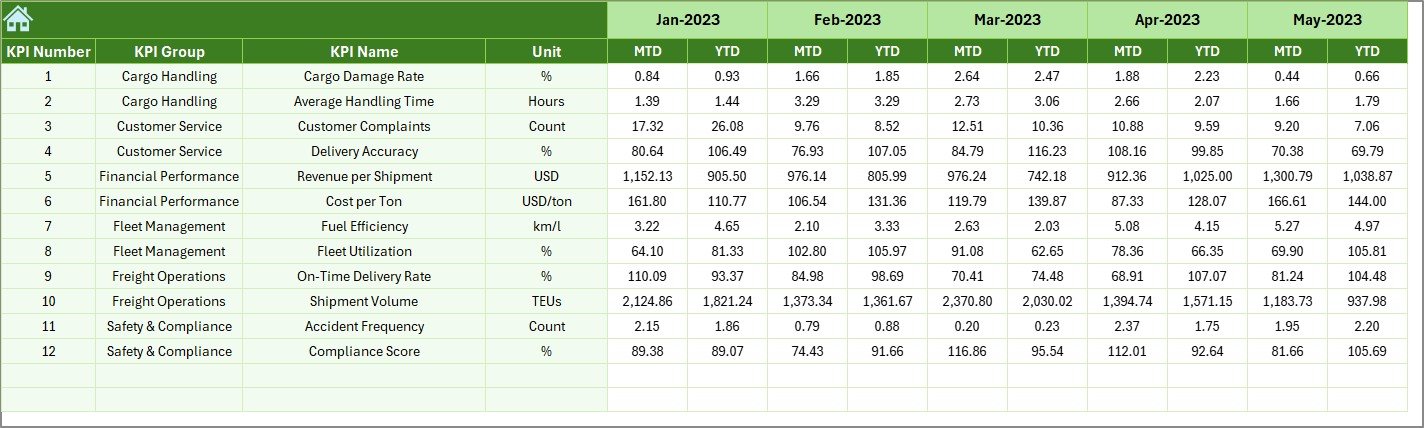
6️⃣ Previous Year Sheet:
Store historical results here to enable year-over-year (YoY) comparisons and improvement tracking.
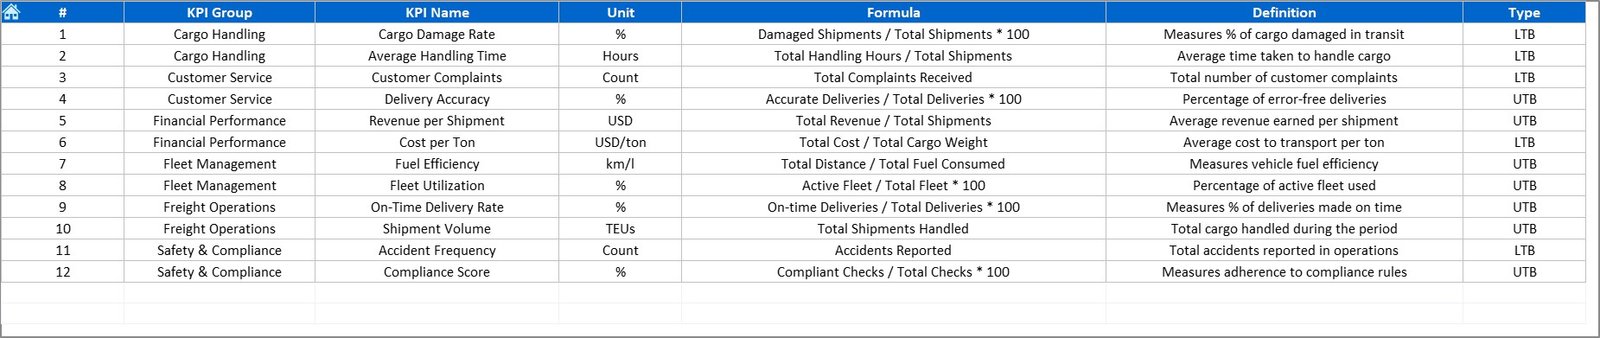
7️⃣ KPI Definition Sheet:
Your organization’s KPI dictionary — containing KPI Names, Groups, Units, Formulas, and Definitions for standardization and clarity.
🧠 How to Use the Shipping & Cargo KPI Dashboard in Excel
🚢 Step 1: Input current performance data in the Actual Numbers Sheet.
🎯 Step 2: Enter targets in the Target Sheet and PY data in the Previous Year Sheet.
📊 Step 3: Go to the Dashboard Sheet and select a month from the dropdown.
📈 Step 4: Explore trend charts in the KPI Trend Sheet to identify long-term patterns.
📘 Step 5: Refer to the KPI Definition Sheet for consistent KPI understanding.
Within minutes, you’ll have a live, automated logistics dashboard ready for analysis and reporting.
👥 Who Can Benefit from This Shipping & Cargo KPI Dashboard
🚛 Logistics Managers: Monitor fleet efficiency, route performance, and cost per delivery.
⚓ Operations Teams: Track on-time shipments, fuel usage, and cargo accuracy.
💼 Finance Departments: Evaluate cost structures, budget variances, and profitability.
📦 Supply Chain Leaders: Identify areas to optimize delivery timelines and reduce expenses.
🧭 Executives: Get a high-level view of performance across all logistics operations.
This dashboard provides actionable insights that empower decision-makers to optimize every aspect of shipping and cargo management.
🔗 Click here to read the Detailed Blog Post
🎥 Visit our YouTube channel to learn step-by-step video tutorials
👉 YouTube.com/@PKAnExcelExpert


Reviews
There are no reviews yet.