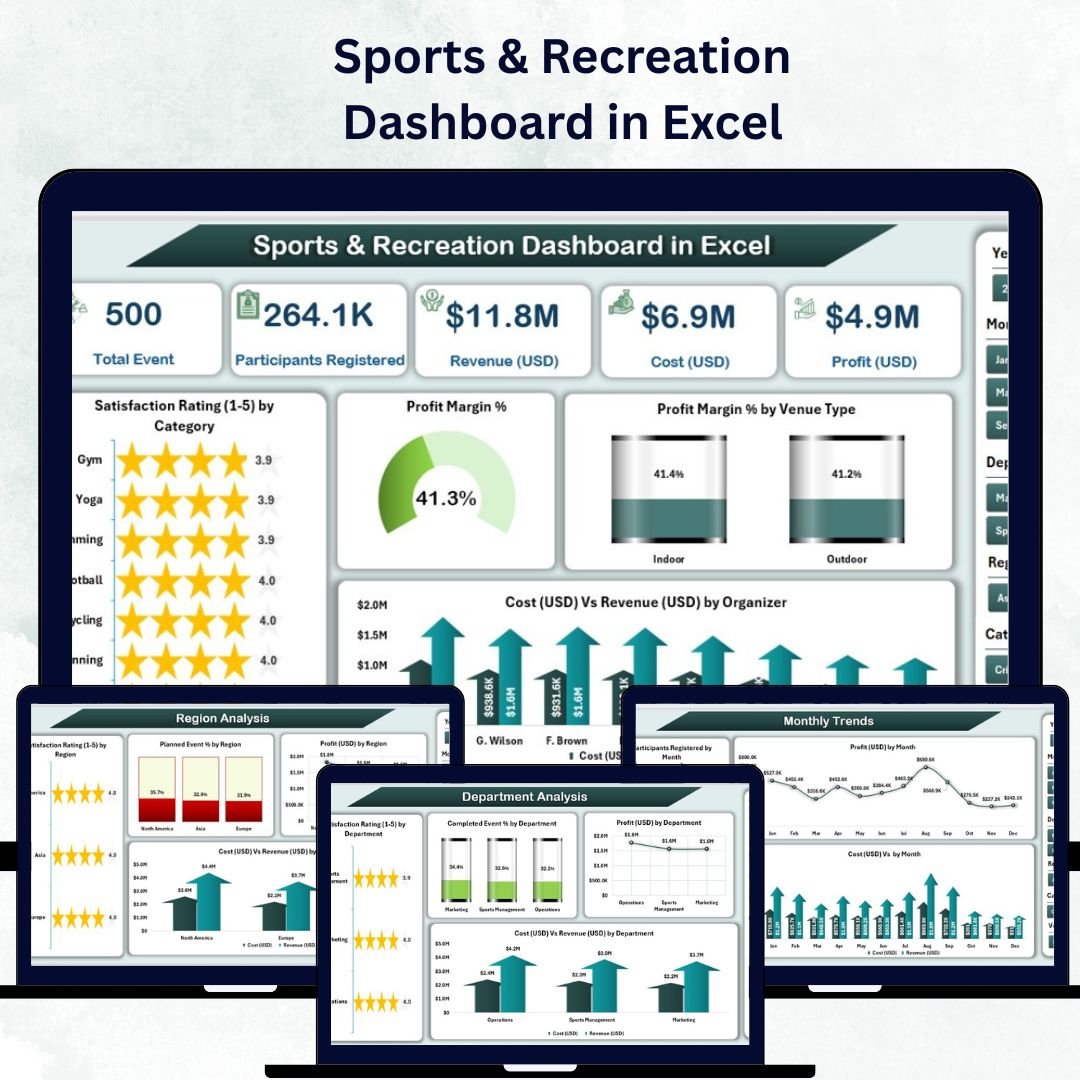
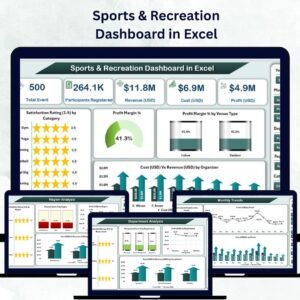
Managing sports and recreation operations becomes simple and efficient with the Sports & Recreation Dashboard in Excel — a ready-to-use, interactive tool designed to help you analyze performance, track participation, and measure profitability effortlessly.
Built entirely in Microsoft Excel, this dashboard consolidates data from multiple sources into one visual and intuitive interface. From event profitability to satisfaction ratings, it enables managers, coordinators, and administrators to make smarter, data-backed decisions in real time.
⚙️ Key Features of the Sports & Recreation Dashboard in Excel
The dashboard includes five powerful analytical pages and support sheets, offering a complete picture of sports and recreation management.
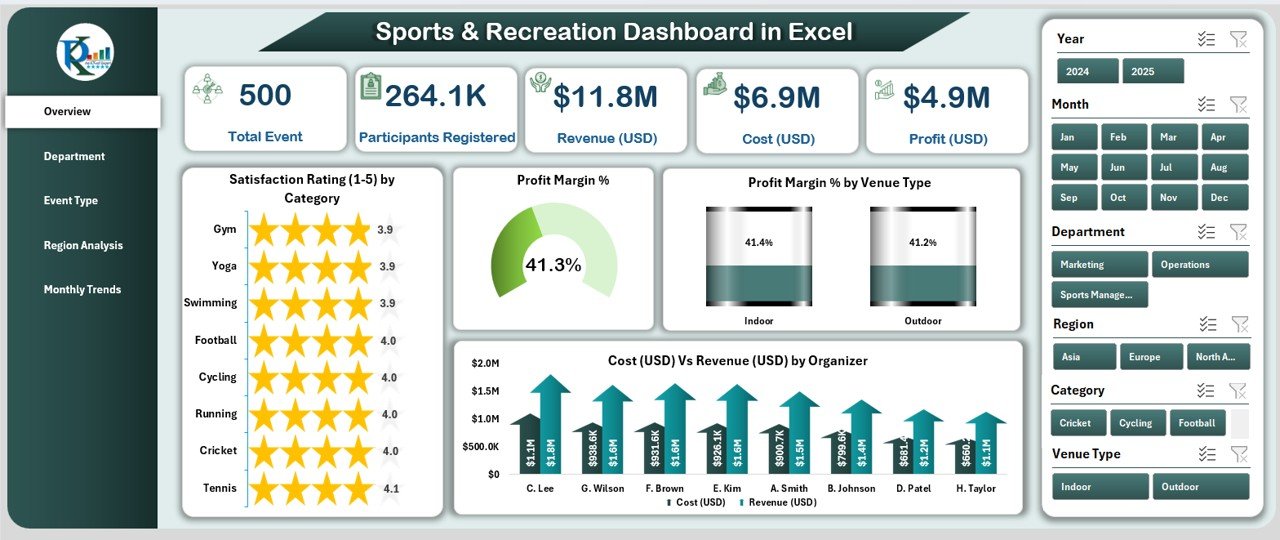
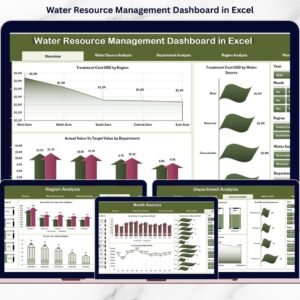
🧭 1️⃣ Overview Page – Your Performance Command Center
This is the main page of the dashboard where all key insights come together.
Highlights:
-
Navigation Panel: Quickly move between different analytical pages.
-
Slicers: Filter by department, category, or time period.
-
Five KPI Cards:
-
Total Events Conducted
-
Average Profit Margin %
-
Total Participants Registered
-
Average Satisfaction Rating (1–5)
-
Total Revenue (USD)
-
-
Visual Charts:
-
Satisfaction Rating (1–5) by Category
-
Profit Margin %
-
Profit Margin % by Venue Type
-
Cost (USD) vs Revenue (USD) by Department
-
This page acts as your strategic snapshot, allowing managers to assess performance instantly.
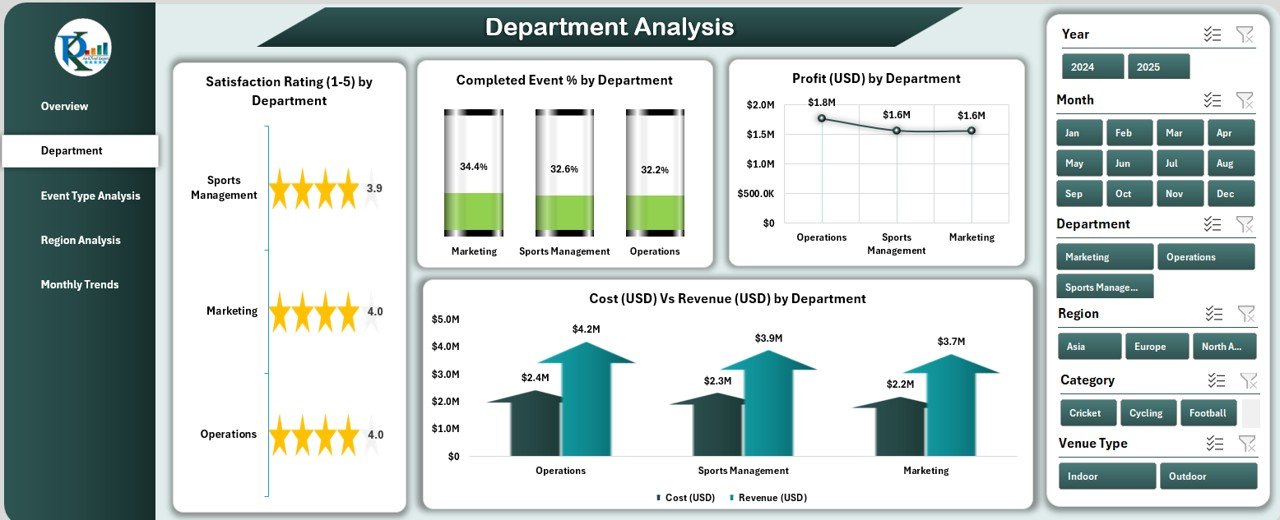
🏢 2️⃣ Department Analysis – Measure Departmental Impact
Evaluate departmental efficiency and financial contribution with four in-depth charts:
-
Satisfaction Rating (1–5) by Department
-
Completed Event % by Department
-
Profit (USD) by Department
-
Cost (USD) vs Revenue (USD) by Department
Department heads can use this data to monitor productivity, identify high-performing teams, and allocate resources effectively.
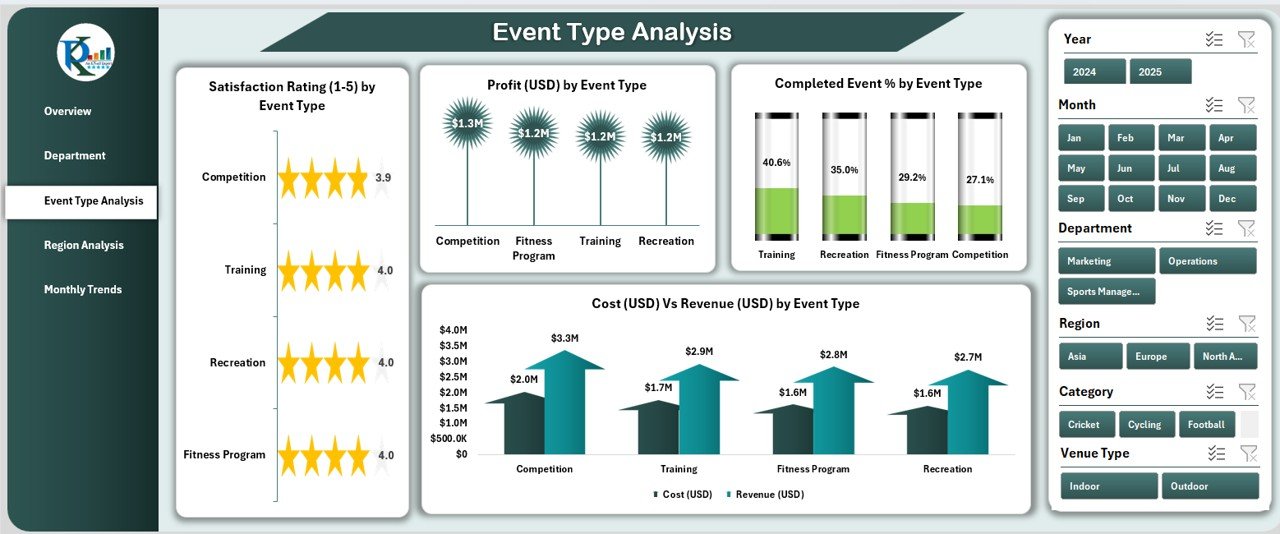
🏅 3️⃣ Event Type Analysis – Discover What Drives Success
This page helps compare performance across different event types such as tournaments, training programs, and community events.
Key Insights:
-
Satisfaction Rating (1–5) by Event Type
-
Completed Event % by Event Type
-
Profit (USD) by Event Type
-
Cost (USD) vs Revenue (USD) by Event Type
Use this analysis to determine which events yield the highest ROI and participant satisfaction.
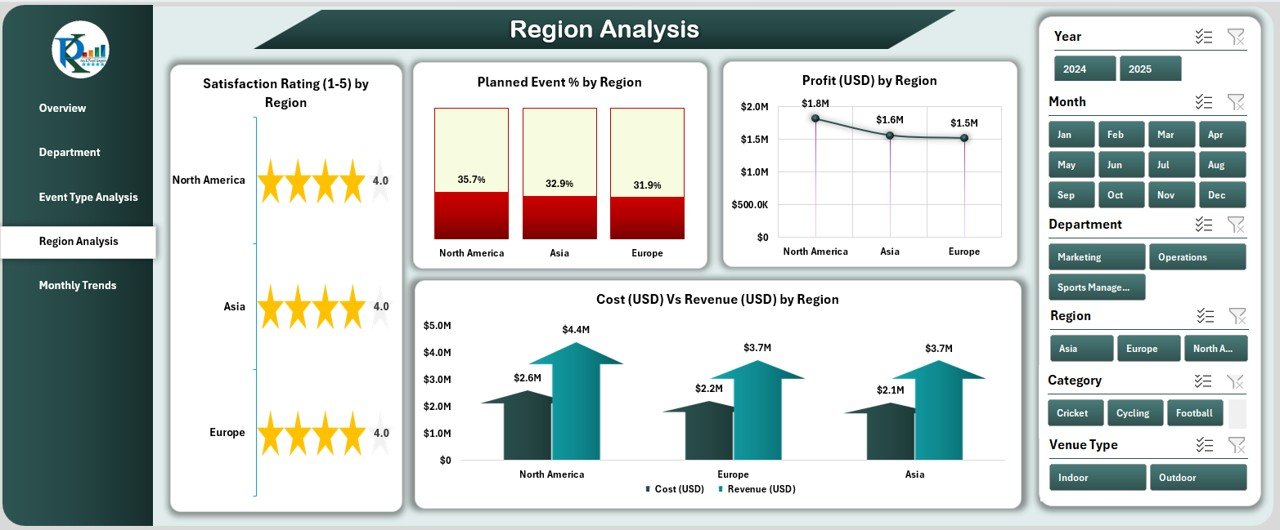
🌍 4️⃣ Region Analysis – Track Geographic Performance
Perfect for organizations operating in multiple regions.
Charts Include:
-
Satisfaction Rating (1–5) by Region
-
Planned Event % by Region
-
Profit (USD) by Region
-
Cost (USD) vs Revenue (USD) by Region
These visuals help identify regional opportunities, guide marketing campaigns, and improve operational efficiency.
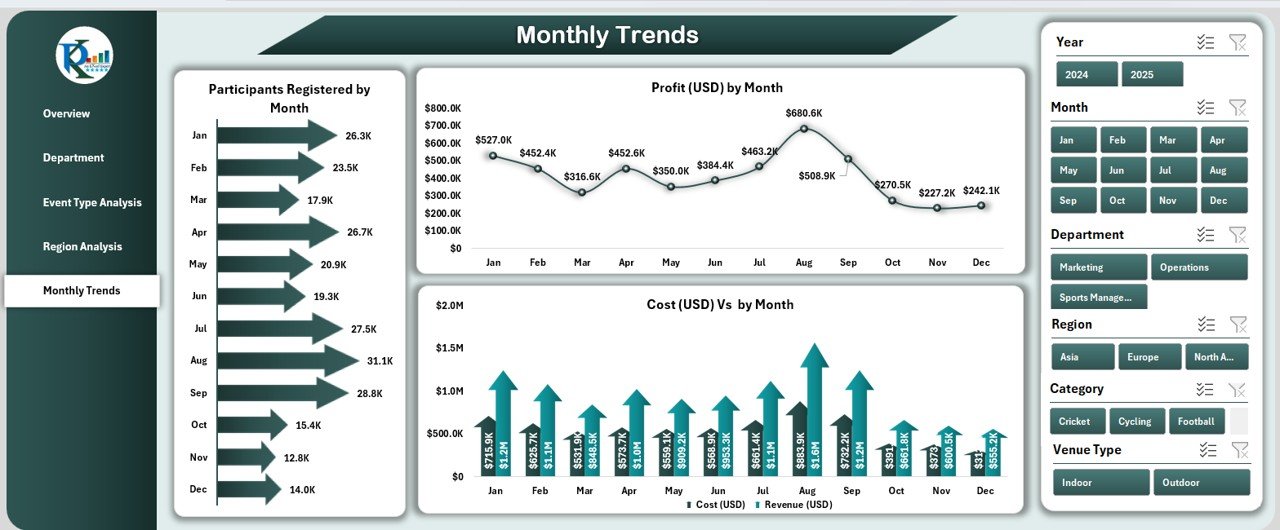
📆 5️⃣ Monthly Trends – Monitor Growth Over Time
Spot patterns and forecast future performance with trend charts:
-
Profit (USD) by Month
-
Participants Registered by Month
-
Cost (USD) vs Revenue (USD) by Month
This time-based analysis enables organizations to make strategic adjustments month by month.
📊 What’s Inside the Sports & Recreation Dashboard
Along with the five analytical pages, the file includes:
✅ Data Sheet: Contains all raw data such as costs, revenues, departments, and satisfaction ratings.
✅ Support Sheet: Stores dropdown lists and slicer sources for data consistency.
Together, they make updating and maintaining the dashboard effortless — simply refresh the data, and all visuals will update automatically.
💡 How to Use the Sports & Recreation Dashboard
1️⃣ Input Data: Enter details for each event, including cost, revenue, and satisfaction score.
2️⃣ Refresh Dashboard: Update pivot tables or use the refresh button for instant insights.
3️⃣ Filter & Navigate: Use slicers to switch between months, departments, or event types.
4️⃣ Review KPIs: Analyze key metrics on the Overview Page.
5️⃣ Drill Deeper: Explore detailed pages for department, event type, and regional analysis.
Within minutes, you’ll have a full performance overview — perfect for management presentations or performance meetings.
🌟 Who Can Benefit from This Dashboard
🎯 Sports Clubs & Academies: Track participation, satisfaction, and profitability.
🏫 Educational Institutions: Monitor student engagement and event outcomes.
🏢 Corporate Event Teams: Measure wellness and recreation ROI.
🏙️ Municipal Organizations: Oversee regional events and public engagement.
🏋️♂️ Recreation Centers: Improve program design and resource allocation.
📈 Advantages of the Sports & Recreation Dashboard in Excel
✔️ Centralized View: Combine multiple datasets into one dashboard.
✔️ Time Efficiency: Reduce manual report creation through automation.
✔️ Real-Time Insights: Interactive slicers and KPIs show live updates.
✔️ Enhanced Clarity: Color-coded visuals make data interpretation simple.
✔️ Customizable: Add or modify KPIs, colors, and visuals easily.
✔️ Cost-Effective: No additional software required — Excel does it all.
🧠 Best Practices for Using the Dashboard
✅ Keep data entries consistent for event types, regions, and departments.
✅ Refresh pivot tables regularly for accurate reporting.
✅ Use slicers strategically to focus on specific metrics.
✅ Review performance monthly for trend insights.
✅ Export dashboard visuals to PDF for stakeholder sharing.
Following these steps ensures your dashboard remains accurate, dynamic, and insightful.
🏁 Conclusion
The Sports & Recreation Dashboard in Excel is more than a reporting tool — it’s a complete performance management system. By combining visual analytics with data automation, it empowers organizations to optimize events, enhance satisfaction, and drive profitability.
From local clubs to global recreation programs, this dashboard is the go-to Excel solution for transforming sports data into actionable intelligence.
🔗 Click here to read the Detailed Blog Post
🎥 Visit our YouTube channel for tutorials
🔗 YouTube.com/@PKAnExcelExpert


Reviews
There are no reviews yet.