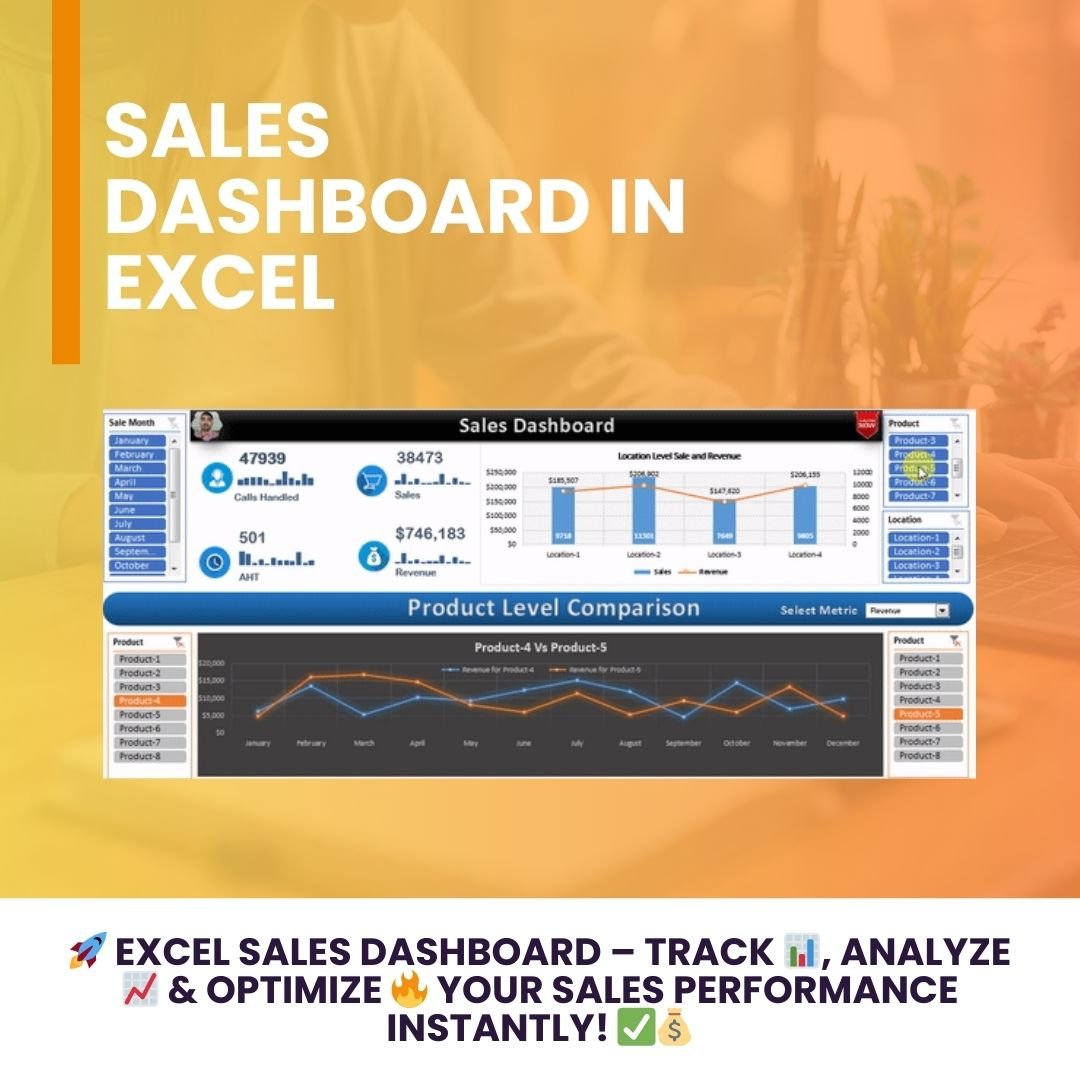
The Sales Dashboard in Excel is a powerful, dynamic tool designed to provide real-time insights into sales performance, customer engagement, and revenue trends. It is built with interactive elements that allow users to slice and filter data by product, location, and time period. With its user-friendly design and automated calculations, this dashboard helps businesses make data-driven decisions and optimize sales strategies.
Key Features
📊 Interactive Slicers
- Easily filter data based on month, product, or location to focus on specific metrics.
- Customize the dashboard view to gain insights into targeted sales trends.
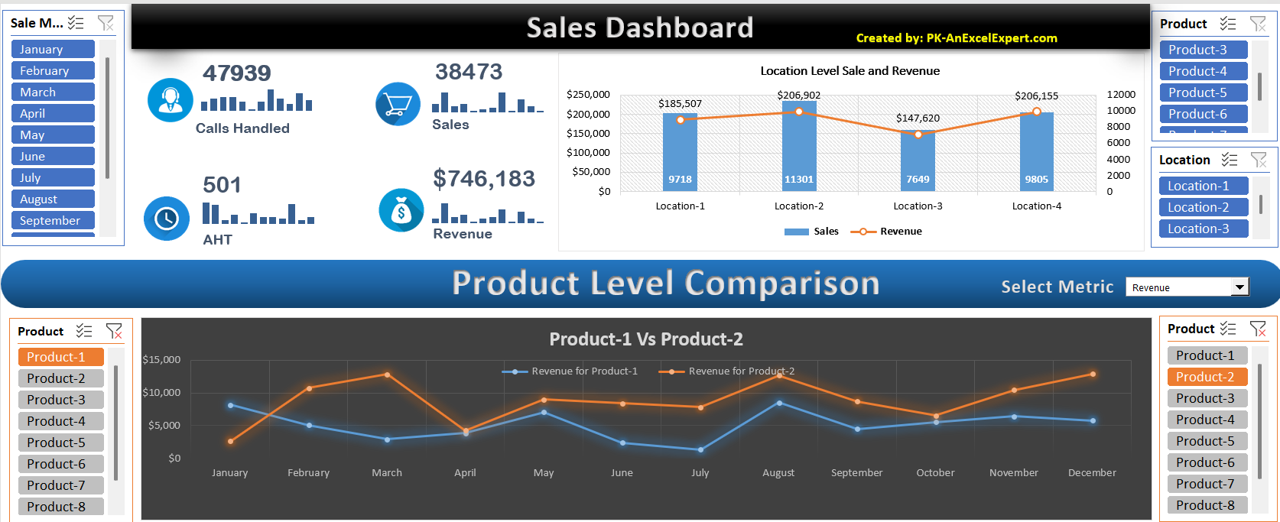
📈 Comprehensive Summary Metrics
- Displays key performance indicators (KPIs) such as:
- Calls Handled – Total number of calls made or received.
- Sales – Number of successful transactions.
- AHT (Average Handling Time) – Time spent on each call or transaction.
- Revenue – Total revenue generated.
- Spark-lines provide a quick snapshot of monthly trends for each metric.
📌 Location-wise Sales vs. Revenue Chart
- A combination of column and line charts to visualize sales performance across different locations.
- Helps identify which locations generate higher revenue and which need improvement.
📊 Product-Level Comparison
- Enables month-on-month comparisons between two selected products.
- Dynamic line chart displays fluctuations in revenue, allowing businesses to identify trends and optimize product performance.
📑 Support Sheet for Data Accuracy
- The dashboard is powered by a back-end support sheet that contains:
- Pivot tables
- Pre-configured calculations
- Automated data refresh
- Ensures that displayed information is accurate, up-to-date, and reliable.
🎨 User-Friendly & Visually Appealing
- Designed with small pictures, dynamic elements, and spark-lines to make it visually engaging.
- Interactive dropdowns & buttons enhance navigation and ease of use.
Why Use This Dashboard?
✅ Quick Insights – View performance metrics instantly.
✅ Customizable Analysis – Slice and dice data based on different factors.
✅ Better Decision-Making – Identify growth opportunities and optimize sales strategies.
✅ Automated & Error-Free – Say goodbye to manual data entry and human errors.
🚀 Maximize sales efficiency with this all-in-one Sales Dashboard in Excel!
Who Can Use This?
✔ Sales Teams – Track and analyze performance metrics.
✔ Business Owners – Monitor revenue and product-level sales.
✔ Marketing Analysts – Identify key trends and optimize campaigns.
✔ Finance Teams – Assess financial performance and revenue trends.
🔥 Download the Sales Dashboard now and take your business performance to the next level! 🔥
Click here to read the detailed blog post
Watch the step-by-step video tutorial:
Also check our Inventory Management Form in Excel


Reviews
There are no reviews yet.