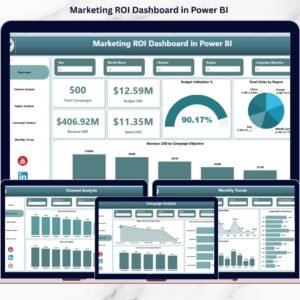
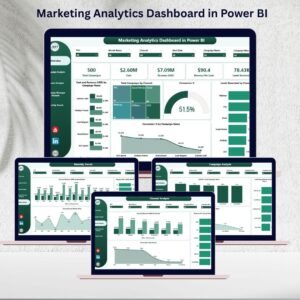
📈 In today’s digital economy, data-driven marketing is the key to success. Running campaigns without accurate insights often leads to wasted budgets, low ROI, and missed opportunities. That’s where the Marketing Analytics Dashboard in Power BI 🚀 comes in—your one-stop solution to monitor, analyze, and optimize marketing performance.
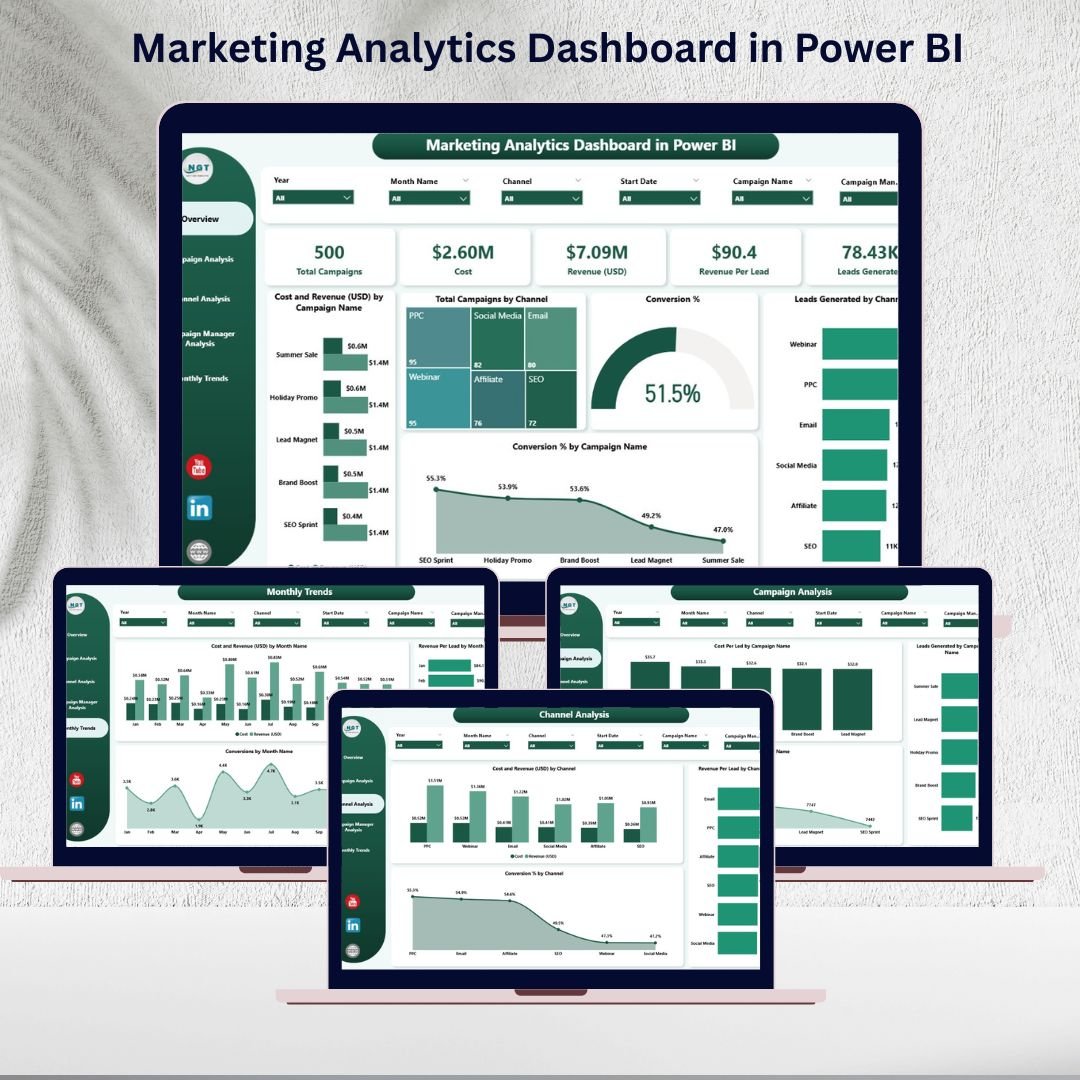
This ready-to-use dashboard transforms raw marketing data into clear, interactive visuals. With five dedicated analytical pages, it provides marketers, campaign managers, and business leaders with the tools they need to evaluate performance across campaigns, channels, and teams.
No more juggling spreadsheets or waiting for manual reports. With Power BI, you get real-time updates, automated visuals, and actionable insights—all in one centralized place.
🌟 Key Features of the Marketing Analytics Dashboard in Power BI
-
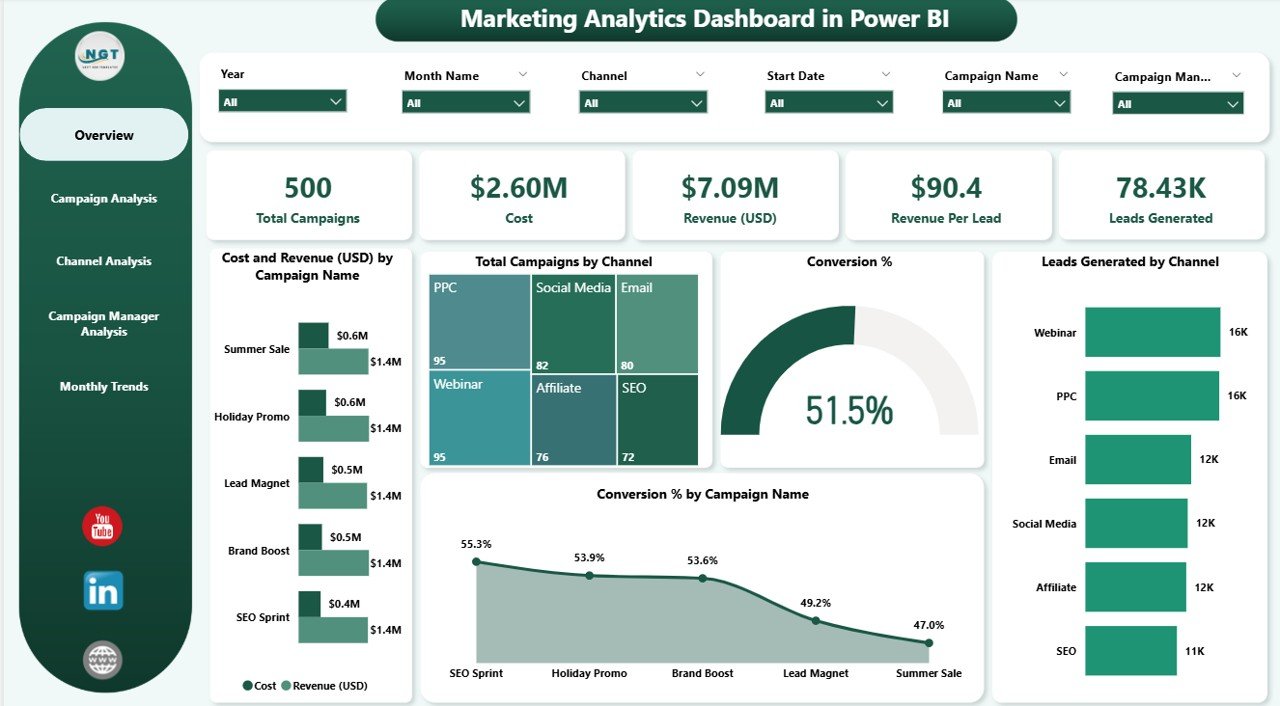
📊 Overview Page: A high-level summary with slicers for time, campaign, and channel. Includes KPI cards, cost vs revenue charts, total campaigns by channel, conversion %, and leads generated.
-
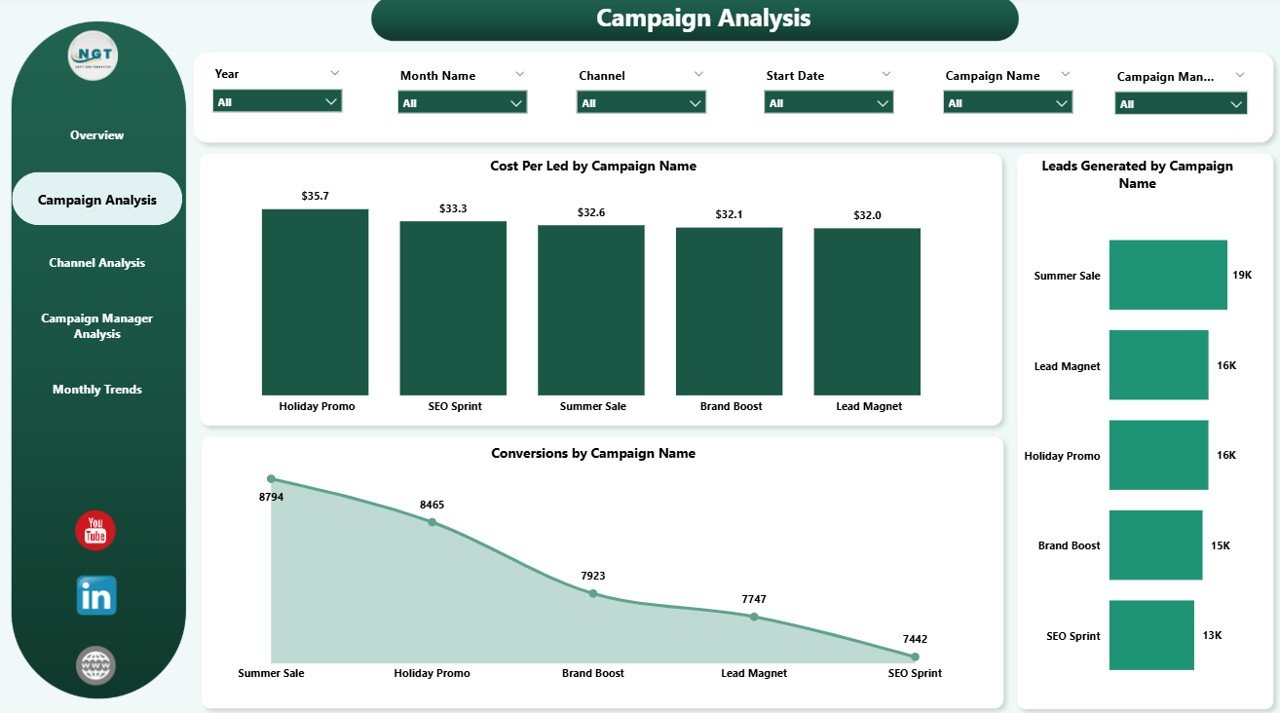
🎯 Campaign Analysis Page: Drill down into individual campaign performance. Track cost per lead, conversion rates, and leads generated for each campaign.
-
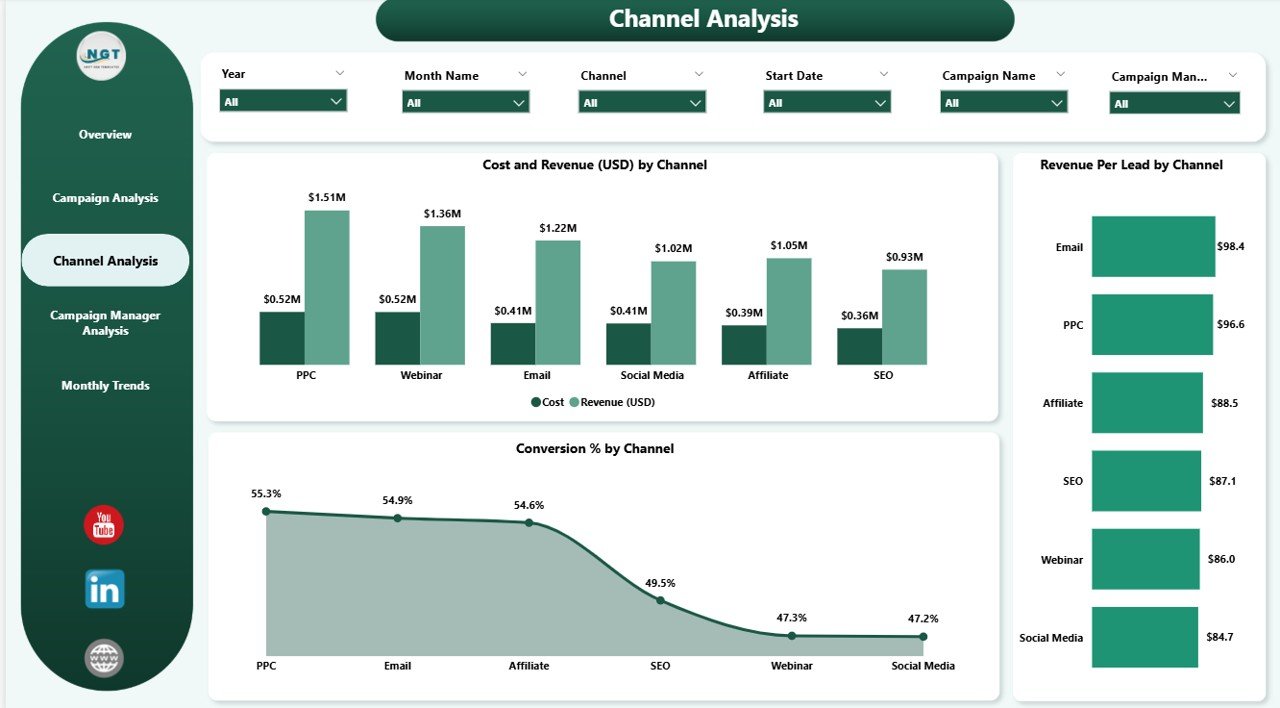
📢 Channel Analysis Page: Compare social media, email, paid ads, and events. See ROI, cost vs revenue, and revenue per lead by channel to optimize budget allocation.
-
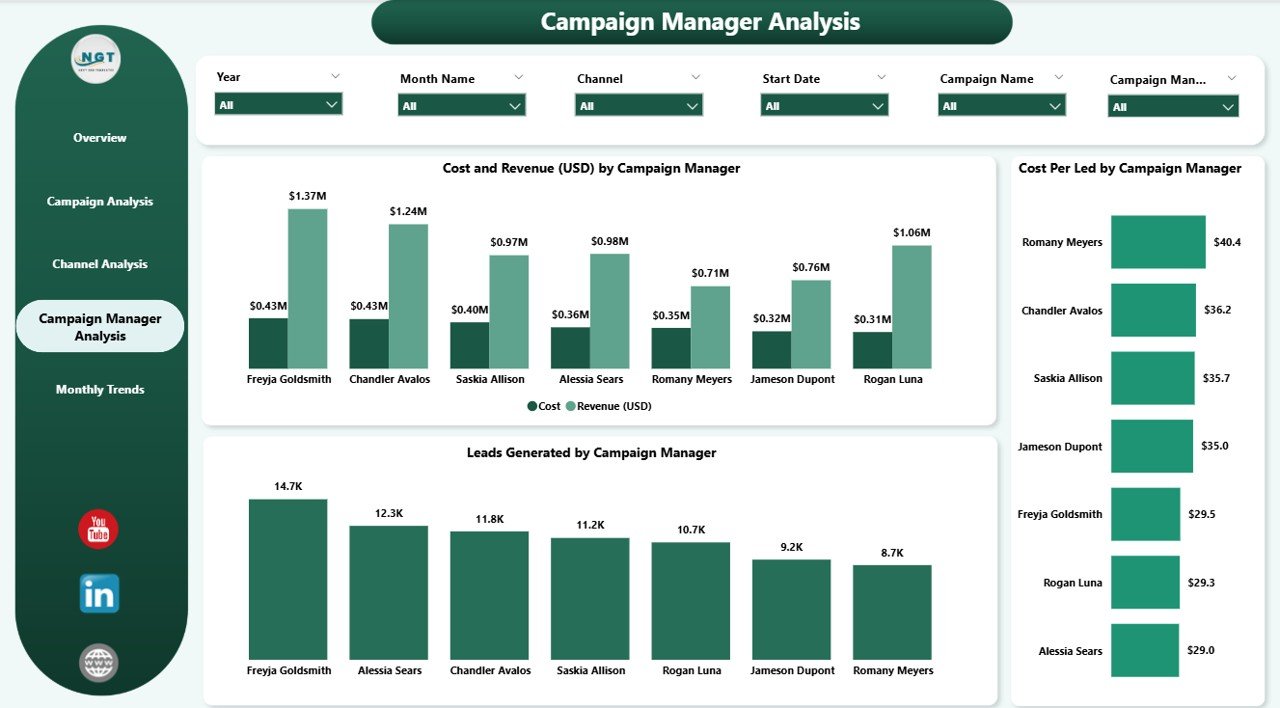
👨💼 Campaign Manager Analysis Page: Evaluate team and manager contributions. Monitor cost, revenue, leads, and cost per lead by campaign manager to boost accountability.
-
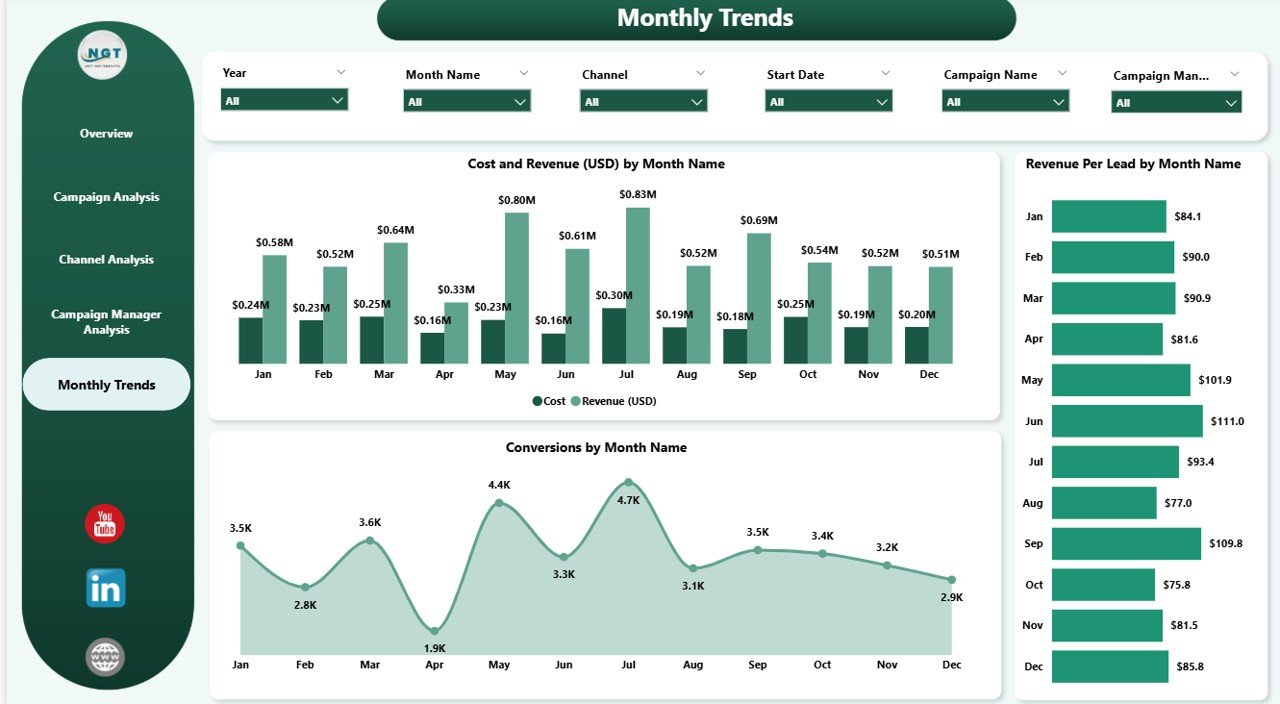
📅 Monthly Trends Page: Identify seasonal performance patterns. Visualize cost vs revenue, conversion %, and revenue per lead by month for better forecasting.
📦 What’s Inside the Dashboard
When you download the Marketing Analytics Dashboard in Power BI, you get:
-
✅ A pre-designed, fully interactive Power BI dashboard file (.pbix).
-
✅ Five analytical pages (Overview, Campaign, Channel, Manager, Monthly Trends).
-
✅ Built-in slicers, filters, and drill-downs for flexible reporting.
-
✅ Ready-to-use KPI visuals (conversion %, cost per lead, revenue per lead, ROI metrics).
-
✅ Seamless integration with Excel, CRM systems, and ad platforms.
-
✅ A structured layout designed for clarity, accountability, and quick decision-making.
🛠 How to Use the Marketing Analytics Dashboard
-
Connect Data Sources – Import Excel sheets, CRM exports, or connect Power BI directly to Google Analytics, Facebook Ads, or HubSpot.
-
Update Regularly – Refresh the dashboard daily or weekly to keep KPIs accurate.
-
Explore Pages – Navigate between Overview, Campaign, Channel, Manager, and Trends for different perspectives.
-
Apply Filters – Use slicers to view results by time period, campaign type, or channel.
-
Drill Through Insights – Compare campaigns or channels side by side.
-
Share with Stakeholders – Publish reports to Power BI Service or export to PDF/PowerPoint for meetings.
💡 No coding or technical expertise is needed—Power BI handles the heavy lifting!
👥 Who Can Benefit from This Dashboard?
The Marketing Analytics Dashboard in Power BI is perfect for:
-
📊 Marketing Teams: Track campaign effectiveness and ROI.
-
👨💼 Campaign Managers: Evaluate individual and team contributions.
-
💻 Digital Agencies: Present professional reports to clients with clean visuals.
-
🏢 Business Leaders: Make budget and strategy decisions based on evidence, not guesswork.
-
📈 Startups & Enterprises: Scales easily, whether you’re running 5 campaigns or 500.
If you’re serious about maximizing ROI and optimizing strategies, this dashboard is your go-to performance management tool.


Reviews
There are no reviews yet.