
In today’s fast-changing world, business disruptions are inevitable. From cyberattacks and natural disasters to supply chain delays and power outages, every incident has the potential to damage productivity, revenue, and reputation. The question is — how quickly can your organization respond, recover, and keep operations running?
That’s where the Business Continuity Dashboard in Excel comes in. This ready-to-use tool transforms raw continuity data into clear KPIs, interactive charts, and trend insights — giving leaders the visibility they need to make faster, smarter decisions during and after disruptions.
Instead of managing scattered spreadsheets or expensive software, this Excel-based dashboard brings all your continuity metrics into one centralized, interactive view.
🔑 Key Features of Business Continuity Dashboard in Excel
✨ 5 Analytical Pages – Overview, Department Analysis, Incident Type Analysis, Test Result Analysis, and Monthly Trends.
✨ Executive Overview – High-level KPIs such as Cost of Downtime, Test Pass %, In Progress %, and Recovery Time.
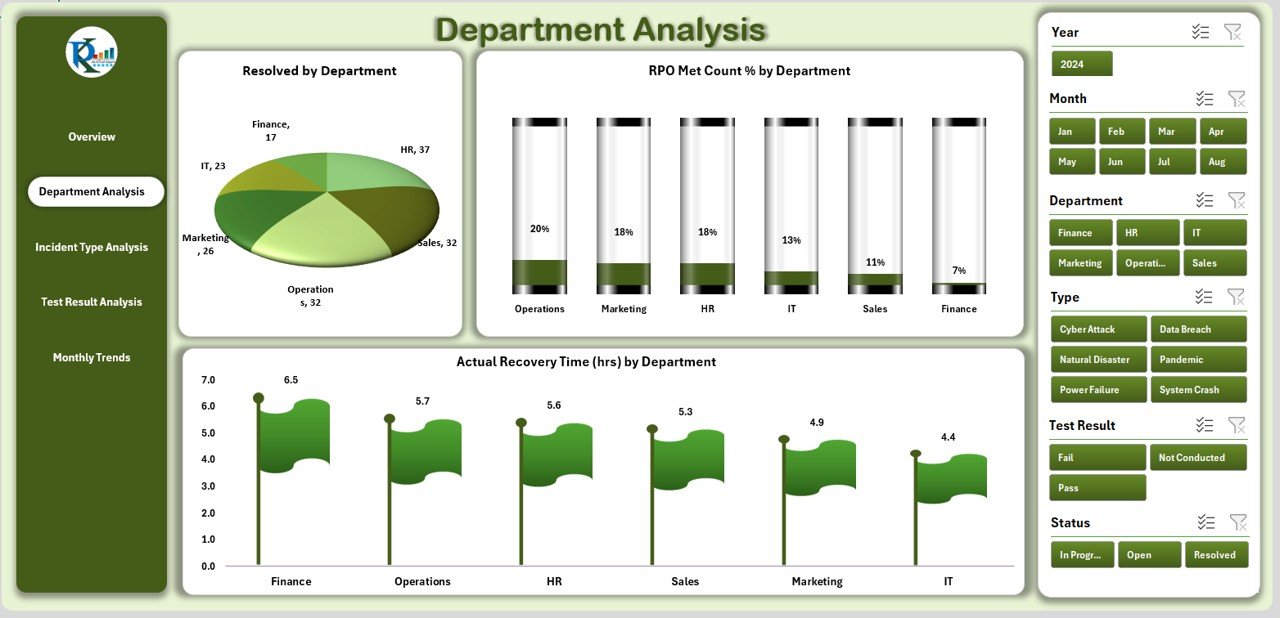
✨ Department Accountability – Track incidents, RPO Met %, and recovery time by department.
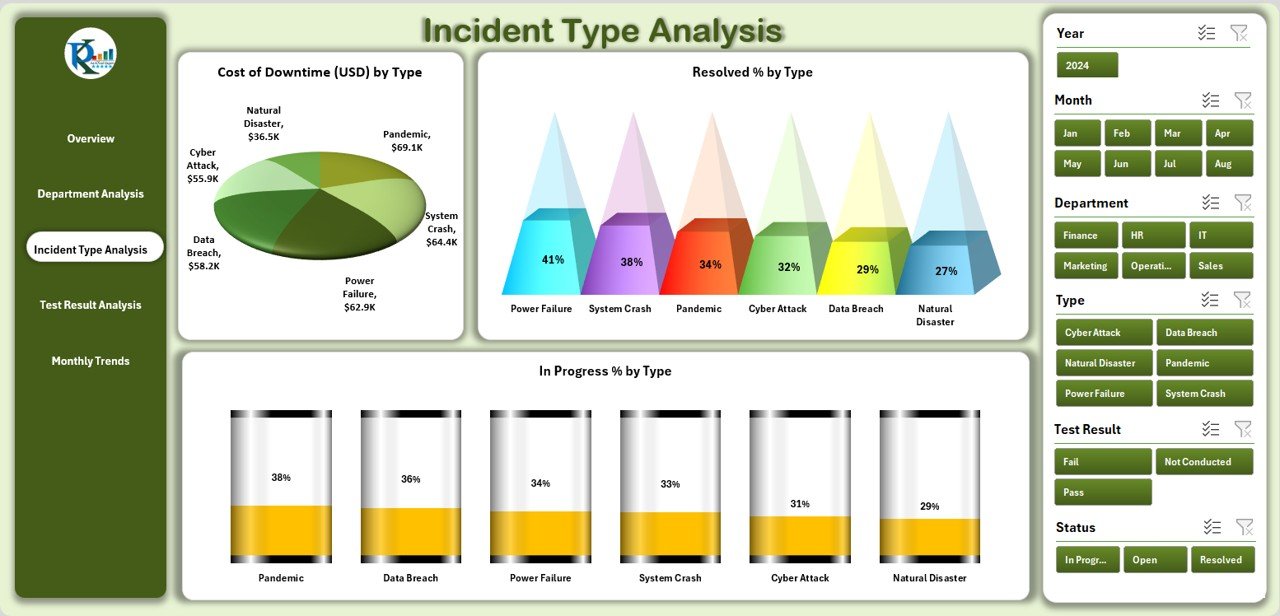
✨ Incident Type Insights – Identify costliest and most frequent disruptions by category.
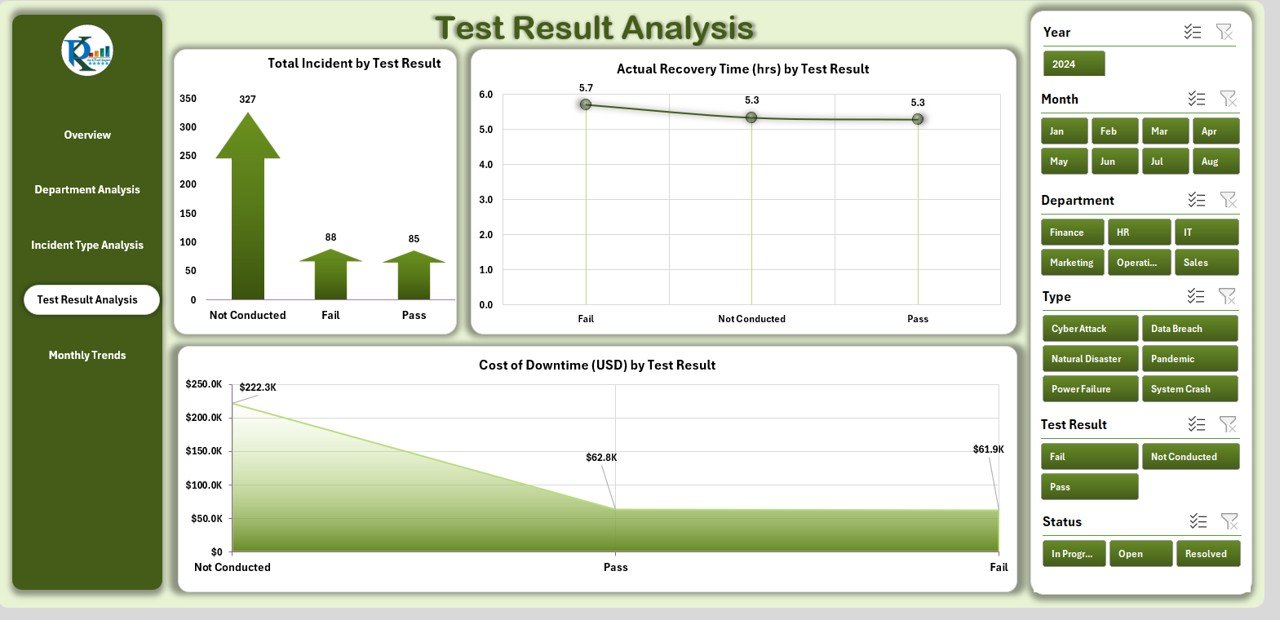
✨ Test Result Analysis – Evaluate continuity test performance with KPIs and charts.
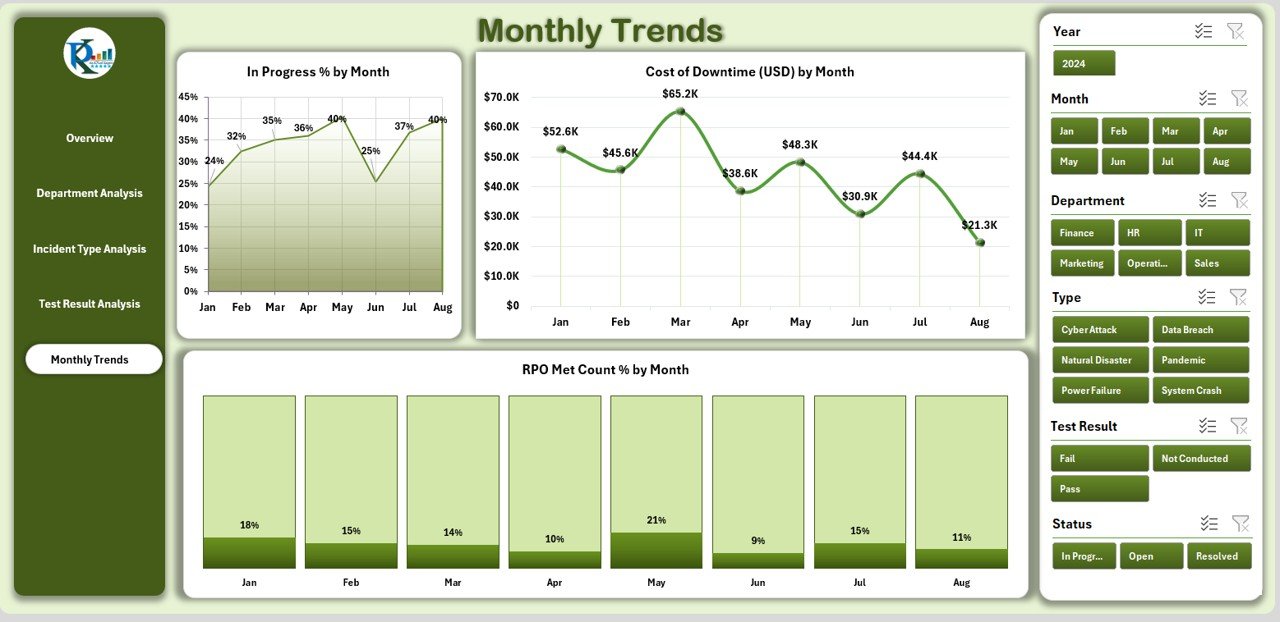
✨ Monthly Trend Tracking – Monitor long-term resilience and cost patterns.
✨ Data & Support Sheets – Store raw input, reference lists, and dropdowns for accuracy.
✨ Excel-Powered – No additional software or subscription needed.
📦 What’s Inside the Dashboard
Here’s what you get with the Business Continuity Dashboard in Excel:
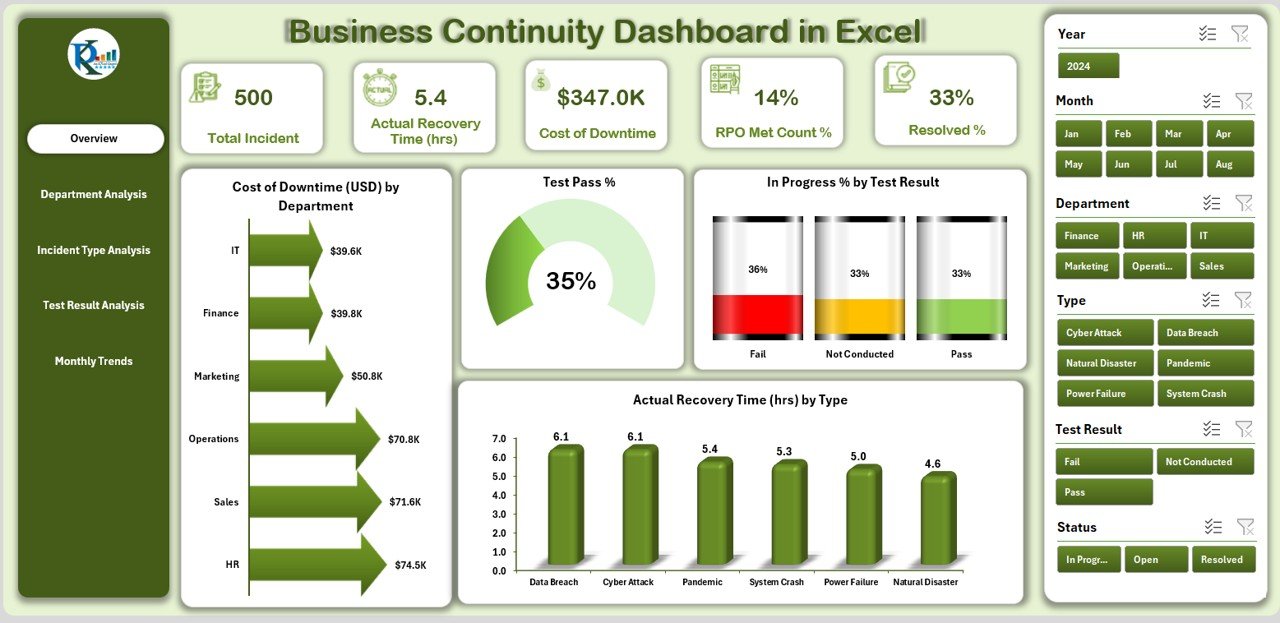
1️⃣ Overview Page – Control center with summary KPIs and charts for quick decision-making.
2️⃣ Department Analysis – Drill into continuity performance by business unit.
3️⃣ Incident Type Analysis – Analyze the frequency and cost of incidents by type.
4️⃣ Test Result Analysis – Review the success of continuity tests and recovery performance.
5️⃣ Monthly Trends – Track costs, incidents, and recovery performance over time.
6️⃣ Data Sheet – Enter all raw incident, test, and cost data.
7️⃣ Support Sheet – Reference lists for departments, incident types, and test categories.
This structured design ensures clarity, accountability, and quick insights when disruptions occur.
🛠️ How to Use the Business Continuity Dashboard
✔️ Step 1 – Input Data: Record incidents, costs, recovery times, and test results in the Data Sheet.
✔️ Step 2 – Navigate Pages: Use the side navigator to switch between Overview, Department, Incident Type, Test Results, and Trends.
✔️ Step 3 – Review KPIs: Monitor cost of downtime, RPO/RTO performance, and test pass rates.
✔️ Step 4 – Analyze Patterns: Identify weaknesses across departments, incident types, or test outcomes.
✔️ Step 5 – Take Action: Use insights to improve recovery strategies, allocate resources, and strengthen resilience.
No technical expertise required — it’s plug-and-play inside Excel.
👥 Who Can Benefit from This Dashboard
🛡️ Business Continuity Managers – Oversee preparedness and resilience across the organization.
💻 IT & Security Teams – Track recovery times and test success rates.
📊 Compliance Officers – Ensure regulatory compliance with documented KPIs.
🏢 Department Heads – Monitor their unit’s performance during incidents.
👔 Executives & Senior Leaders – Make quick, informed decisions during disruptions.
Whether you’re a small business or a global enterprise, this dashboard scales with your needs.
With the Business Continuity Dashboard in Excel, you can:
✅ Centralize all continuity data in one place.
✅ Reduce reliance on costly third-party tools.
✅ Respond faster with real-time insights.
✅ Improve accountability across departments.
✅ Build confidence with stakeholders & regulators.
Click here to read the Detailed blog post
Visit our YouTube channel to learn step-by-step video tutorials 👉 Youtube.com/@PKAnExcelExpert


Reviews
There are no reviews yet.