Stop guessing. Start knowing. One dashboard. Five analytical views. Real-time clarity on every order, every plant, every planner.
👉 Get the Dashboard — Only $17.99

Is Your Production Team Flying Blind? Not Anymore.
Managing a manufacturing operation without clear data visibility is like trying to drive in the dark — dangerous, slow, and costly.
Missed deadlines. Untracked bottlenecks. Planned vs. actual gaps that nobody catches in time. Sound familiar?Production Planning Dashboard in Power BI
Let’s explore everything this dashboard offers and why it might be the smartest tool investment your team makes this year.Production Planning Dashboard in Power BI
What Is the Production Planning Dashboard in Power BI?
This is a pre-built, fully interactive Power BI dashboard that converts your raw production data into crystal-clear, actionable insights — instantly.
Whether you’re running a single workshop or managing multiple plants across different locations, this dashboard scales effortlessly to match your operational complexity. It connects to your existing data sources — Excel, ERP systems, SQL databases, or cloud services — so there’s no major setup headache.
At just $17.99 (originally $40.99), it delivers enterprise-level analytics at a fraction of the cost of custom development.
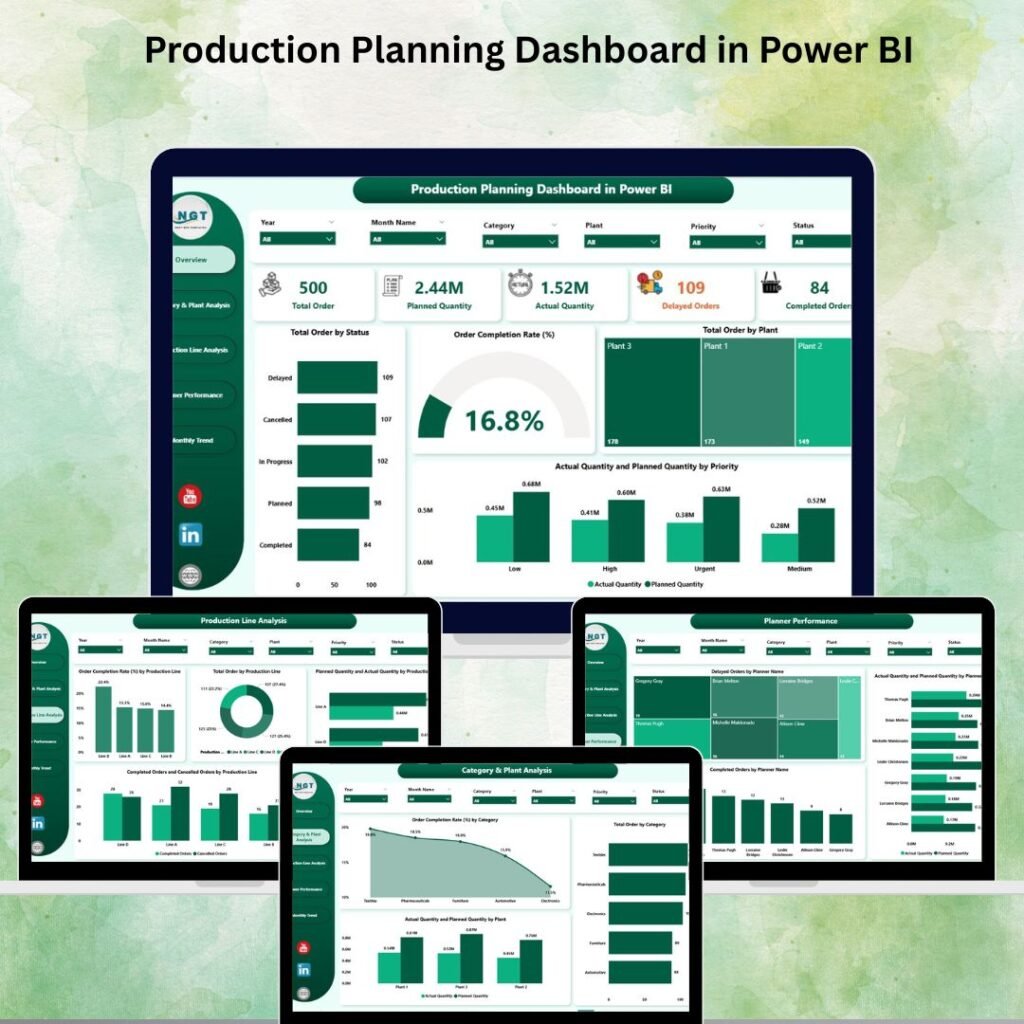
5 Pages. 5 Levels of Insight.
The Production Planning Dashboard comes packed with 5 dedicated analytical pages, each designed to answer a specific operational question.
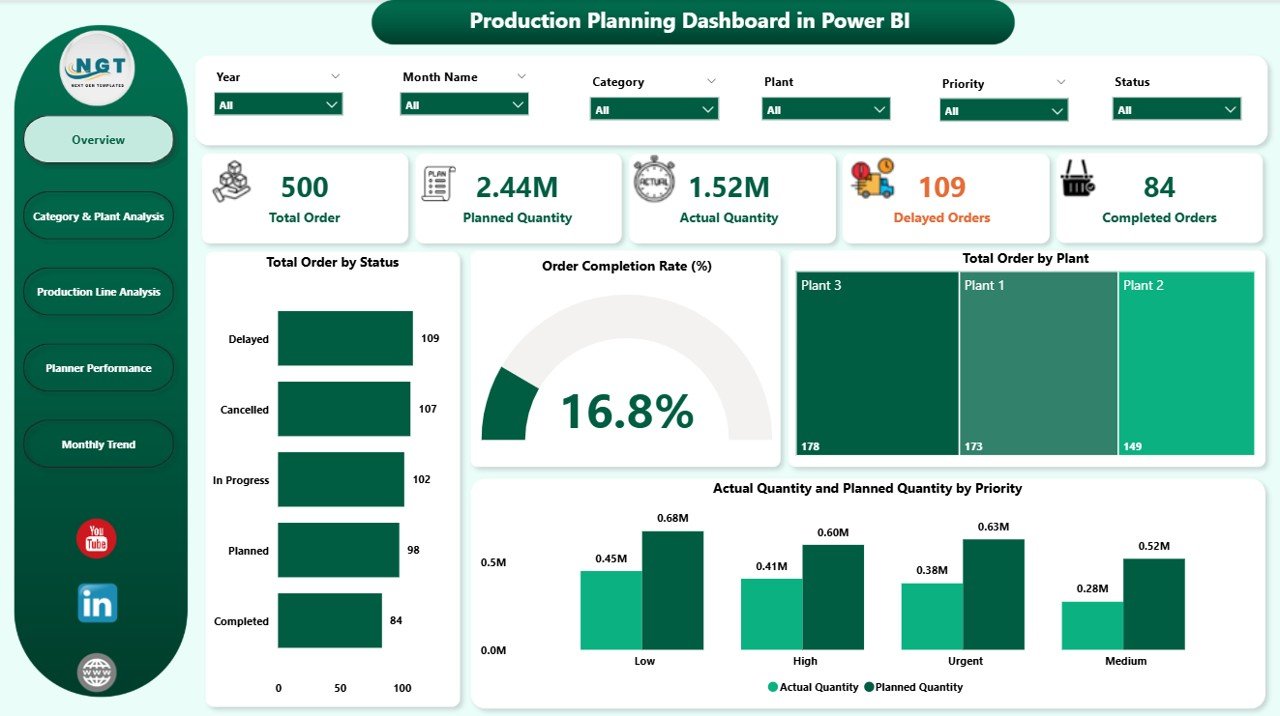
Overview Page — Your Command Center
The Overview page gives you the full picture at a glance. Everything critical is front and center — no more digging through spreadsheets.
- Total orders, completion rates, and pending tasks
- Plant-wise production distribution
- Planned vs. actual performance comparison
- Real-time KPI cards that update automatically
Category & Plant Analysis — Know What’s Working
This page helps you drill down by product category and plant location to find your strongest and weakest performers.
- Identify top-performing plants and underperforming categories
- Compare output across different product lines
- Quickly spot where resources are being underutilized
Production Line Analysis — Eliminate Bottlenecks Fast
The Production Line Analysis page puts efficiency under the microscope. This is the page operations managers will live in.
- Track planned vs. actual output per production line
- Monitor cancellation rates and order slippages
- Identify chronic underperformers before they become costly problems
Planner Performance — Accountability Made Visual
Are your planners hitting their targets? This page makes it easy to find out — with clear, honest, data-backed metrics.
- Evaluate individual planner efficiency at a glance
- Spot recurring delays and scheduling mismatches
- Drive accountability with transparent performance tracking
Monthly Trends — Plan Smarter for the Future
The Monthly Trends page turns historical production data into a forecasting superpower for your planning team.
- Identify seasonal demand patterns
- Spot recurring issues that repeat month after month
- Use trend data to build more accurate production schedules
A Closer Look Inside the Dashboard
Here’s a preview of the additional analytical views that come bundled with your purchase:


Key Features at a Glance
The Production Planning Dashboard in Power BI is loaded with features that make day-to-day operations significantly easier:
Custom SlicersFilter instantly by date, plant, product category, or production line.
Real-Time KPIsAlways know where you stand on orders, completion, and pending tasks.
Planned vs. Actual TrackingCatch discrepancies before they turn into costly delays.
Professional VisualsClean, polished charts that are easy to read, share, and present.
Flexible Data SourcesConnect to Excel, ERP, SQL, and cloud platforms with ease.
Fully CustomizableAdd, remove, or modify KPIs to perfectly match your business needs.
Who Should Use This Dashboard?
This tool was built with real operational roles in mind. If you wear any of these hats, this dashboard was made for you:
Manufacturing Managers
Stay on top of production schedules and targets.
Operations Analysts
Spot inefficiencies and optimize workflows.
Production Planners
Compare planned vs. actual for smarter scheduling.
Business Owners
Get a clear, real-time view of operational health.
Multi-Plant Operators
Compare performance across locations for better resource allocation.
How to Get Started in 4 Simple Steps
Getting this dashboard up and running is faster than you’d think:
Grab the Power BI template file instantly from NextGenTemplates.com.
Connect Your DataLink to Excel, ERP, SQL, or your preferred cloud data source.
Apply Your FiltersUse slicers to set the right date range, plant, category, or production line.
Analyze & ActReview KPIs, drill down into issues, and make smarter decisions every day.
Why This Dashboard Pays for Itself
The return on this small investment is significant. Here’s what you stand to gain from day one:
- ⚡
Faster Decisions — Instant insights replace hours of manual reporting.
- 🎯
Reduced Errors — Catch planned vs. actual mismatches in real time.
- 💡
Better Resource Allocation — Focus effort where it matters most.
- 🤝
Stronger Team Alignment — Share visual reports everyone can understand.
- 📅
Improved Forecasting — Monthly trends give you the data to plan ahead with confidence.
When even one delayed production order is prevented, this dashboard has already paid for itself many times over.
Visit our YouTube channel to watch the demo.
Watch step-by-step video tutorials and see the dashboard in action before you buy.