Whether you prefer the robust power of Power BI or the simplicity of Google Sheets, NextGenTemplates has you covered with two ready-to-use, professionally designed solutions.Powerful Reasons These Sales BI Dashboards
Introducing the Sales Business Intelligence Dashboard in Power BI and the Sales Business Intelligence Dashboard in Google Sheets — two dynamic, plug-and-play dashboards built to give you complete visibility over your sales performance, right out of the box.Powerful Reasons These Sales BI Dashboards
What Are These Sales BI Dashboards?
Both dashboards are pre-built analytics tools that transform your raw sales data into meaningful, visual insights. Instead of staring at rows and columns, you get interactive charts, KPI cards, trend lines, and regional comparisons — all updating automatically as your data changes.Powerful Reasons These Sales BI Dashboards
The Power BI version is built for teams that need advanced interactivity, stunning visuals, and enterprise-grade reporting. The Google Sheets version is ideal for those who want a lightweight, cloud-based, fully collaborative solution without any additional software. Together, they cover every kind of sales team — from startups and SMBs to large enterprises.Powerful Reasons These Sales BI Dashboards
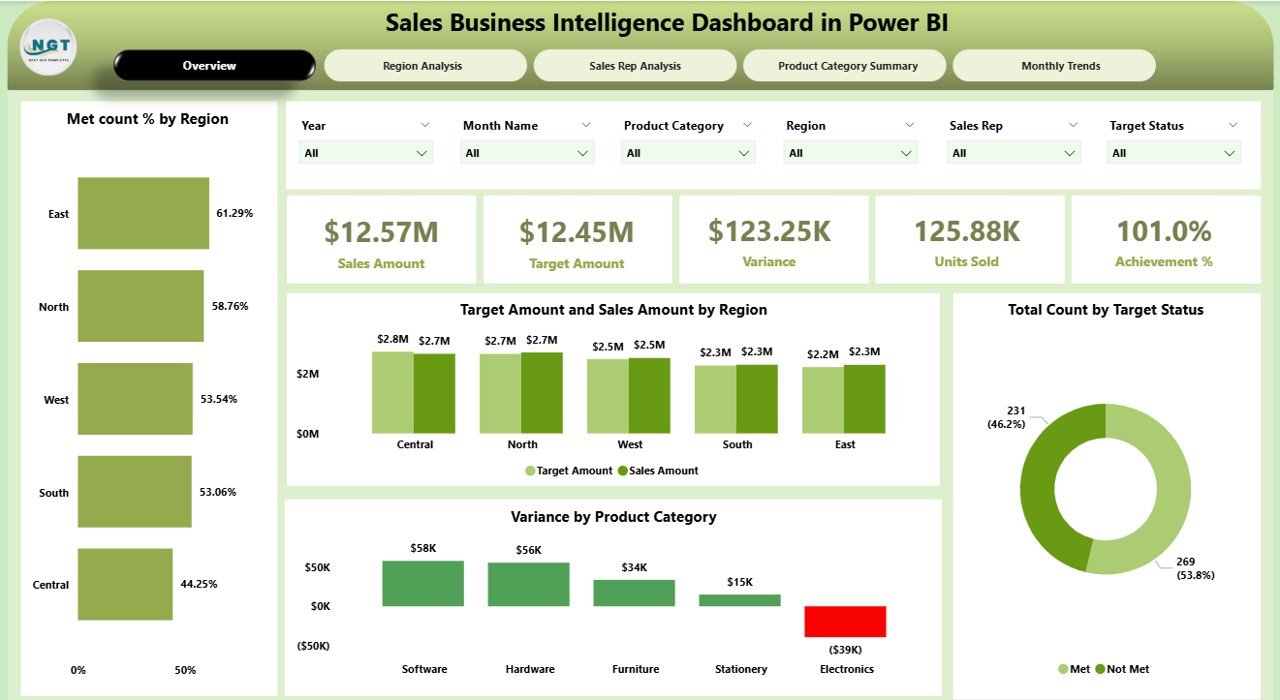
Sales Business Intelligence Dashboard in Power BI — Overview Page
5 Powerful Reasons to Use These Dashboards Today
📊 Complete Sales Visibility Across 5 Key Analysis Areas
Both dashboards cover every critical dimension of your sales performance, all in one place:
- Overview / Main Dashboard — KPI cards showing Total Sales, Target Sales, Variance, Achievement %, and Units Sold at a glance.
- Region Analysis — Identify which territories are hitting targets and which need attention.
- Sales Rep Analysis — Evaluate individual performance and spot coaching opportunities.
- Product Category Summary — Understand which product lines are driving revenue.
- Monthly Trends — Track seasonal patterns and month-over-month growth to plan smarter.
🎯 Smart KPI Tracking with Real-Time Target Comparison
One of the standout features of both dashboards is built-in target vs. actual analysis. Every KPI card and chart is designed to show not just what happened, but how it compares to your goal. You get color-coded variance indicators, achievement percentage tracking, and target met/not met breakdowns — all calculated automatically. This kind of instant performance awareness helps managers take action before small gaps become big problems.
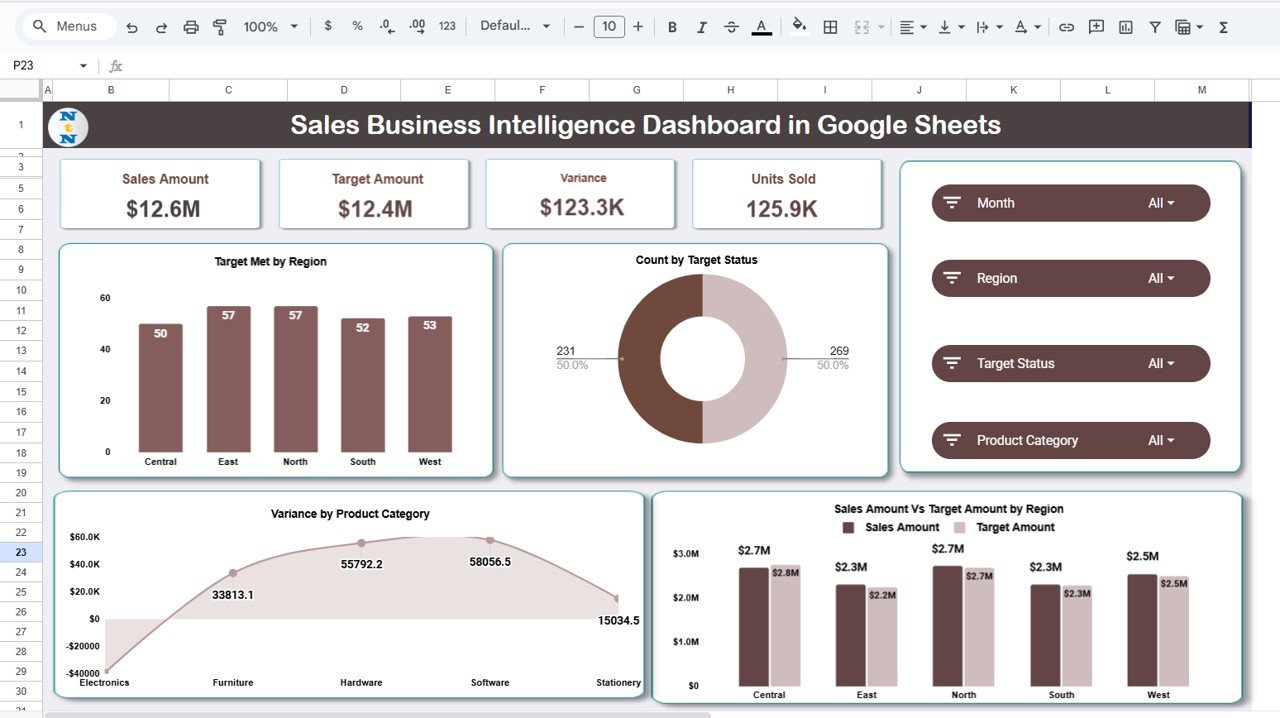
Sales Business Intelligence Dashboard in Google Sheets — Overview Page
🌍 Flexible Platform — Power BI or Google Sheets, Your Choice
The Power BI dashboard is ideal if your team already uses Microsoft 365. It features 5 dedicated report pages, advanced DAX calculations, 6 smart slicers, and export-ready reports for PDF, PowerPoint, or Microsoft Teams — perfect for executives and strategy teams who need board-ready reports.
The Google Sheets dashboard shines when collaboration and accessibility are priorities. It’s 100% cloud-based, works on any device, supports simultaneous multi-user access, and includes a dedicated Search Tab to instantly filter any rep, region, or product record — no scrolling required.
🧮 Zero Coding Required — Just Plug in Your Data
Both dashboards are completely no-code solutions. For the Power BI version, simply download the .pbix file, connect it to the included Excel data source, and every page updates instantly. For the Google Sheets version, update the Data Sheet with your sales records and all charts, KPIs, and trend reports refresh automatically. Your team can be up and running in minutes — not days or weeks.
👥 Built for Every Role in Your Organization
Whether you’re a sales manager reviewing team performance, a regional head analyzing territory results, a product manager tracking category revenue, or an executive needing a board-ready summary — these dashboards were designed with your needs in mind. They serve sales-driven businesses across all industries: retail, SaaS, B2B, B2C, healthcare, manufacturing, and more.
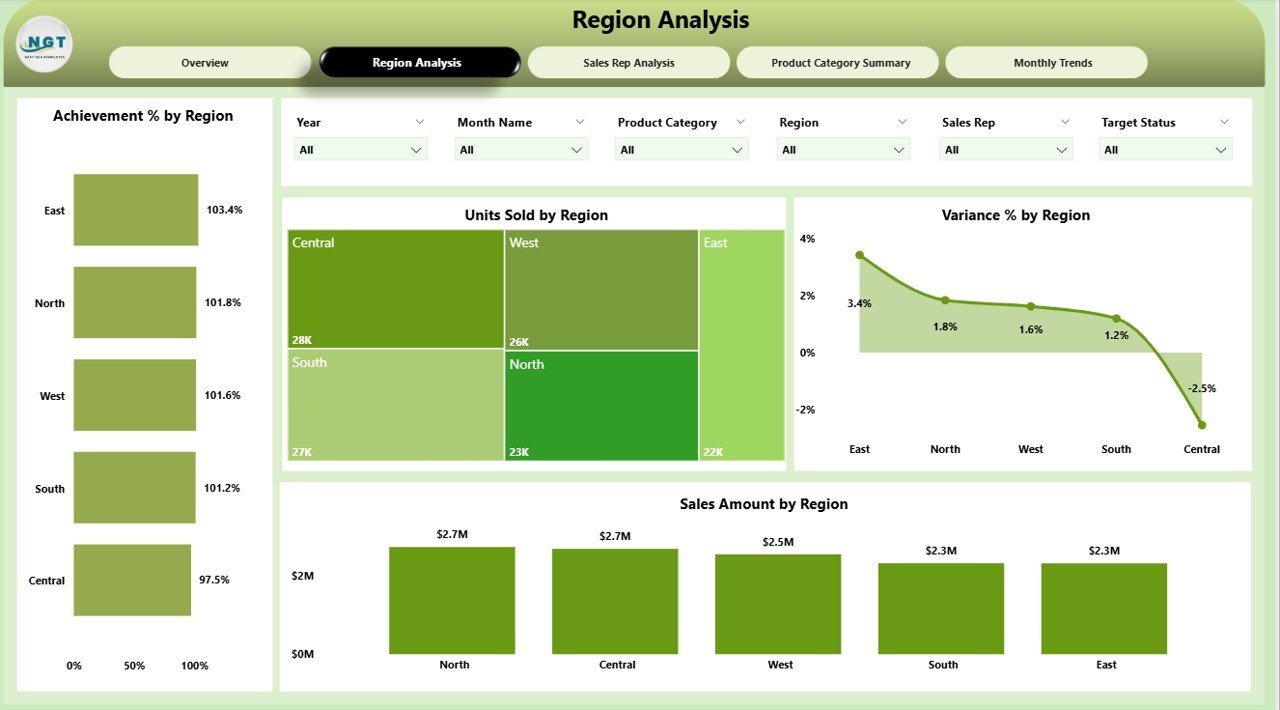
Power BI Dashboard — Region Analysis Page
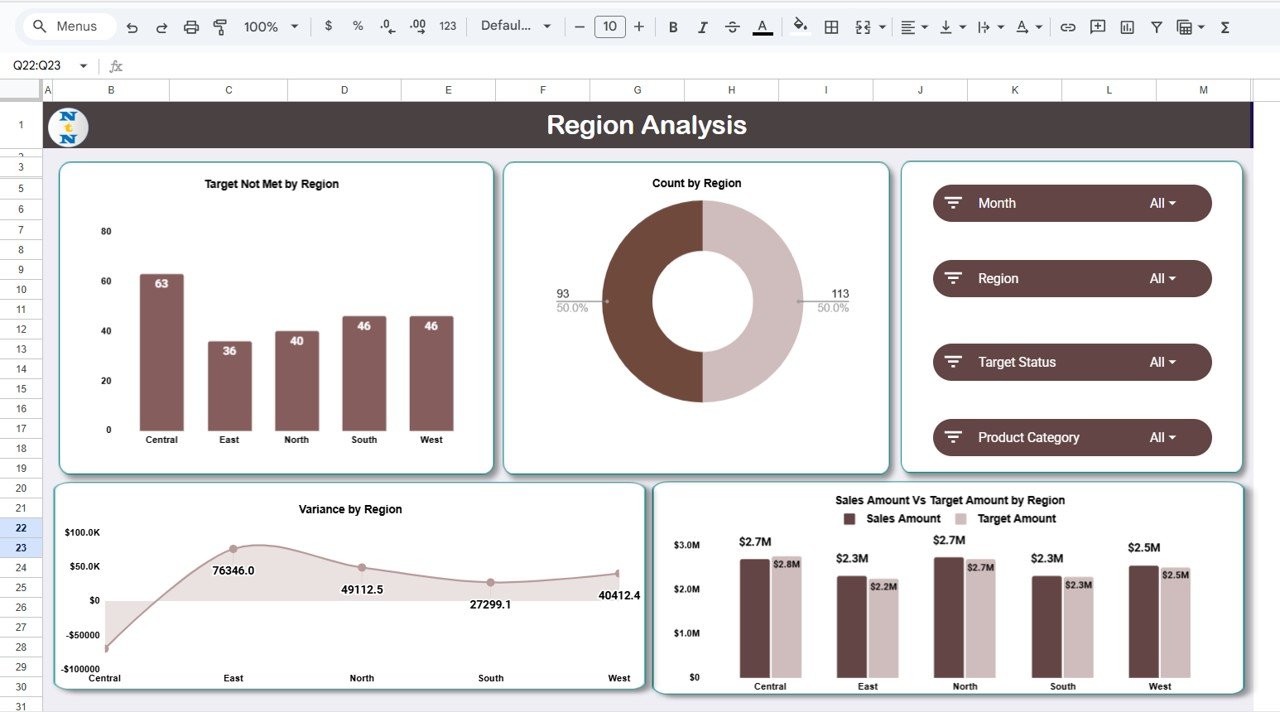
Google Sheets Dashboard — Region Analysis
Power BI vs. Google Sheets — Which One Is Right for You?
Both tools share the same analytical depth. The right choice comes down to your team’s workflow and preferred platform.
| Feature | Power BI Version | Google Sheets Version |
|---|---|---|
| Platform | Power BI Desktop | Google Sheets (Cloud) |
| Collaboration | Share via Teams / PDF / PowerPoint | Real-time multi-user editing |
| Interactivity | Advanced slicers & DAX calculations | Dynamic charts & auto-filters |
| Access | Desktop app required | Any browser, any device |
| Analysis Pages | 5 dedicated report pages | 5 analysis tabs + Search tab |
| Price | $17.99 | $14.99 |
| Best For | Enterprises & analysts | SMBs & remote teams |
Many teams actually use both — one for internal operational tracking and the other for executive reporting. At these price points, it’s a no-brainer investment.
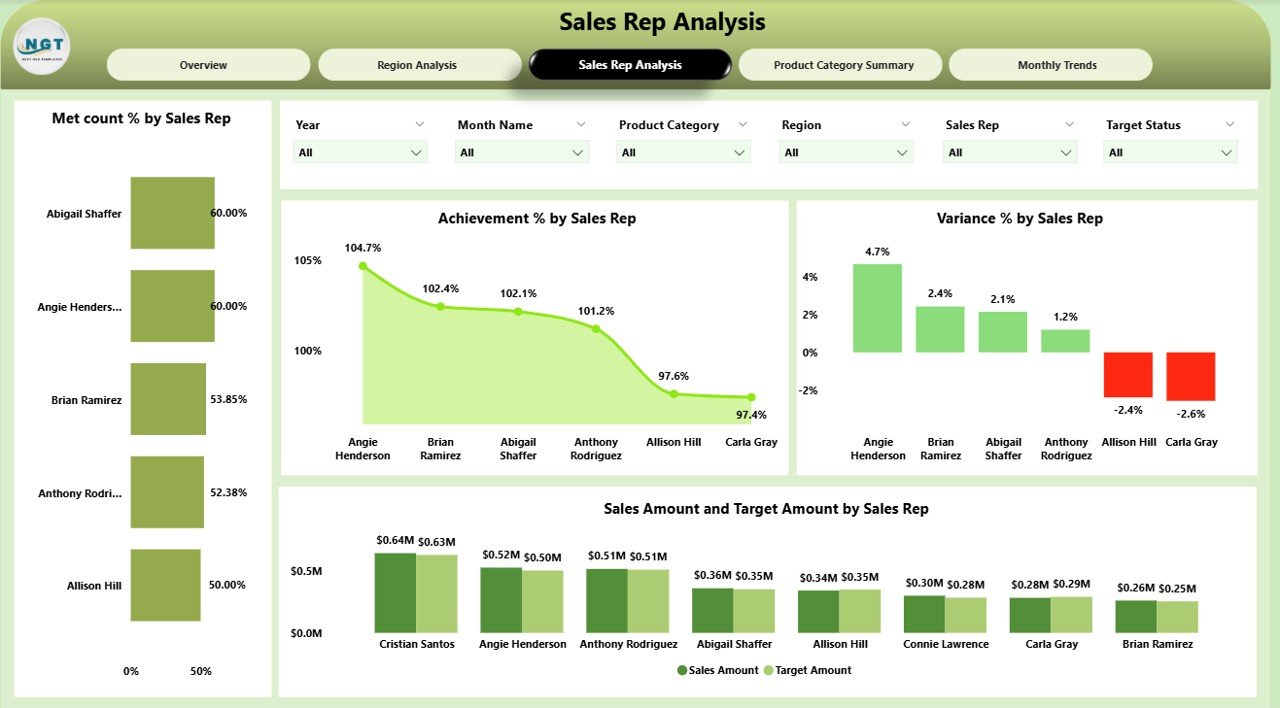
Power BI Dashboard — Sales Rep Analysis Page
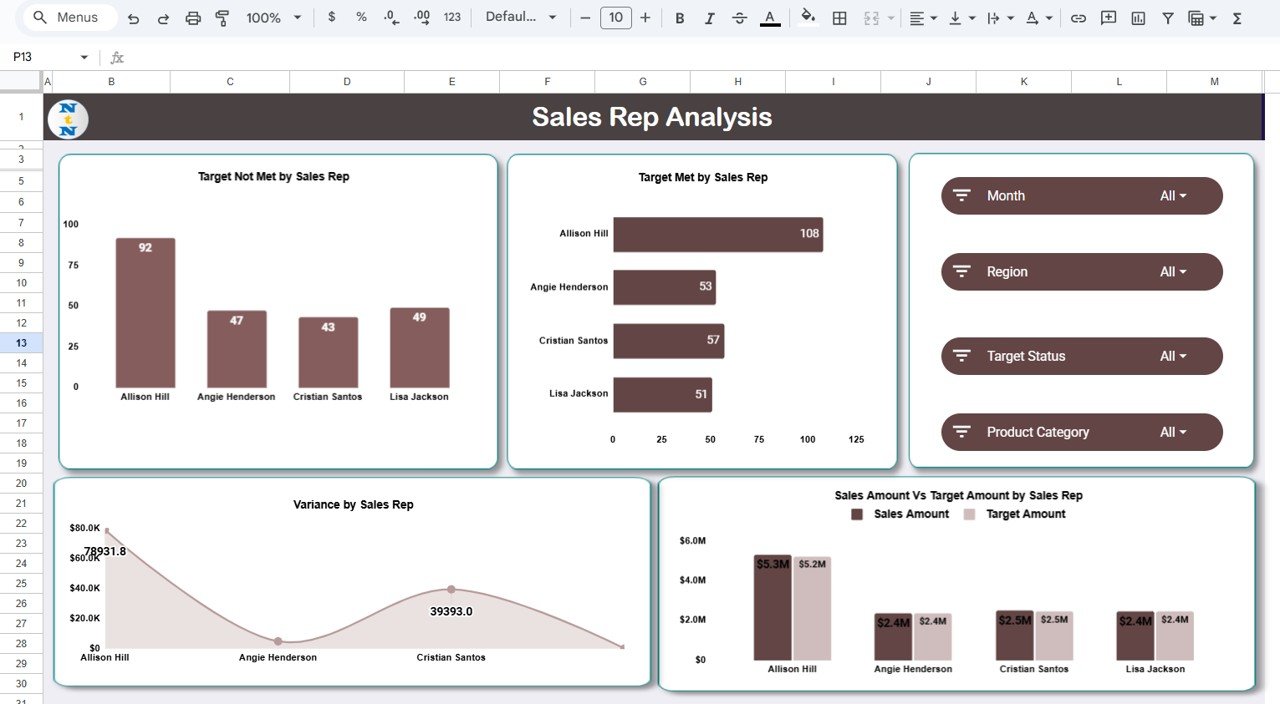
Google Sheets Dashboard — Sales Rep Analysis
How to Get Started in 5 Simple Steps
Getting up and running with either dashboard takes less than 5 minutes:
Purchase and download your preferred dashboard template from NextGenTemplates.com.
Open the file in Power BI Desktop or Google Sheets.
Enter or connect your sales data using the pre-formatted data sheet included.
Explore the analysis pages, apply filters, and start uncovering insights.
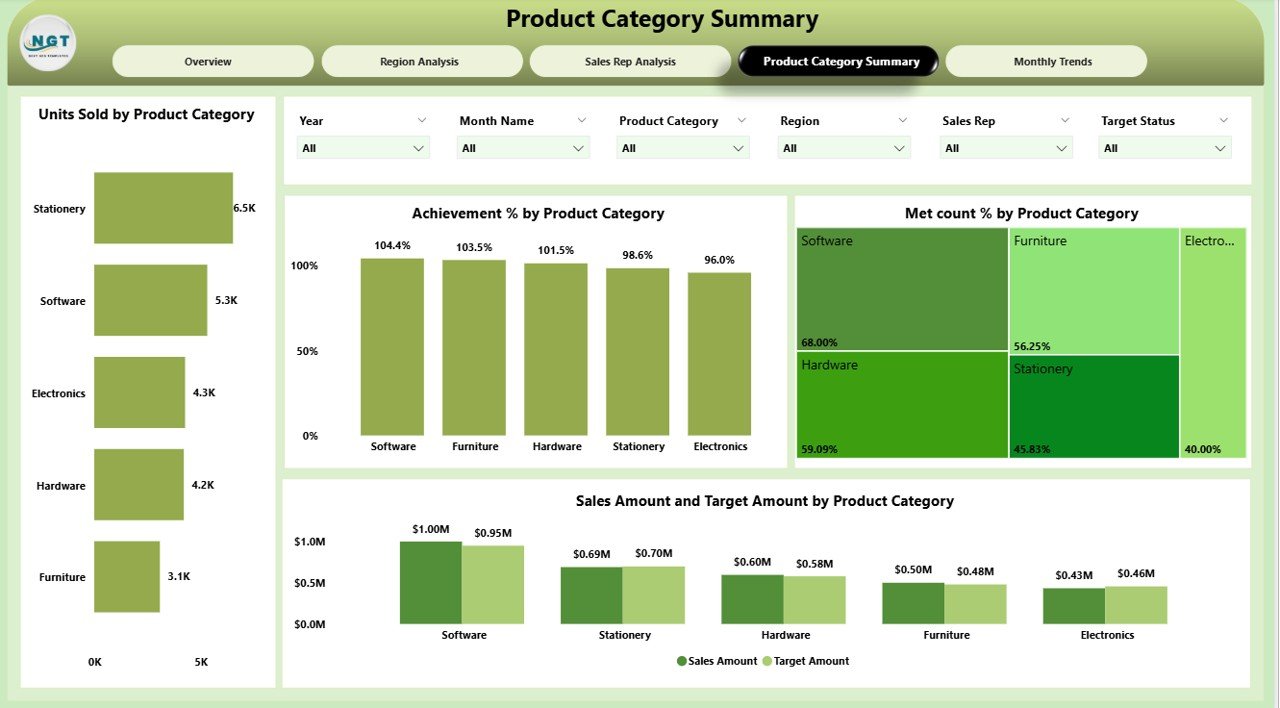
Power BI Dashboard — Product Category Summary
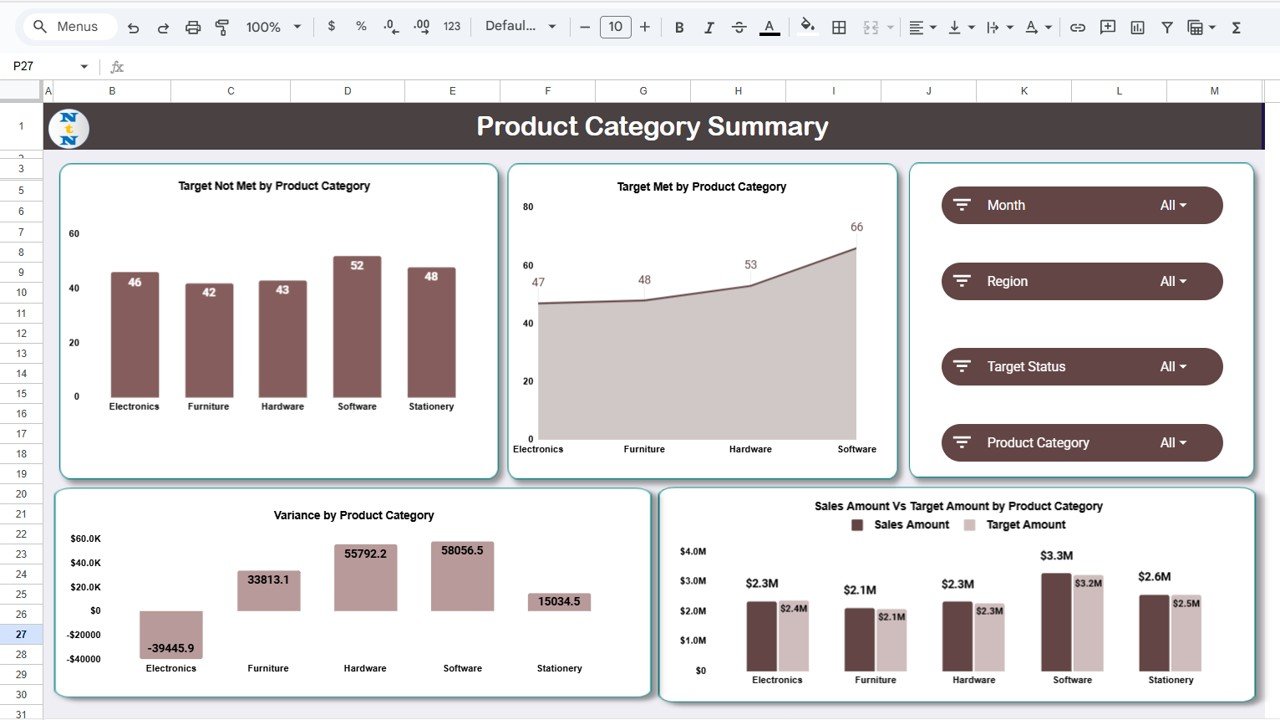
Google Sheets Dashboard — Product Category Summary
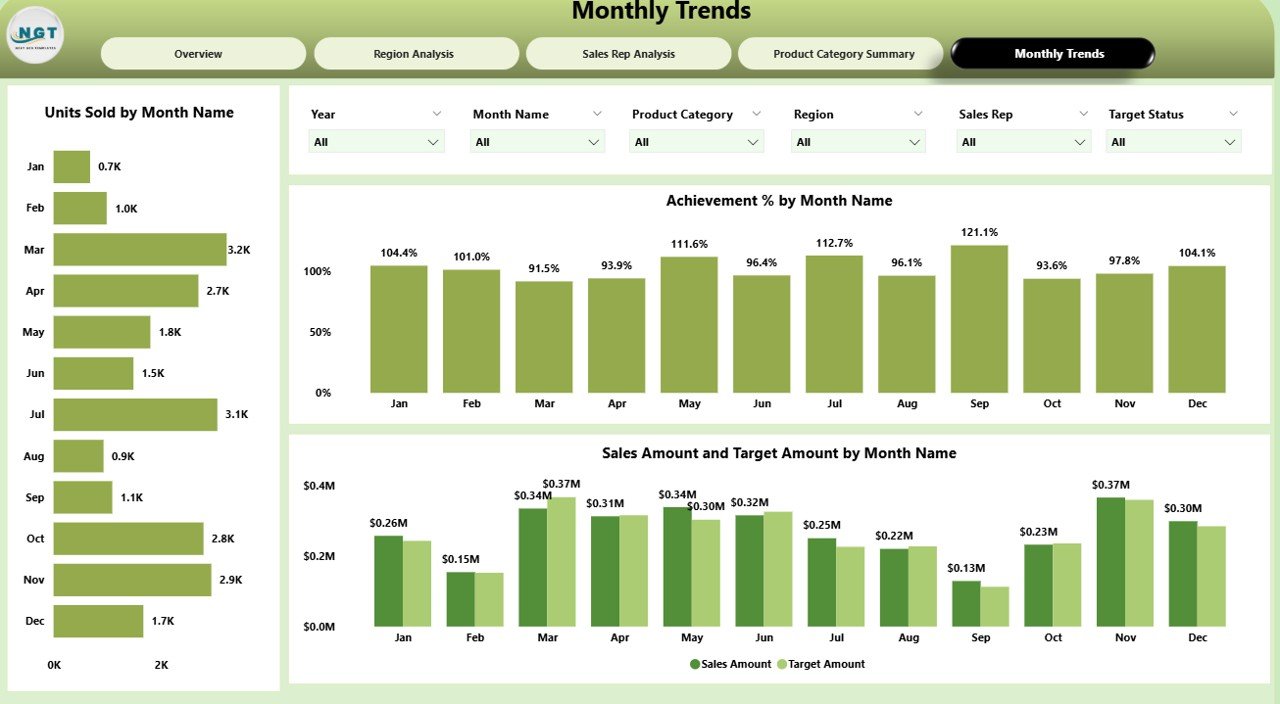
Power BI Dashboard — Monthly Trends Page
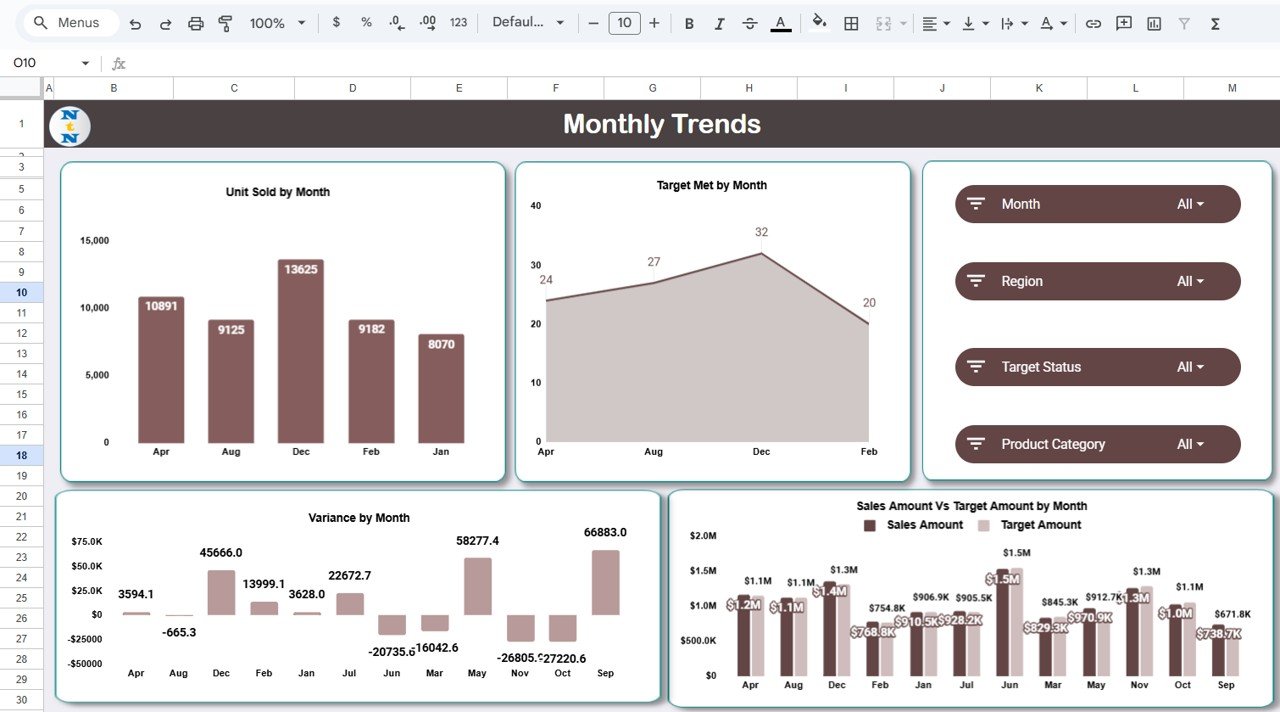
Google Sheets Dashboard — Monthly Trends
Final Thoughts
If your sales reporting still relies on manual processes and gut feeling, it’s time for an upgrade. The Sales Business Intelligence Dashboard in Power BI and the Sales Business Intelligence Dashboard in Google Sheets are two of the smartest investments you can make for your sales team right now.
Visit our YouTube channel to learn step-by-step video tutorials