That’s exactly why we built the Team Performance Dashboard series — a powerful trio of ready-to-use dashboards available in
Microsoft Excel,
Power BI, and
Google Sheets.
No matter which platform your team uses, we’ve got you covered with interactive KPIs, visual charts, and smart analytics — all starting at just $14.99.
In this article, we’ll walk you through each dashboard, highlight what makes it special, and help you pick the right one for your team.
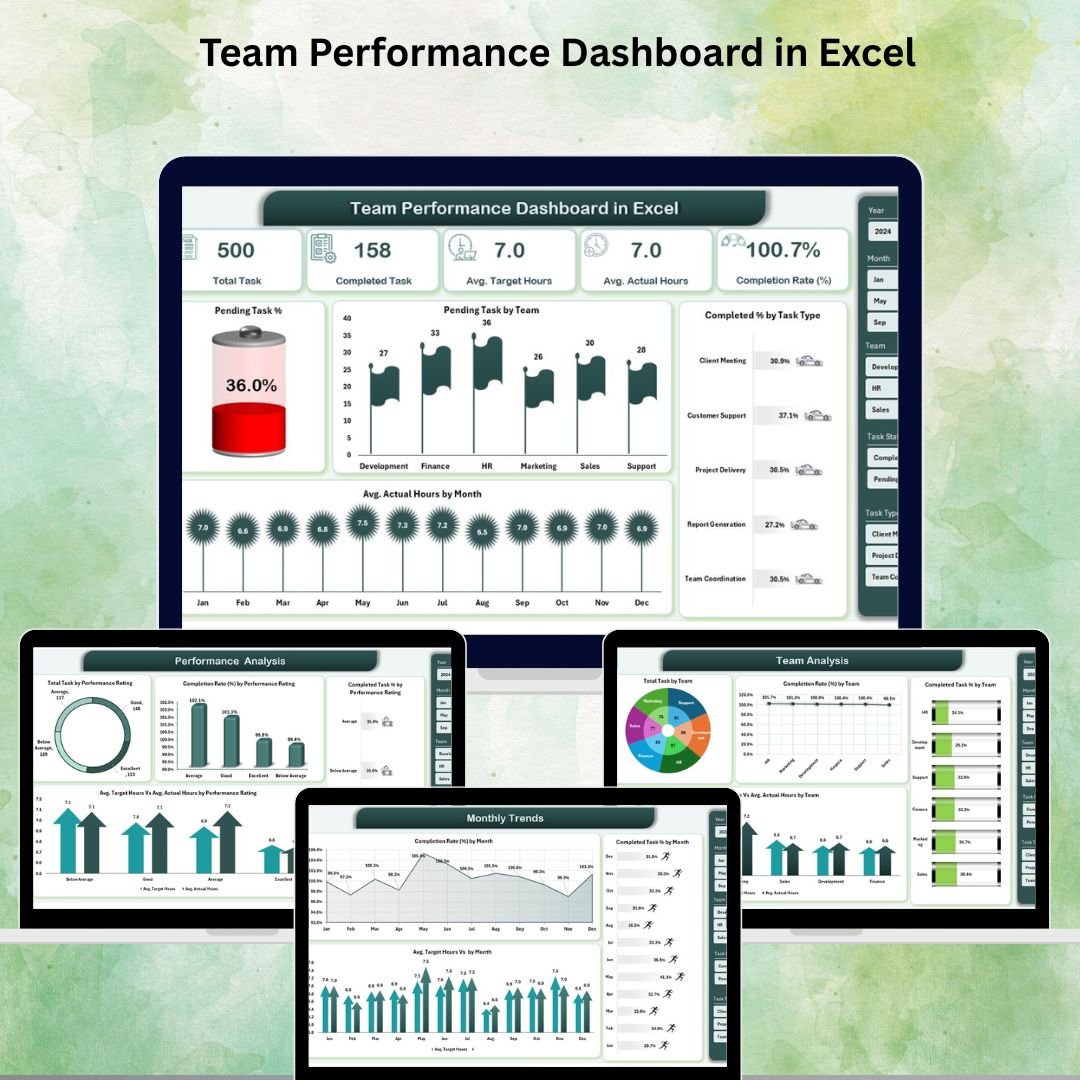
📊 Dashboard #1: Team Performance Dashboard in Excel
The Team Performance Dashboard in Excel is a complete, offline-ready performance monitoring solution for managers, HR professionals, and executives. Built entirely within Microsoft Excel, it requires zero coding and works with the tools your team already has.
✨ Key Features
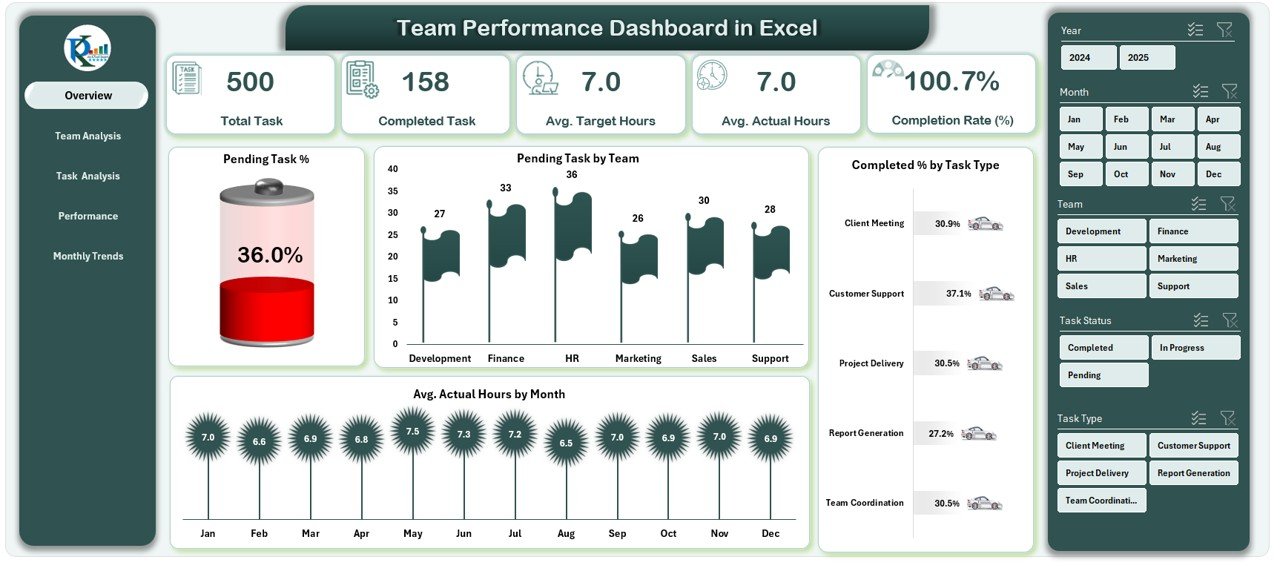
- 5 Analytical Pages — Overview, Team Analysis, Task Analysis, Performance Analysis & Monthly Trends
- KPI Cards — Instantly see task completion rates, pending %, and average hours
- Interactive Slicers — Filter by team, task type, performance rating, or month
- Dynamic PivotCharts — Visuals refresh automatically when new data is added
- Data Sheet + Support Sheet — Centralized, formula-driven performance tracking
- Fully Customizable — Adapt KPIs and charts to your team structure
- No Advanced Skills Needed — Works for anyone who can use Excel basics
🛠️ How It Works
Enter your task data (names, teams, dates, target vs. actual hours) into the Data Sheet, refresh PivotTables, and your entire dashboard updates automatically. Use slicers to drill into specific teams or time periods and export visuals for leadership presentations.
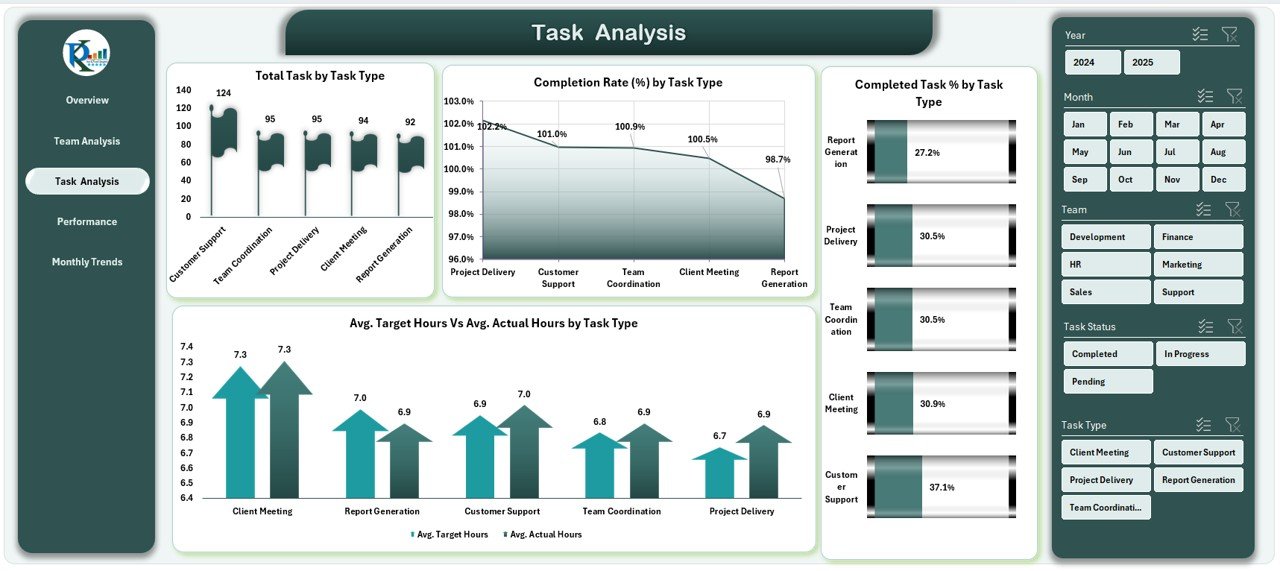
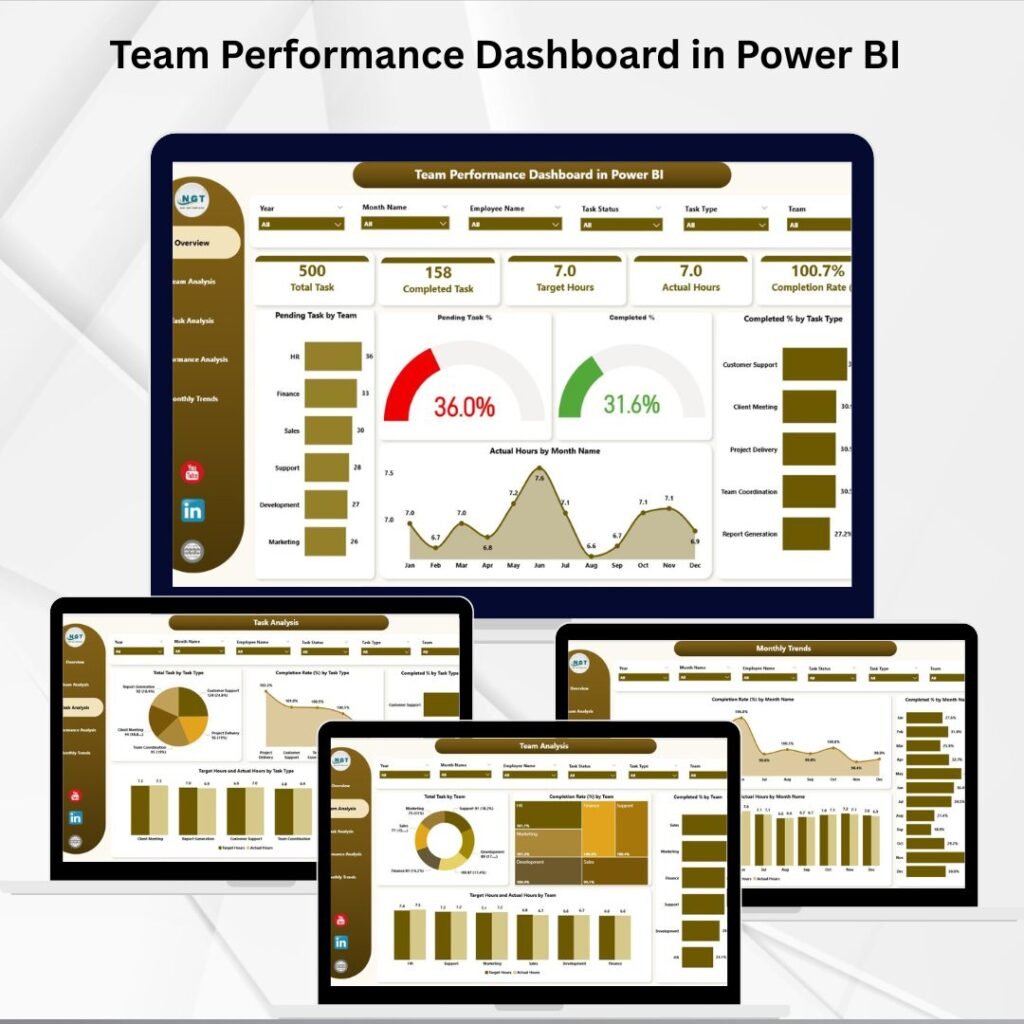
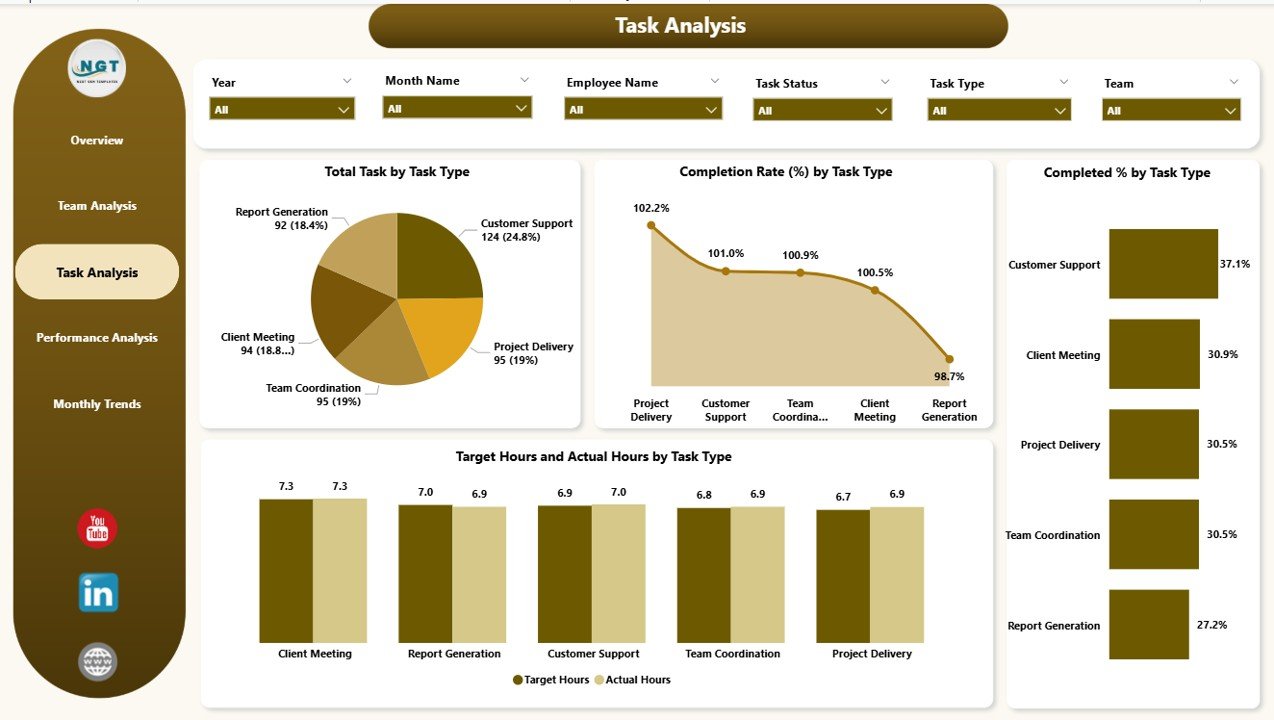
⚡ Dashboard #2: Team Performance Dashboard in Power BI
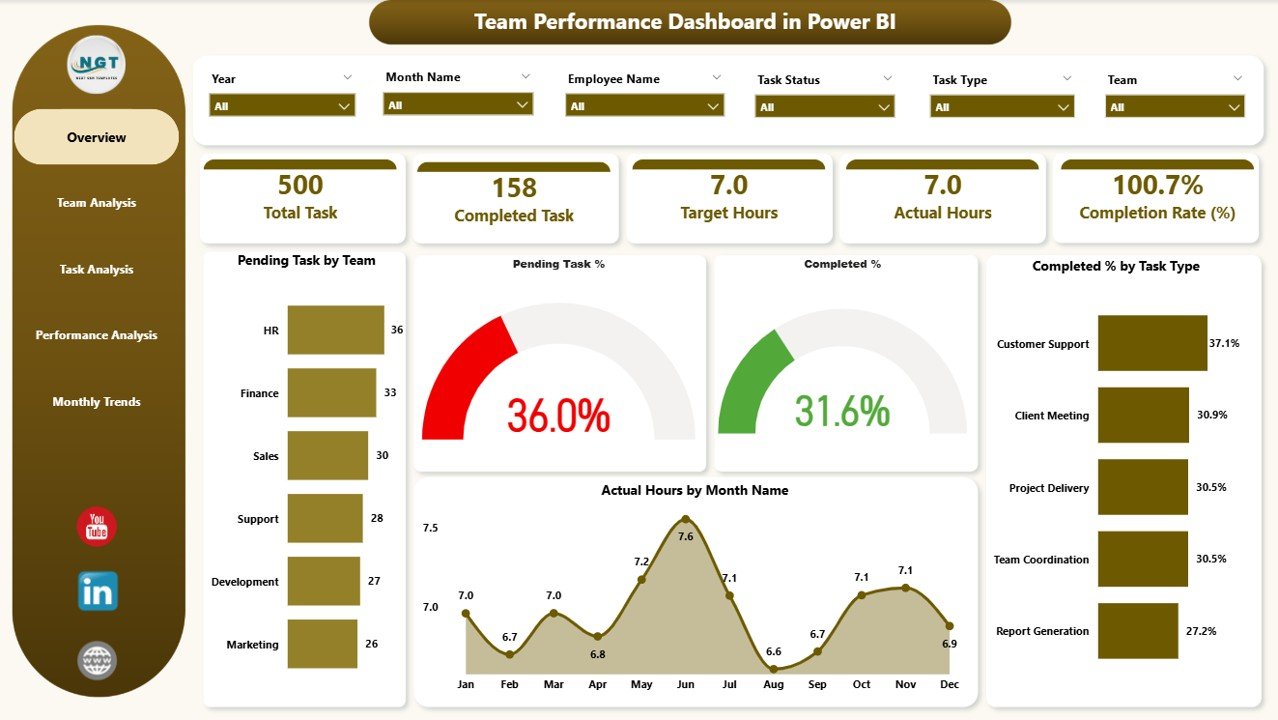
If your organization is serious about business intelligence, the Team Performance Dashboard in Power BI is the ultimate upgrade. Built on Microsoft’s powerful Power BI platform, this dashboard takes team performance tracking to an enterprise level — with stunning visuals, real-time data connections, and seamless sharing across your organization.
✨ Key Features
- 5 Structured Pages — Overview, Team Analysis, Task Analysis, Performance Analysis & Monthly Trends
- KPI Cards with Slicers — Showing pending tasks, completion %, and actual vs. target hours
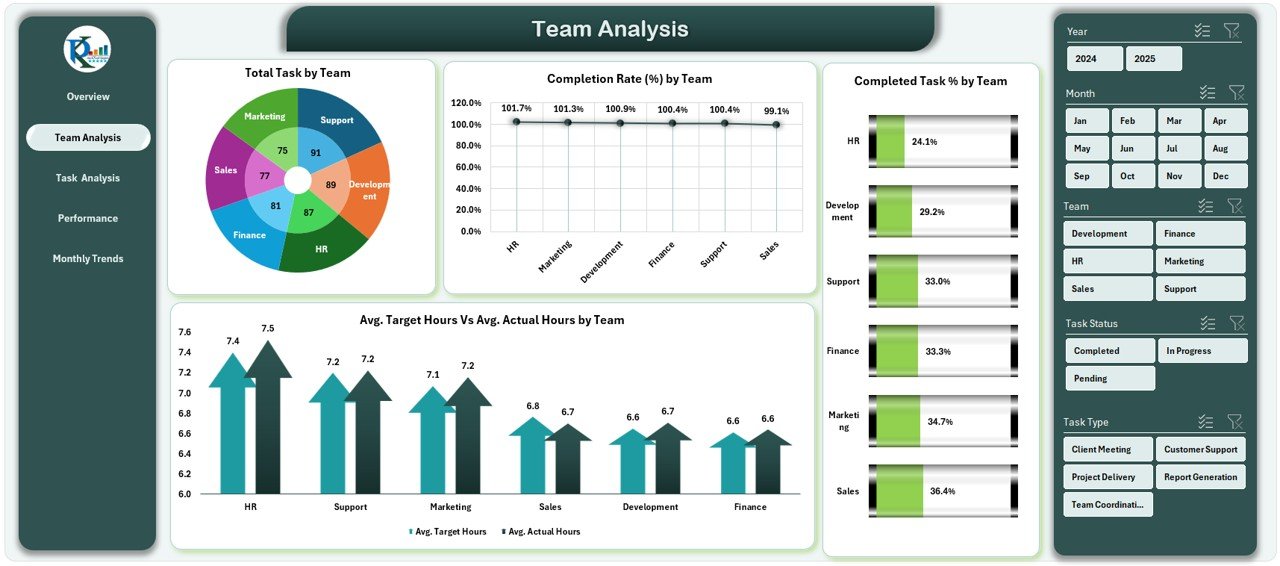
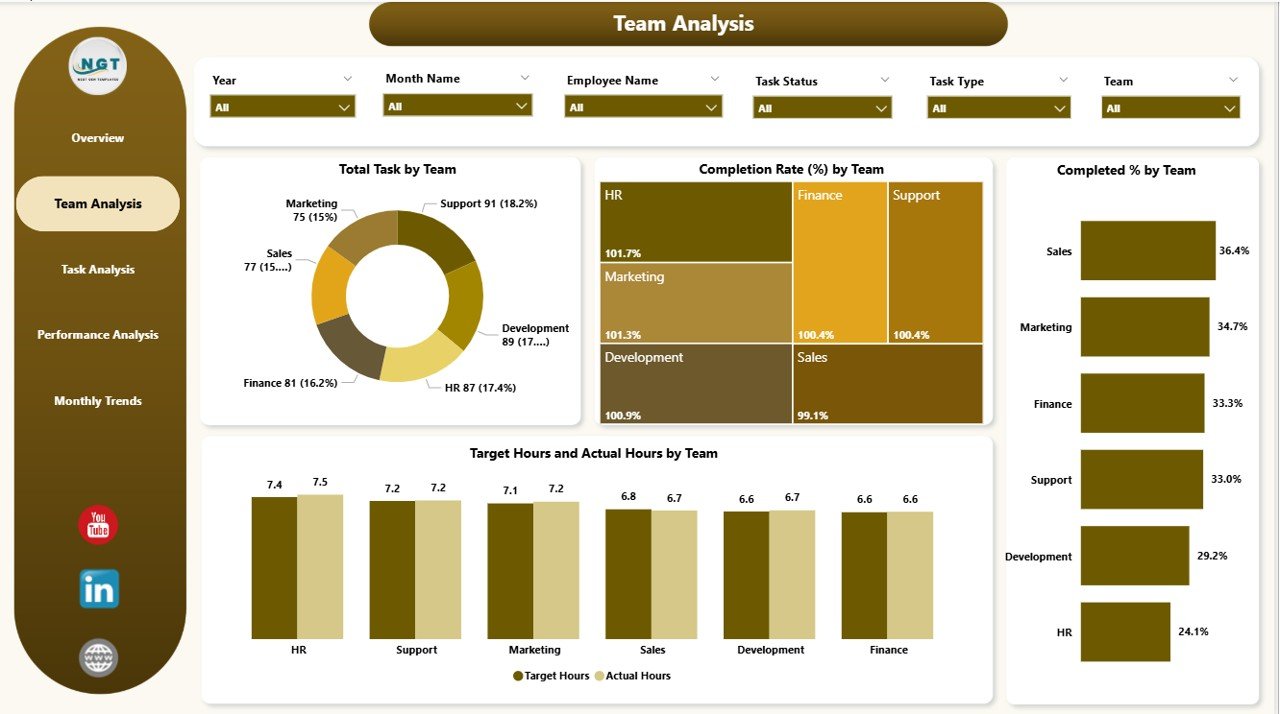
- Team Analysis Page — Compare department-level performance metrics side by side
- Performance Analysis Page — Link task outcomes to performance ratings for top-contributor recognition
- Excel Integration — Load data via Power Query for automated, real-time updates
- Publish to Power BI Service — Share with stakeholders across your organization instantly
- Conditional Formatting — Clean, intuitive layouts for fast decision-making
🛠️ How It Works
Collect your team’s task data in Excel, import it into Power BI using Power Query, and the dashboard comes to life. Navigate between pages, apply slicers to filter by team or timeline, compare actuals vs. targets, and publish to Power BI Service to share performance insights with leadership in real time.
🌐 Dashboard #3: Team Performance Dashboard in Google Sheets

Remote-first teams and cloud-native organizations will love the Team Performance Dashboard in Google Sheets. Fully cloud-based and built for real-time collaboration, this dashboard lets your entire team access, update, and monitor performance from anywhere — no software installation required.
✨ Key Features
- 6 Analytical Tabs — Dashboard Home, Team Analysis, Task Analysis, Performance Analysis, Monthly Trends & Search
- Dynamic KPI Cards — Total tasks, completed, in-progress, average target hours & actual hours
- Smart Search Feature — Find any task instantly using keywords or field names
- Fully Cloud-Based — Access and update from any device, anywhere, anytime
- Real-Time Auto-Updates — Charts refresh the moment data is entered in the Data Sheet
- Monthly Trends Page — Spot long-term productivity patterns and seasonal dips
- Zero Setup — No formulas, coding, or design skills required
🛠️ How It Works
Enter all task details into the Data Sheet — task name, team, task type, target & actual hours, status, dates, and performance level. Every chart and KPI card updates instantly. Share the link with your team for live collaboration, and use the Smart Search tool to find any task in seconds.


📋 Side-by-Side Comparison: Which Dashboard Is Right for You?
Still unsure which version fits your workflow best? Here’s a quick breakdown to help you decide:
| Feature | Excel | Power BI | Google Sheets |
|---|---|---|---|
| Price | $14.99 | $17.99 | $14.99 |
| Analytical Pages | 5 Pages | 5 Pages | 6 Tabs |
| Cloud Access | ❌ | Via BI Service | ✅ |
| Real-Time Collaboration | Limited | Via BI Service | ✅ Built-in |
| Interactive Slicers/Filters | ✅ | ✅ | ✅ |
| Smart Search Tool | ❌ | ❌ | ✅ |
| Enterprise Sharing | Manual Export | ✅ Power BI Service | ✅ Google Link |
| Software Required | MS Excel | Power BI Desktop | None (Browser) |
| Best For | Offline / Desktop | Enterprise BI | Remote Teams |
👥 Who Can Benefit from These Dashboards?
All three dashboards are designed to serve a wide range of professionals across industries:
Get clear visibility into who’s performing and where support is needed.
Monitor workload distribution, identify burnout risks, and track efficiency patterns.
Access high-level KPIs and performance summaries for strategic decision-making.
Keep projects on track with task-level metrics, trend analysis, and resource visibility.
Optimize team resources and boost output without expensive custom software.
Use Google Sheets version to collaborate in real time from anywhere in the world.
💡 Why Choose NextGenTemplates?
At NextGenTemplates, we believe powerful tools shouldn’t cost a fortune. Our dashboards are built with real professionals in mind:
- Ready to use from day one — no setup hassle, no steep learning curve
- Professionally designed with clean visuals and intuitive navigation
- Backed by documentation & video tutorials for easy onboarding
- Affordable pricing — all three dashboards priced at $14.99–$17.99
- Fully customizable — adapt to any team size, industry, or KPI structure
- Covers every platform — Excel, Power BI, and Google Sheets in one product family
Whether you’re an Excel power user, a Power BI enthusiast, or a Google Workspace fan, there’s a
Team Performance Dashboard
built specifically for you.
🚀 Ready to Transform How You Track Team Performance?
Stop relying on scattered spreadsheets and manual reports. Invest in a smart, automated, and visually rich performance dashboard that gives you the insights you need — when you need them.
👇 Pick your platform and get started today:
Youtube.com/@NextGenTemplates