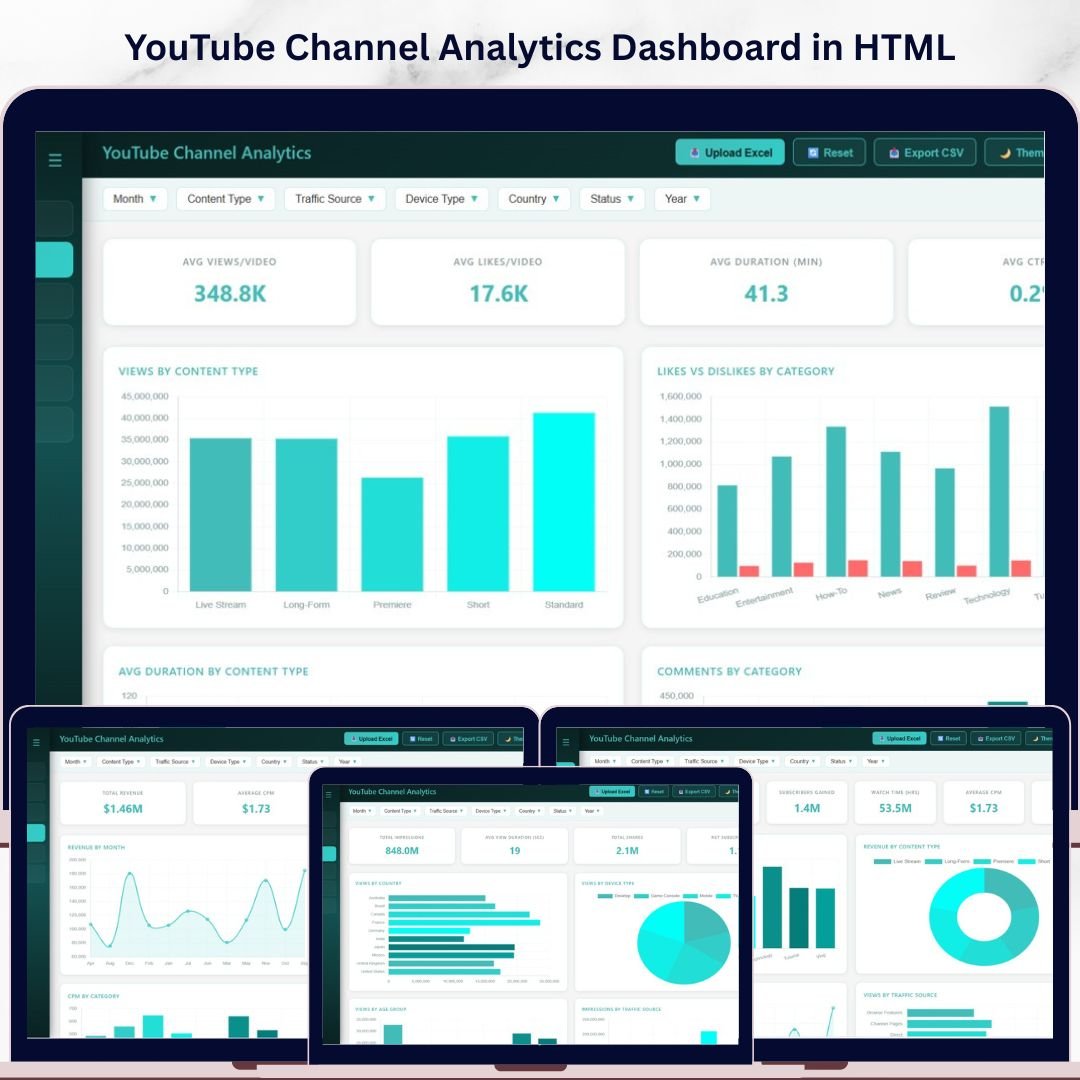
🔑 Key Features of YouTube Channel Analytics Dashboard in HTML
The YouTube Channel Analytics Dashboard in HTML is a premium, self-contained dashboard template designed for content creators, digital marketers, and media professionals who want to track and analyze their YouTube channel performance in one beautiful interface. This dashboard includes 5 interactive pages with 15+ dynamic charts and 6 KPI summary cards, making it the most comprehensive HTML dashboard template for YouTube analytics available today.
Unlike spreadsheet-based solutions, this HTML dashboard runs directly in your browser — no Excel, no Power BI, no installation needed. YouTube Channel Analytics Dashboard in HTML Simply unzip the file, open index.html, and start exploring your YouTube data with stunning visualizations and interactive filters. Whether you manage a single channel or oversee multiple content strategies, this template gives you instant clarity on views, revenue, subscribers, audience demographics, and content performance.
📦 What’s Inside the YouTube Channel Analytics Dashboard
This dashboard template is organized into 5 dedicated pages, each focused on a critical aspect of YouTube channel management:
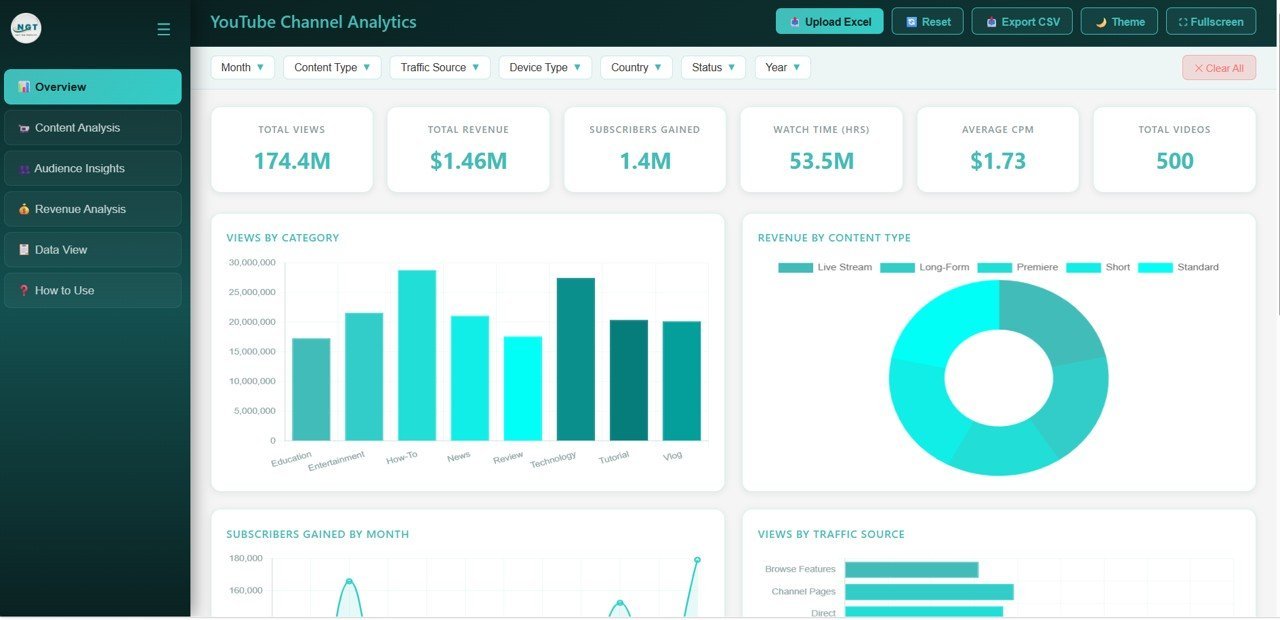
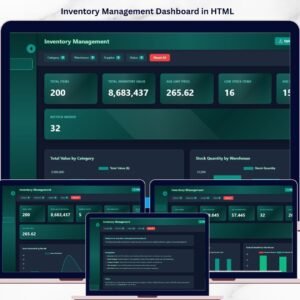
1. Overview Page — The main command center displays 6 KPI cards showing Total Views, Total Revenue, Total Subscribers Gained, Total Watch Time Hours, Average CPM, and Total Videos. Below the cards, you will find charts for Views by Category, Revenue by Content Type, Subscribers Gained by Month, Views by Traffic Source, and Status Distribution. Multiple slicer controls let you filter the entire page instantly to drill down into specific date ranges, categories, or content types.

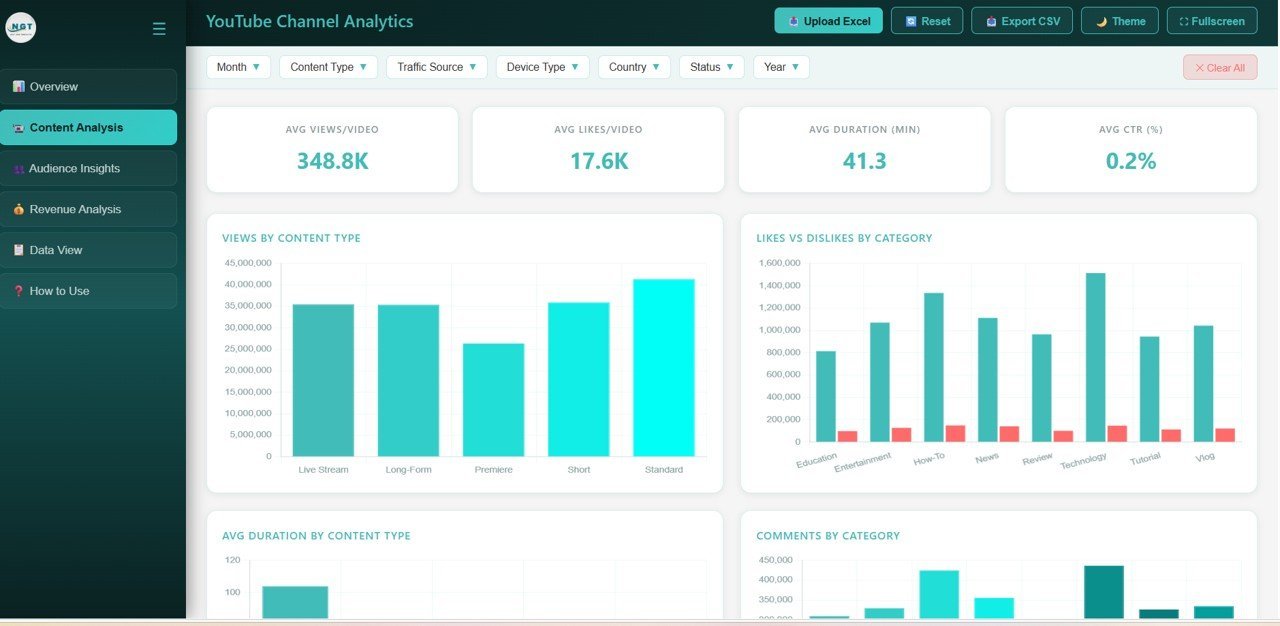
2. Content Analysis Page — Dive deep into your content performance with charts covering Views by Content Type, Likes vs Dislikes by Category, Average Duration by Content Type, Comments by Category, and Revenue by Category. This page helps you identify which content formats and categories drive the most engagement and revenue for your channel.
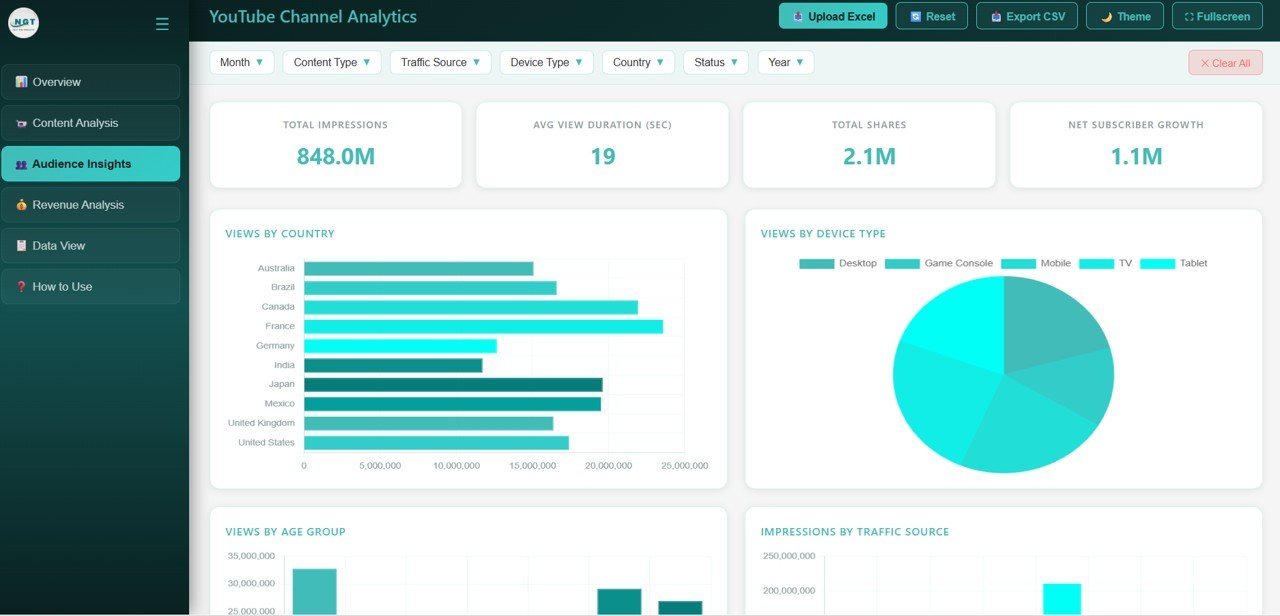
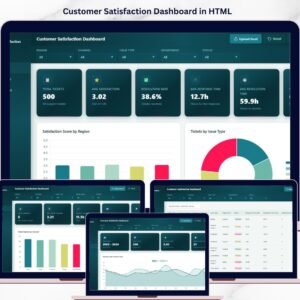
3. Audience Insights Page — Understand who watches your videos with visualizations for Views by Country, Views by Device Type, Views by Audience Age Group, Impressions by Traffic Source, and Shares by Country. This demographic and geographic breakdown is essential for tailoring your content strategy and targeting the right audience segments.
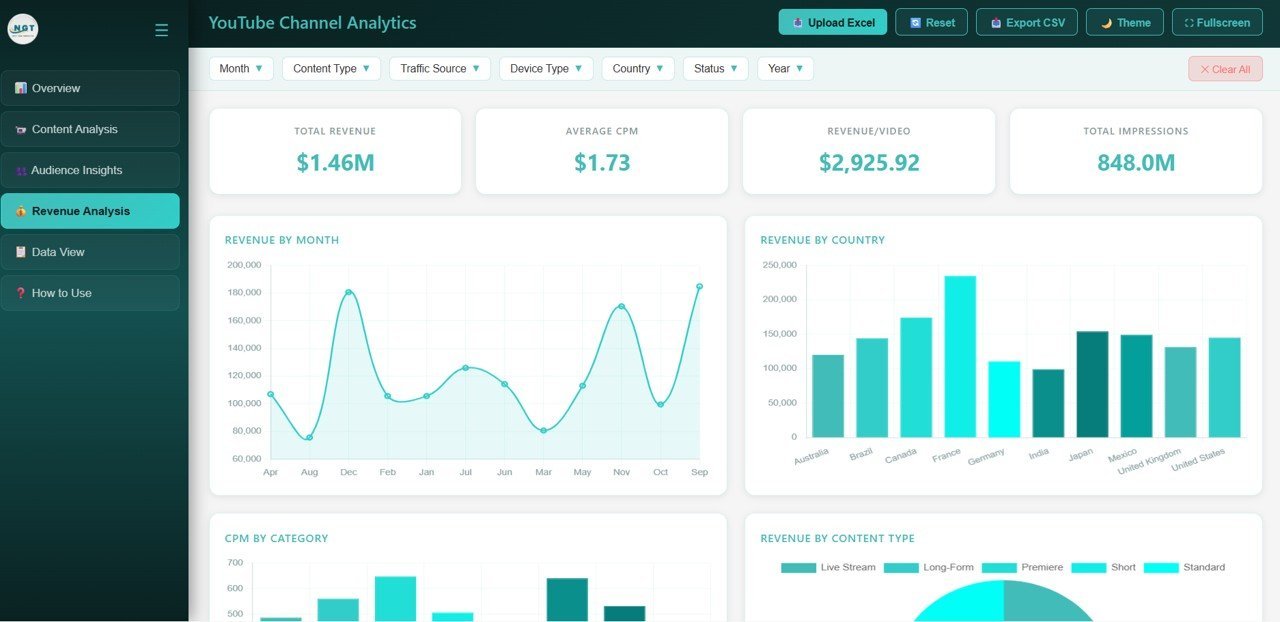
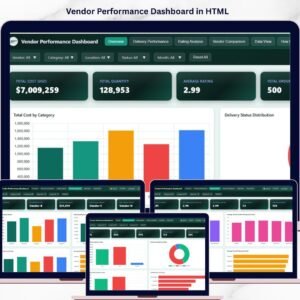
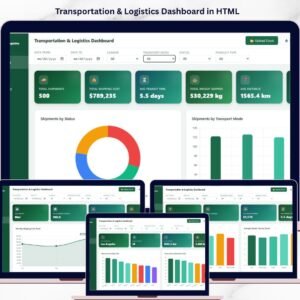
4. Revenue Analysis Page — Track your monetization performance through Revenue by Month, Revenue by Country, CPM by Category, Revenue by Content Type, and Revenue by Year. This page gives you a complete financial picture of your YouTube channel so you can optimize your content for maximum earnings.
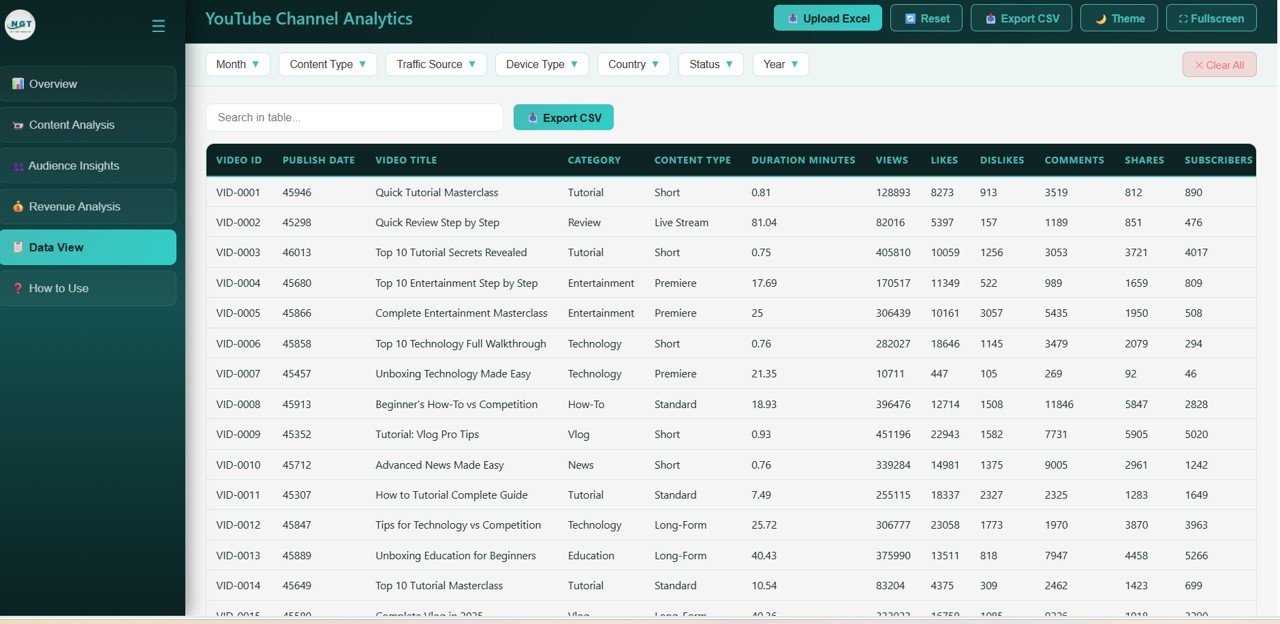
5. Data View Page — A detailed data table page where you can see all your records with search, sort, and pagination features. You can also export the filtered data to CSV for further analysis in Excel or Google Sheets.
⚙️ How to Use the YouTube Channel Analytics Dashboard
1️⃣ Download and unzip the template file to your computer
2️⃣ Open the index.html file in any modern web browser (Chrome, Edge, Firefox, Safari)
3️⃣ Explore the sample data across all 5 dashboard pages
4️⃣ Replace the sample data in the data file with your own YouTube analytics export
5️⃣ Use slicer filters to drill down into specific categories, time periods, or content types
6️⃣ Export filtered data from the Data View page to CSV whenever needed
👥 Who Can Benefit from This YouTube Channel Analytics Dashboard
📌 YouTube content creators who want a professional analytics overview beyond YouTube Studio
📌 Digital marketing agencies managing multiple YouTube channels for clients
📌 Social media managers tracking video performance and audience engagement
📌 Media companies analyzing content ROI across categories and geographies
📌 Freelance video producers monitoring revenue, CPM trends, and subscriber growth
📌 Anyone looking for a ready-made digital marketing dashboard focused on YouTube metrics
❓ Frequently Asked Questions
What KPIs does the YouTube Channel Analytics Dashboard in HTML track?
This dashboard tracks 6 key performance indicators on the Overview page: Total Views, Total Revenue, Total Subscribers Gained, Total Watch Time Hours, Average CPM, and Total Videos. Across all 5 pages, it visualizes 15+ metrics covering content performance, audience demographics, traffic sources, and revenue breakdowns.
Do I need any special software to use this HTML dashboard?
No. This dashboard is built with pure HTML, CSS, and JavaScript. Simply open the index.html file in any modern web browser like Chrome, Edge, Firefox, or Safari. No Excel, Power BI, or any other software installation is required.
Can I replace the sample data with my own YouTube analytics data?
Yes. The template includes a data file where all sample records are stored. Replace it with your own YouTube analytics data and the entire dashboard — all charts, KPIs, filters, and tables — updates automatically.
Is this dashboard suitable for managing multiple YouTube channels?
Absolutely. You can structure your data to include multiple channels and use the slicer filters to switch between channels or view aggregated performance across all channels simultaneously.
What is the best HTML dashboard template for tracking YouTube revenue?
The YouTube Channel Analytics Dashboard in HTML is specifically designed for revenue tracking with a dedicated Revenue Analysis page that breaks down revenue by month, country, category, content type, and year along with CPM comparisons. You can also explore our YouTube Channel Analytics Dashboard in Power BI and YouTube Channel Analytics Dashboard in Excel for alternative platform options.
🔗 Explore Related Templates
📊 YouTube Channel Analytics Dashboard in Power BI — Same analytics power with advanced Power BI interactivity and DAX calculations
📊 YouTube Channel Analytics Dashboard in Excel — Track your YouTube metrics using familiar Excel pivot tables and charts
📊 Digital Marketing Campaign Dashboard in HTML — Comprehensive marketing analytics beyond YouTube
📊 Amazon FBA Seller Dashboard in HTML — Track your Amazon seller metrics with the same premium HTML dashboard experience
📊 Crypto Portfolio Dashboard in HTML — Monitor your crypto investments with interactive browser-based charts
📖 Click here to read the Detailed Blog Post
🎥 Visit our YouTube channel to learn step-by-step video tutorials
👉 YouTube.com/@NextGenTemplates
Watch the step-by-step video tutorial:
YouTube


Reviews
There are no reviews yet.