The renewable energy industry is expanding rapidly, and wind turbine manufacturers must operate with precision, efficiency, and strict quality control to remain competitive. However, managing production performance through scattered spreadsheets and manual reports often leads to delays, hidden inefficiencies, and missed targets.
The Wind Turbine Manufacturing KPI Dashboard in Excel provides a powerful yet simple solution.
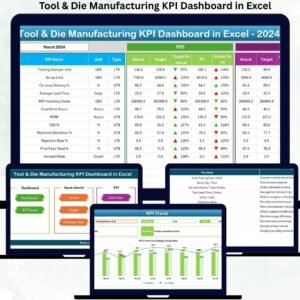
This ready-to-use Excel dashboard transforms complex manufacturing data into clear, actionable insights. Instead of reviewing multiple reports, production managers and decision-makers can monitor operational performance, compare targets, and analyze trends — all from one centralized dashboard.
Designed specifically for wind turbine manufacturing operations, this template helps organizations improve productivity, control costs, and enhance decision-making without investing in expensive software systems.
🔑 Key Feature of Wind Turbine Manufacturing KPI Dashboard in Excel
⚙️ Centralized KPI Monitoring
Track all manufacturing KPIs in one interactive dashboard view.
📊 MTD & YTD Performance Tracking
Monitor Month-to-Date and Year-to-Date performance instantly.
🎯 Target vs Actual Comparison
Identify performance gaps using automated variance indicators.
📈 Previous Year Performance Analysis
Measure improvement through historical comparisons.
📉 KPI Trend Visualization
Analyze performance trends with dynamic charts.
🧭 Smart Navigation Home Page
Quickly move across dashboard sheets using navigation buttons.
🔄 Automated Dashboard Updates
Select a month and watch the entire dashboard update automatically.
🧩 Fully Customizable Structure
Modify KPIs, targets, and formulas according to manufacturing needs.
💡 Conditional Formatting Indicators
Visual arrows instantly show performance improvement or decline.
📦 What’s Inside the Wind Turbine Manufacturing KPI Dashboard in Excel
The template includes 7 structured worksheets designed for complete performance management:

✔️ Home Sheet – Navigation center with interactive buttons
✔️ Dashboard Sheet – Main KPI performance overview
✔️ KPI Trend Sheet – Detailed trend analysis
✔️ Actual Numbers Input Sheet – Operational data entry
✔️ Target Sheet – Performance goal planning
✔️ Previous Year Sheet – Historical comparison tracking
✔️ KPI Definition Sheet – KPI formulas and documentation
Together, these sheets create a fully integrated manufacturing performance system.
🛠️ How to Use the Wind Turbine Manufacturing KPI Dashboard in Excel
Getting started is quick and simple:
Step 1: Define KPIs in the KPI Definition sheet
Step 2: Enter monthly targets in the Target sheet
Step 3: Add actual production data regularly
Step 4: Input previous year values for comparison
Step 5: Select the reporting month in cell D3
Step 6: Review automated insights and trends
Within minutes, you gain a professional manufacturing analytics system.
🎯 Who Can Benefit from This Wind Turbine Manufacturing KPI Dashboard in Excel
This dashboard is ideal for:
✅ Wind Turbine Manufacturers
✅ Renewable Energy Production Teams
✅ Plant Managers & Supervisors
✅ Quality Control Teams
✅ Manufacturing Analysts
✅ Operations Managers
✅ Supply Chain Coordinators
Whether you operate a small production unit or a large manufacturing plant, this dashboard supports scalable performance tracking.
Why This Dashboard Improves Manufacturing Performance
Instead of manual reporting, you gain:
✔️ Real-time production visibility
✔️ Faster performance evaluation
✔️ Improved quality monitoring
✔️ Better cost control
✔️ Data-driven operational decisions
✔️ Enhanced accountability across departments
As a result, manufacturers improve efficiency while supporting sustainable energy growth.
### Click hare to read the Detailed blog post
📺 Visit our YouTube channel to learn step-by-step video tutorials
👉 Youtube.com/@PKAnExcelExpert