


Freshwater scarcity is becoming a major global challenge. Many countries now rely on water desalination plants to convert seawater into clean and drinkable water. Water Desalination KPI Dashboard in Excel However, managing a desalination facility requires constant monitoring of complex operational metrics such as water production efficiency, energy consumption, plant utilization, system downtime, and operational costs.
Without a structured monitoring system, plant managers often struggle to analyze performance data, compare results with targets, and identify operational inefficiencies. This is where the Water Desalination KPI Dashboard in Excel becomes an essential management tool.
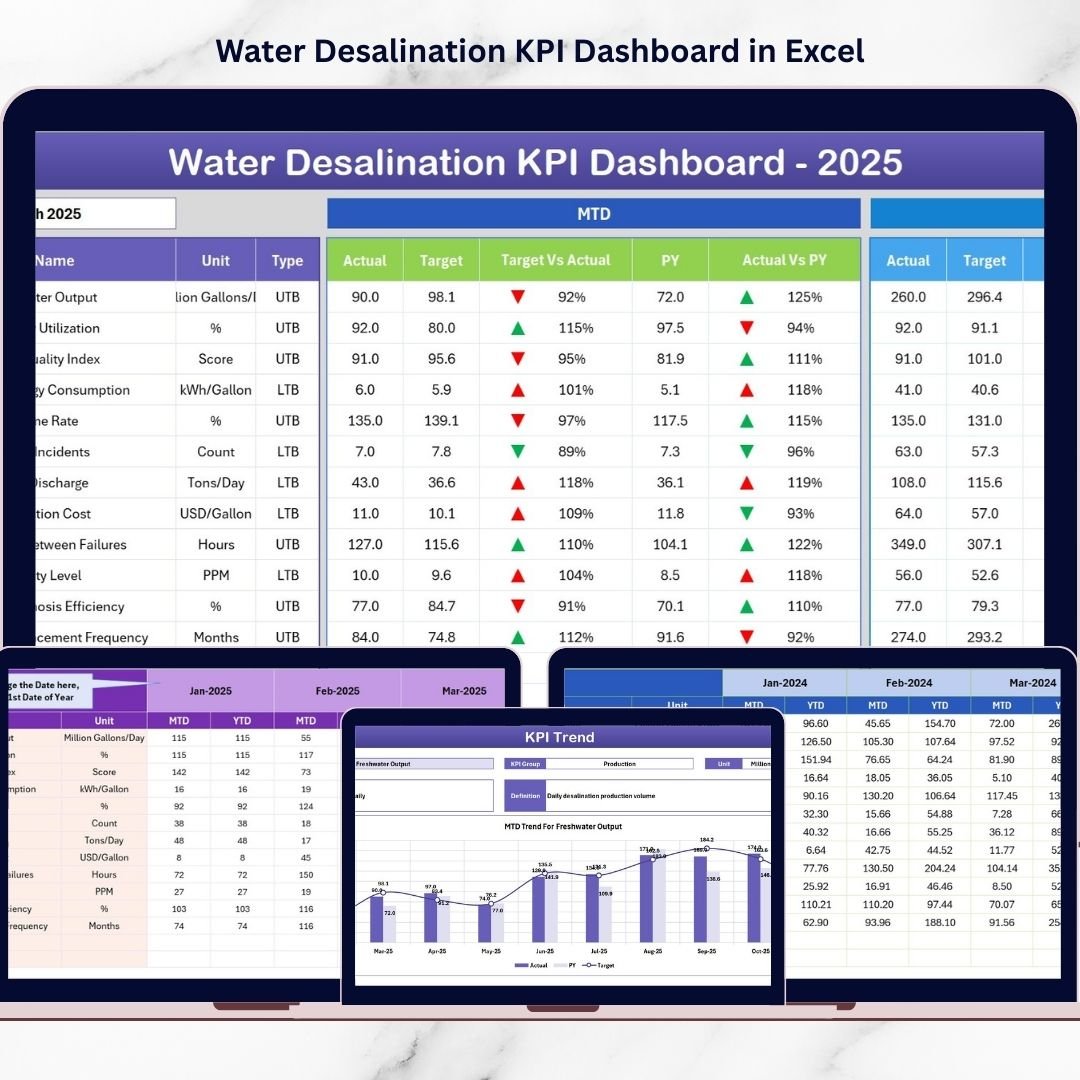
The Water Desalination KPI Dashboard in Excel is a ready-to-use performance monitoring template designed to track critical KPIs of desalination plant operations. Using Excel’s powerful analytical capabilities such as charts, conditional formatting indicators, KPI calculations, and automated comparisons, this dashboard transforms raw operational data into clear visual insights.
Water Desalination KPI Dashboard in Excel Instead of manually analyzing large spreadsheets, managers can instantly monitor plant performance through KPI indicators, trend charts, and target comparisons. This allows organizations to quickly detect operational issues, monitor energy usage, track water production efficiency, and evaluate system performance.
The dashboard also enables organizations to compare actual results with targets and previous year performance, providing valuable insights into plant efficiency improvements over time.
Whether you manage desalination plants, water treatment facilities, or utility infrastructure, this Excel dashboard provides a structured analytical framework to improve operational visibility and support data-driven decisions.
💧 Key Feature of Water Desalination KPI Dashboard in Excel
📊 Centralized KPI Monitoring
Track critical desalination KPIs such as water production efficiency, energy consumption, plant utilization, and operational cost in one dashboard.
📈 Month-to-Date and Year-to-Date Analysis
Monitor MTD and YTD performance metrics to evaluate operational progress throughout the year.
🎯 Target vs Actual Performance Comparison
Quickly identify whether plant performance meets operational targets.
📉 Previous Year Performance Comparison
Analyze historical performance and measure long-term operational improvements.
📊 Conditional Formatting Indicators
Visual up and down arrows highlight performance improvements or declines instantly.
📅 Dynamic Month Selection
Select any month from the dropdown menu and instantly update the entire dashboard.
📉 Detailed KPI Trend Analysis
Analyze performance trends across multiple KPIs using automated charts.
⚡ Fully Excel-Based Analytical System
No expensive software required. The entire dashboard runs inside Microsoft Excel.
📦 What’s Inside the Water Desalination KPI Dashboard in Excel
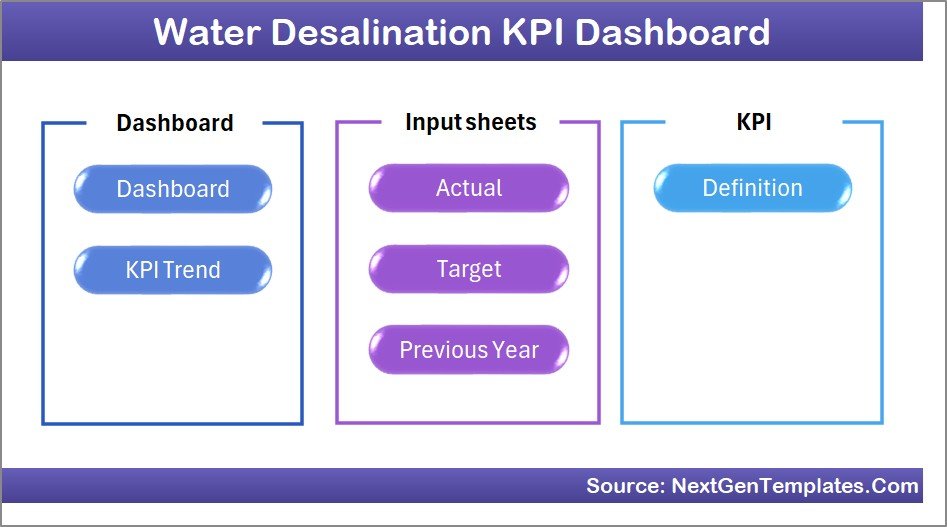
This ready-to-use Excel template includes seven structured worksheets designed for comprehensive desalination plant KPI monitoring.
Home Sheet
The Home sheet acts as the dashboard index page and contains navigation buttons to quickly access different sections of the dashboard.
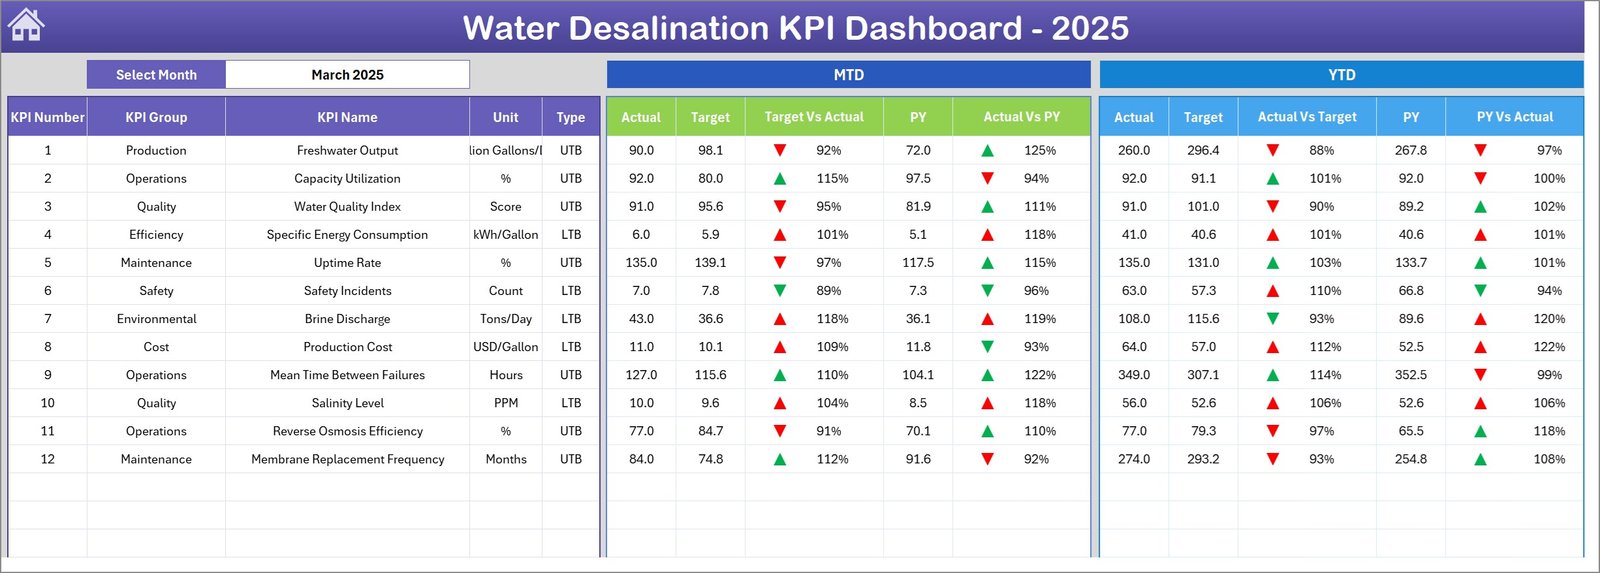
Dashboard Sheet
The main KPI monitoring page where users can analyze MTD actual values, target values, and previous year performance comparisons.
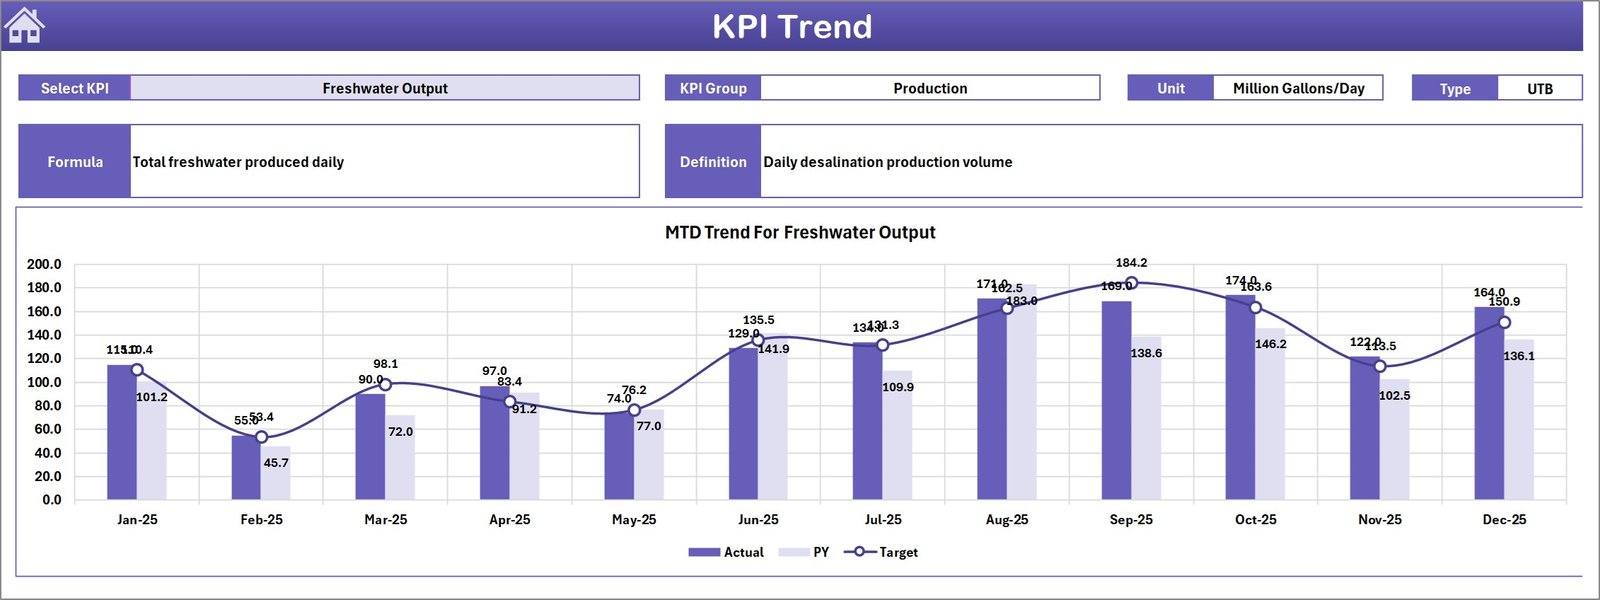
KPI Trend Sheet
Provides detailed trend analysis for each KPI, including MTD and YTD charts that compare actual values, targets, and previous year performance.
Actual Numbers Input Sheet
Allows users to enter current-year KPI performance data such as MTD and YTD values.
Target Sheet
Stores monthly target values for each KPI, enabling target vs actual performance comparisons.
Previous Year Number Sheet
Stores historical KPI data for year-over-year performance analysis.
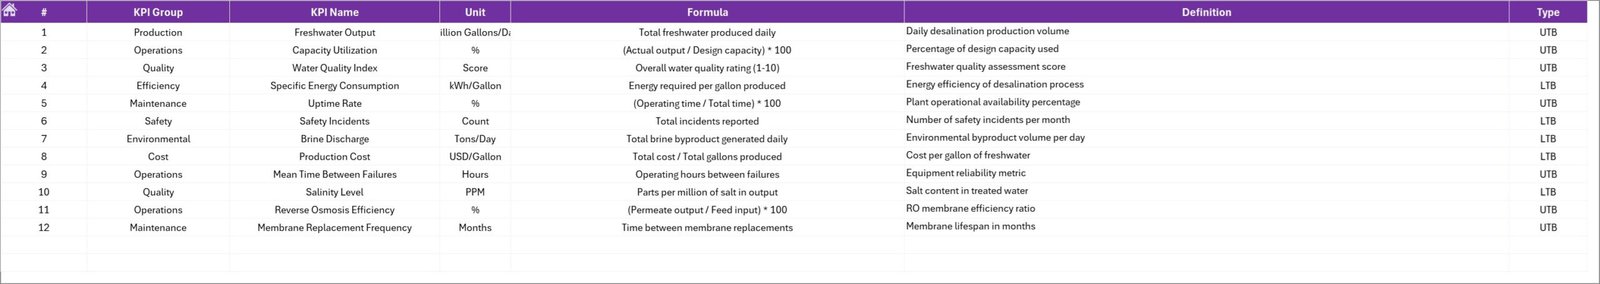
KPI Definition Sheet
Acts as a KPI reference library containing KPI names, groups, units of measurement, formulas, and definitions.
🧭 How to Use the Water Desalination KPI Dashboard in Excel
Using the dashboard is simple and requires only basic Excel knowledge.
Step 1 – Define KPIs
Enter KPI details such as KPI name, group, unit, formula, and definition in the KPI Definition Sheet.
Step 2 – Enter Target Values
Input monthly MTD and YTD target values in the Target Sheet.
Step 3 – Enter Actual Performance Data
Update plant performance data in the Actual Numbers Input Sheet.
Step 4 – Add Previous Year Data
Enter historical KPI data to enable year-over-year comparisons.
Step 5 – Analyze Dashboard Insights
Select the desired month and analyze performance indicators, trends, and comparisons.
This workflow allows managers to quickly monitor plant efficiency and identify improvement opportunities.
👥 Who Can Benefit from This Water Desalination KPI Dashboard
This dashboard is ideal for organizations managing water treatment and desalination operations.
💧 Desalination plant operators
🏭 Water utility companies
🌍 Government water authorities
⚙️ Infrastructure management teams
👷 Environmental engineers
📊 Operations managers
📈 Utility performance analysts
Any organization responsible for water treatment operations can use this dashboard to improve performance monitoring and operational efficiency.
Click hare to read the Detailed blog post
Visit our YouTube channel to learn step-by-step video tutorials
👉 https://youtube.com/@PKAnExcelExpert